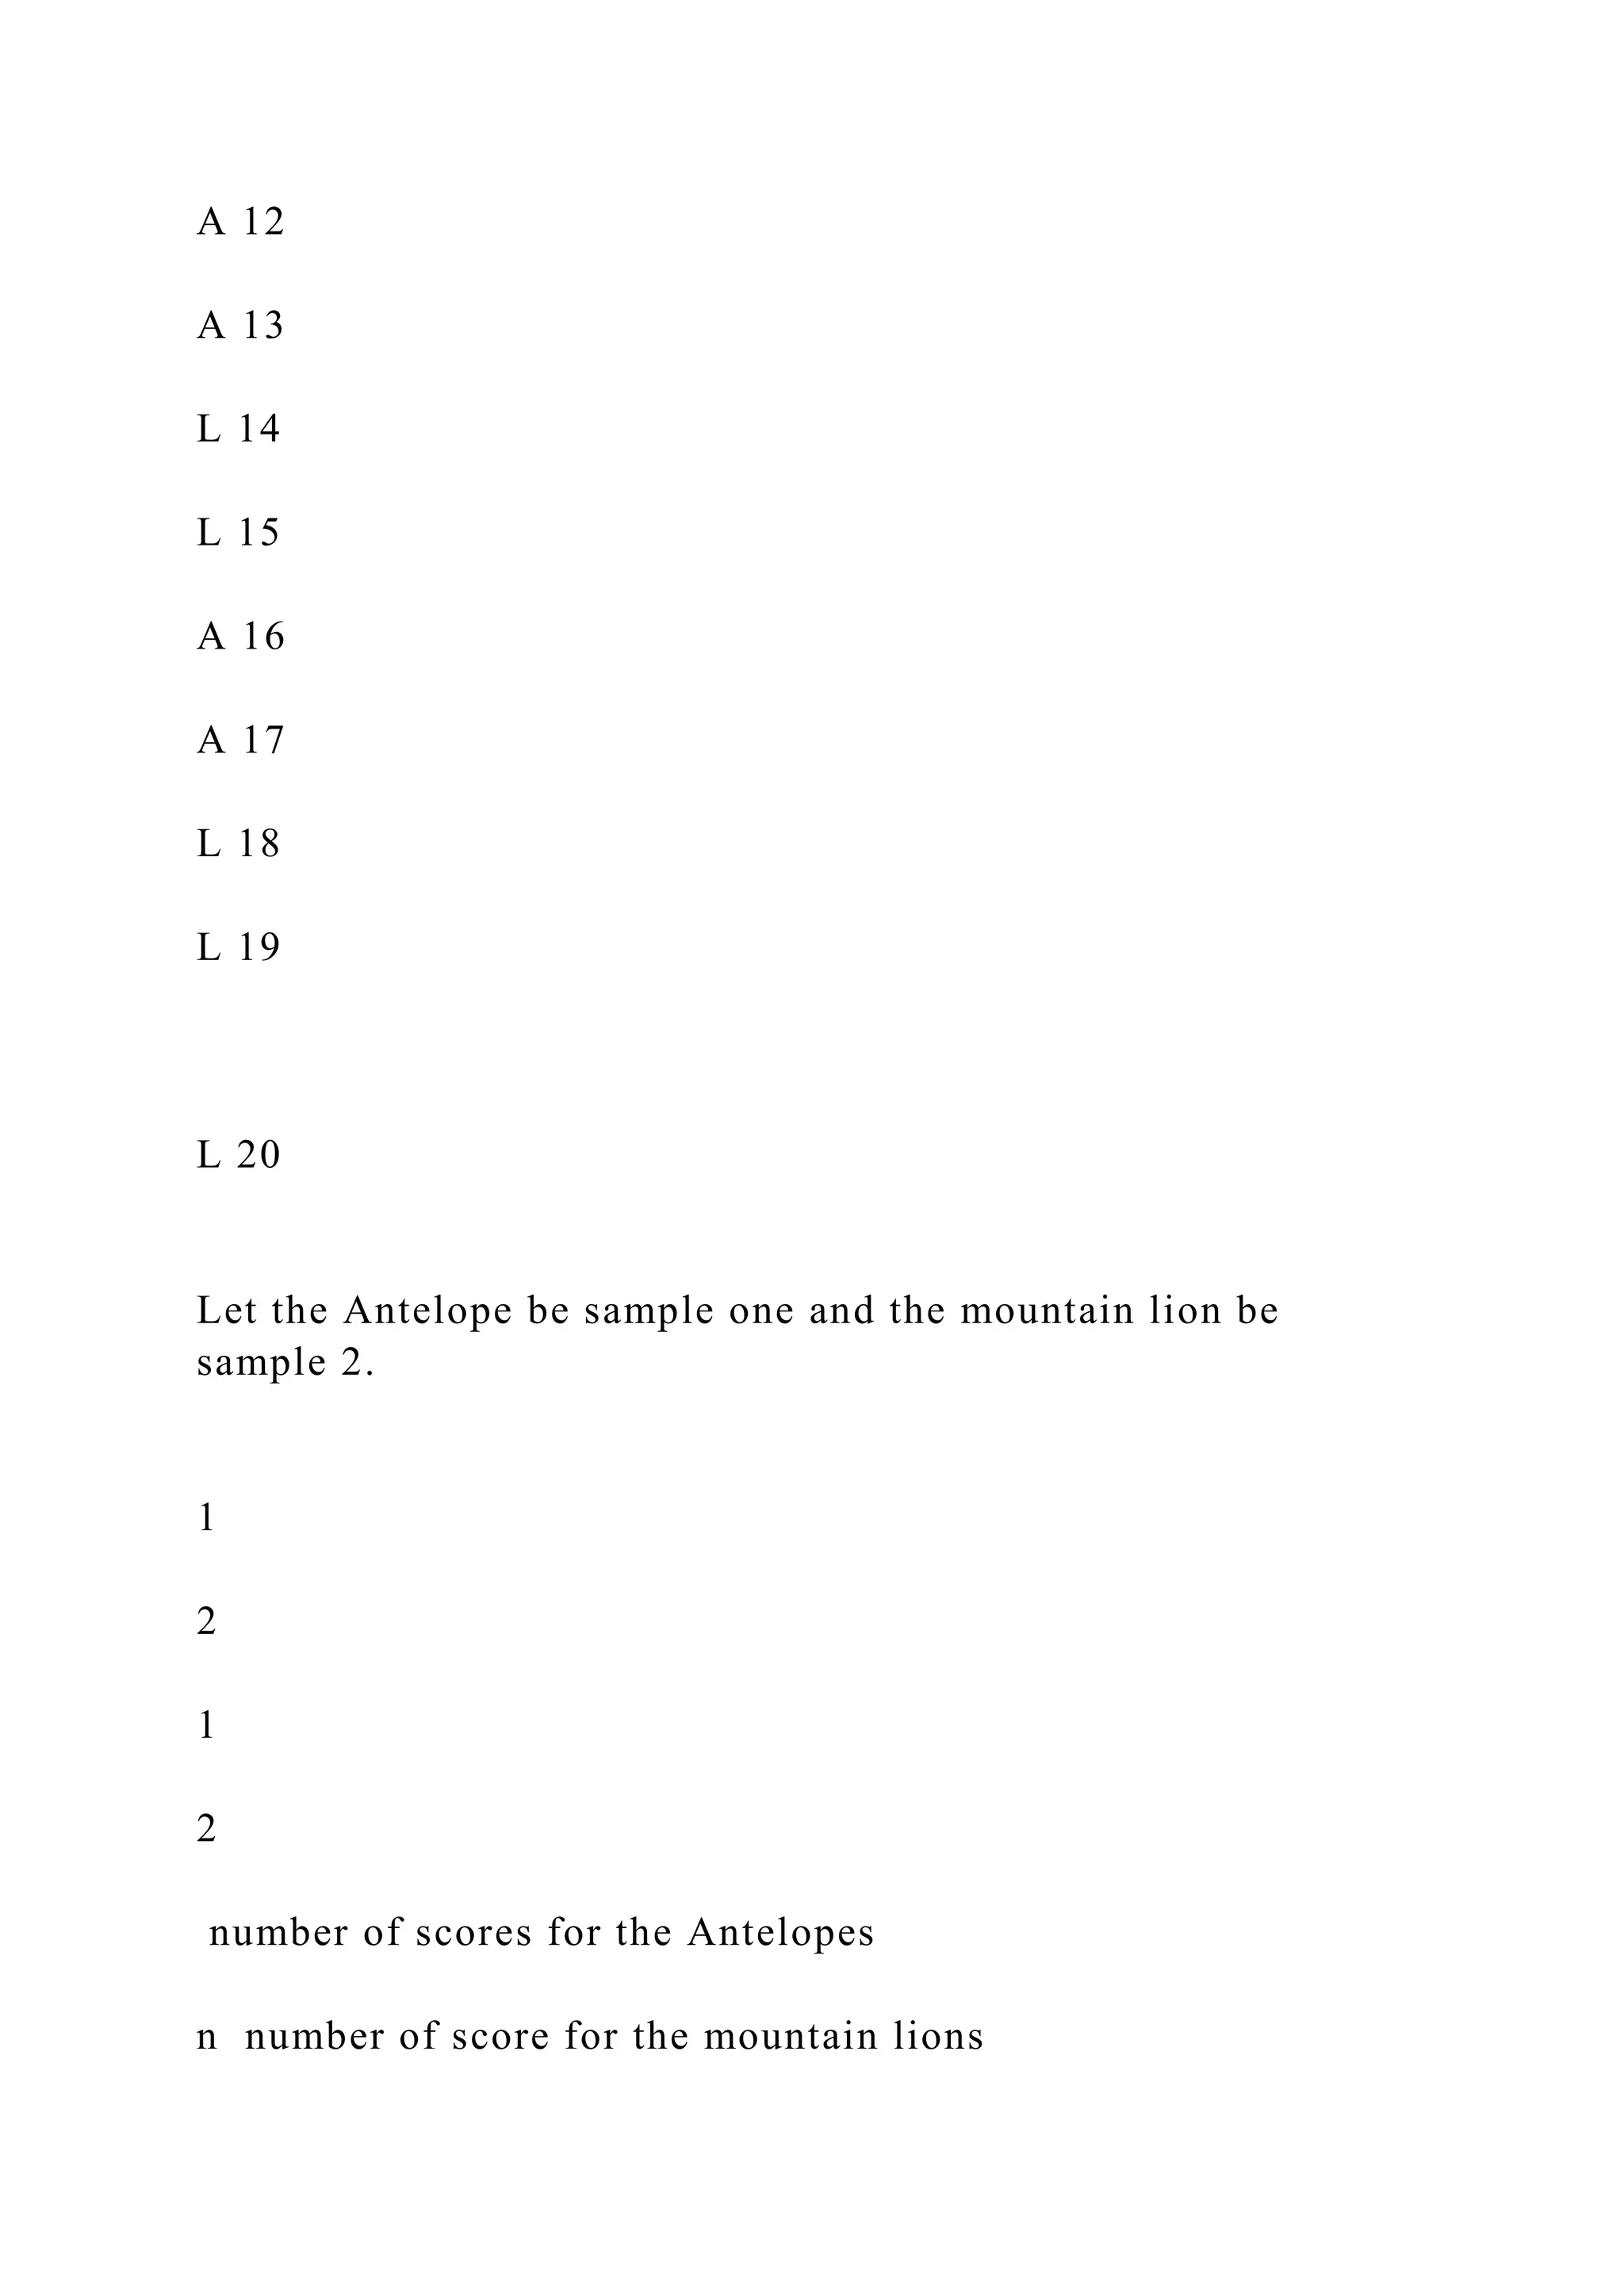
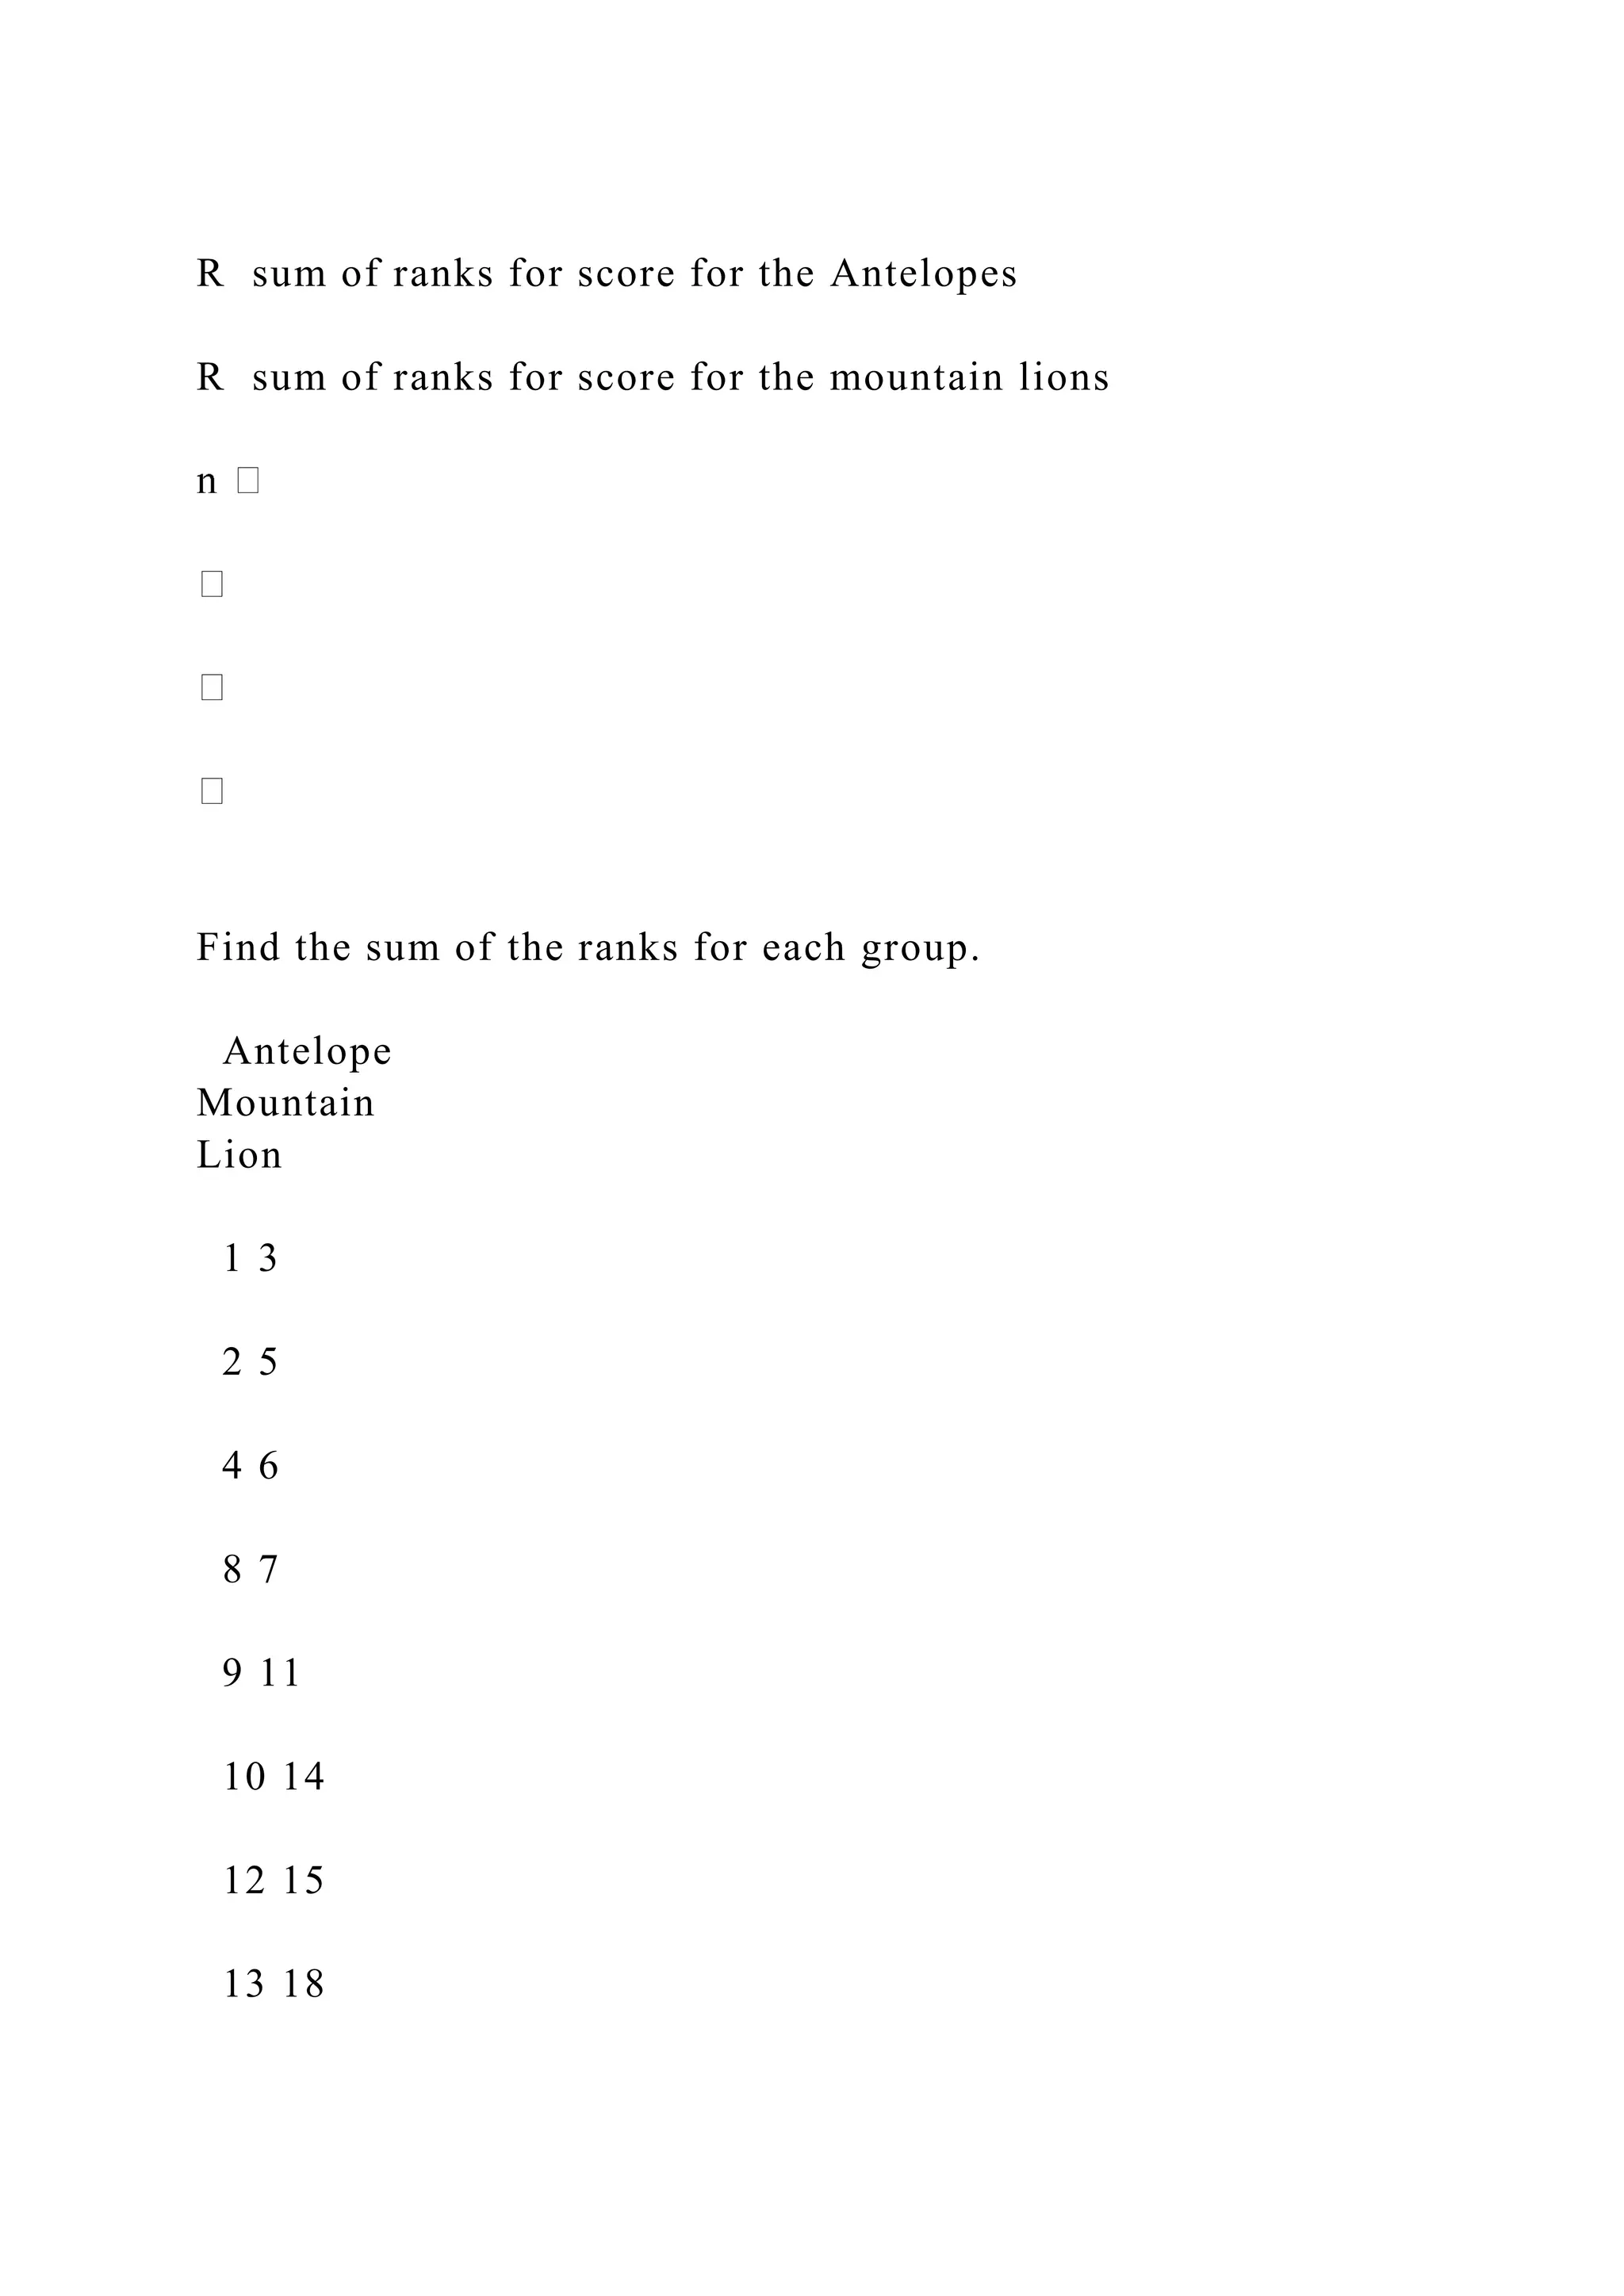
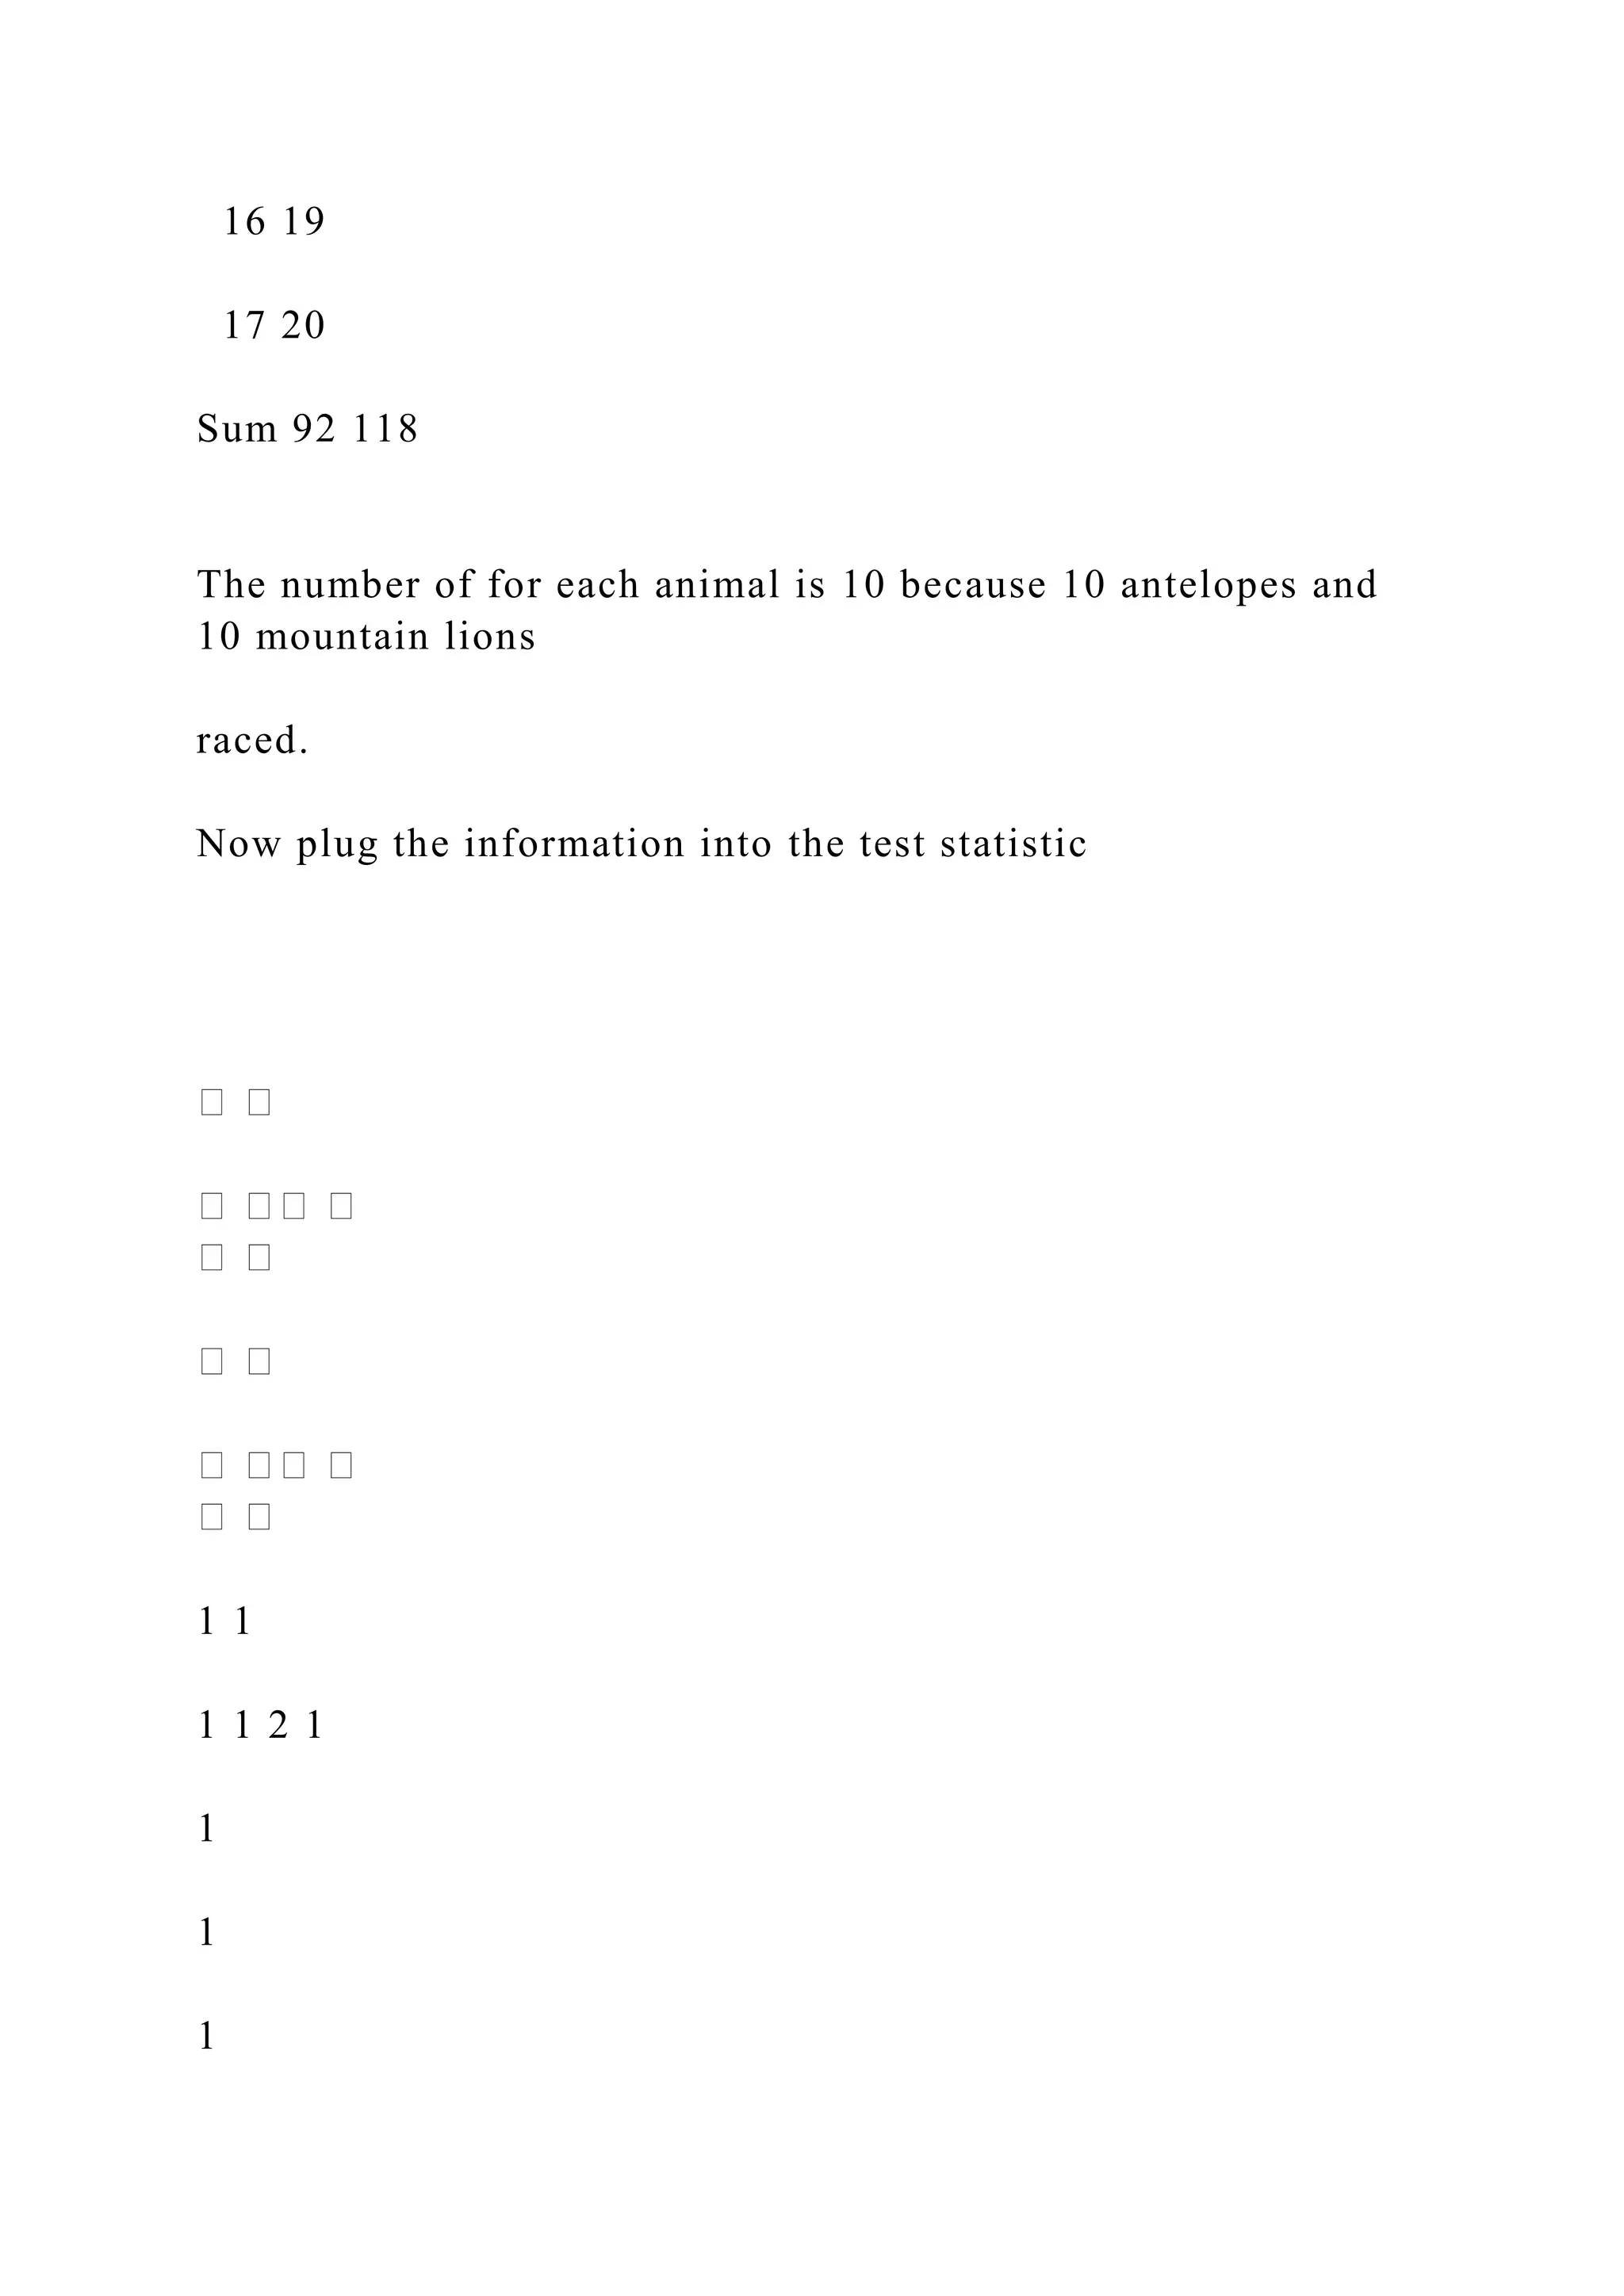
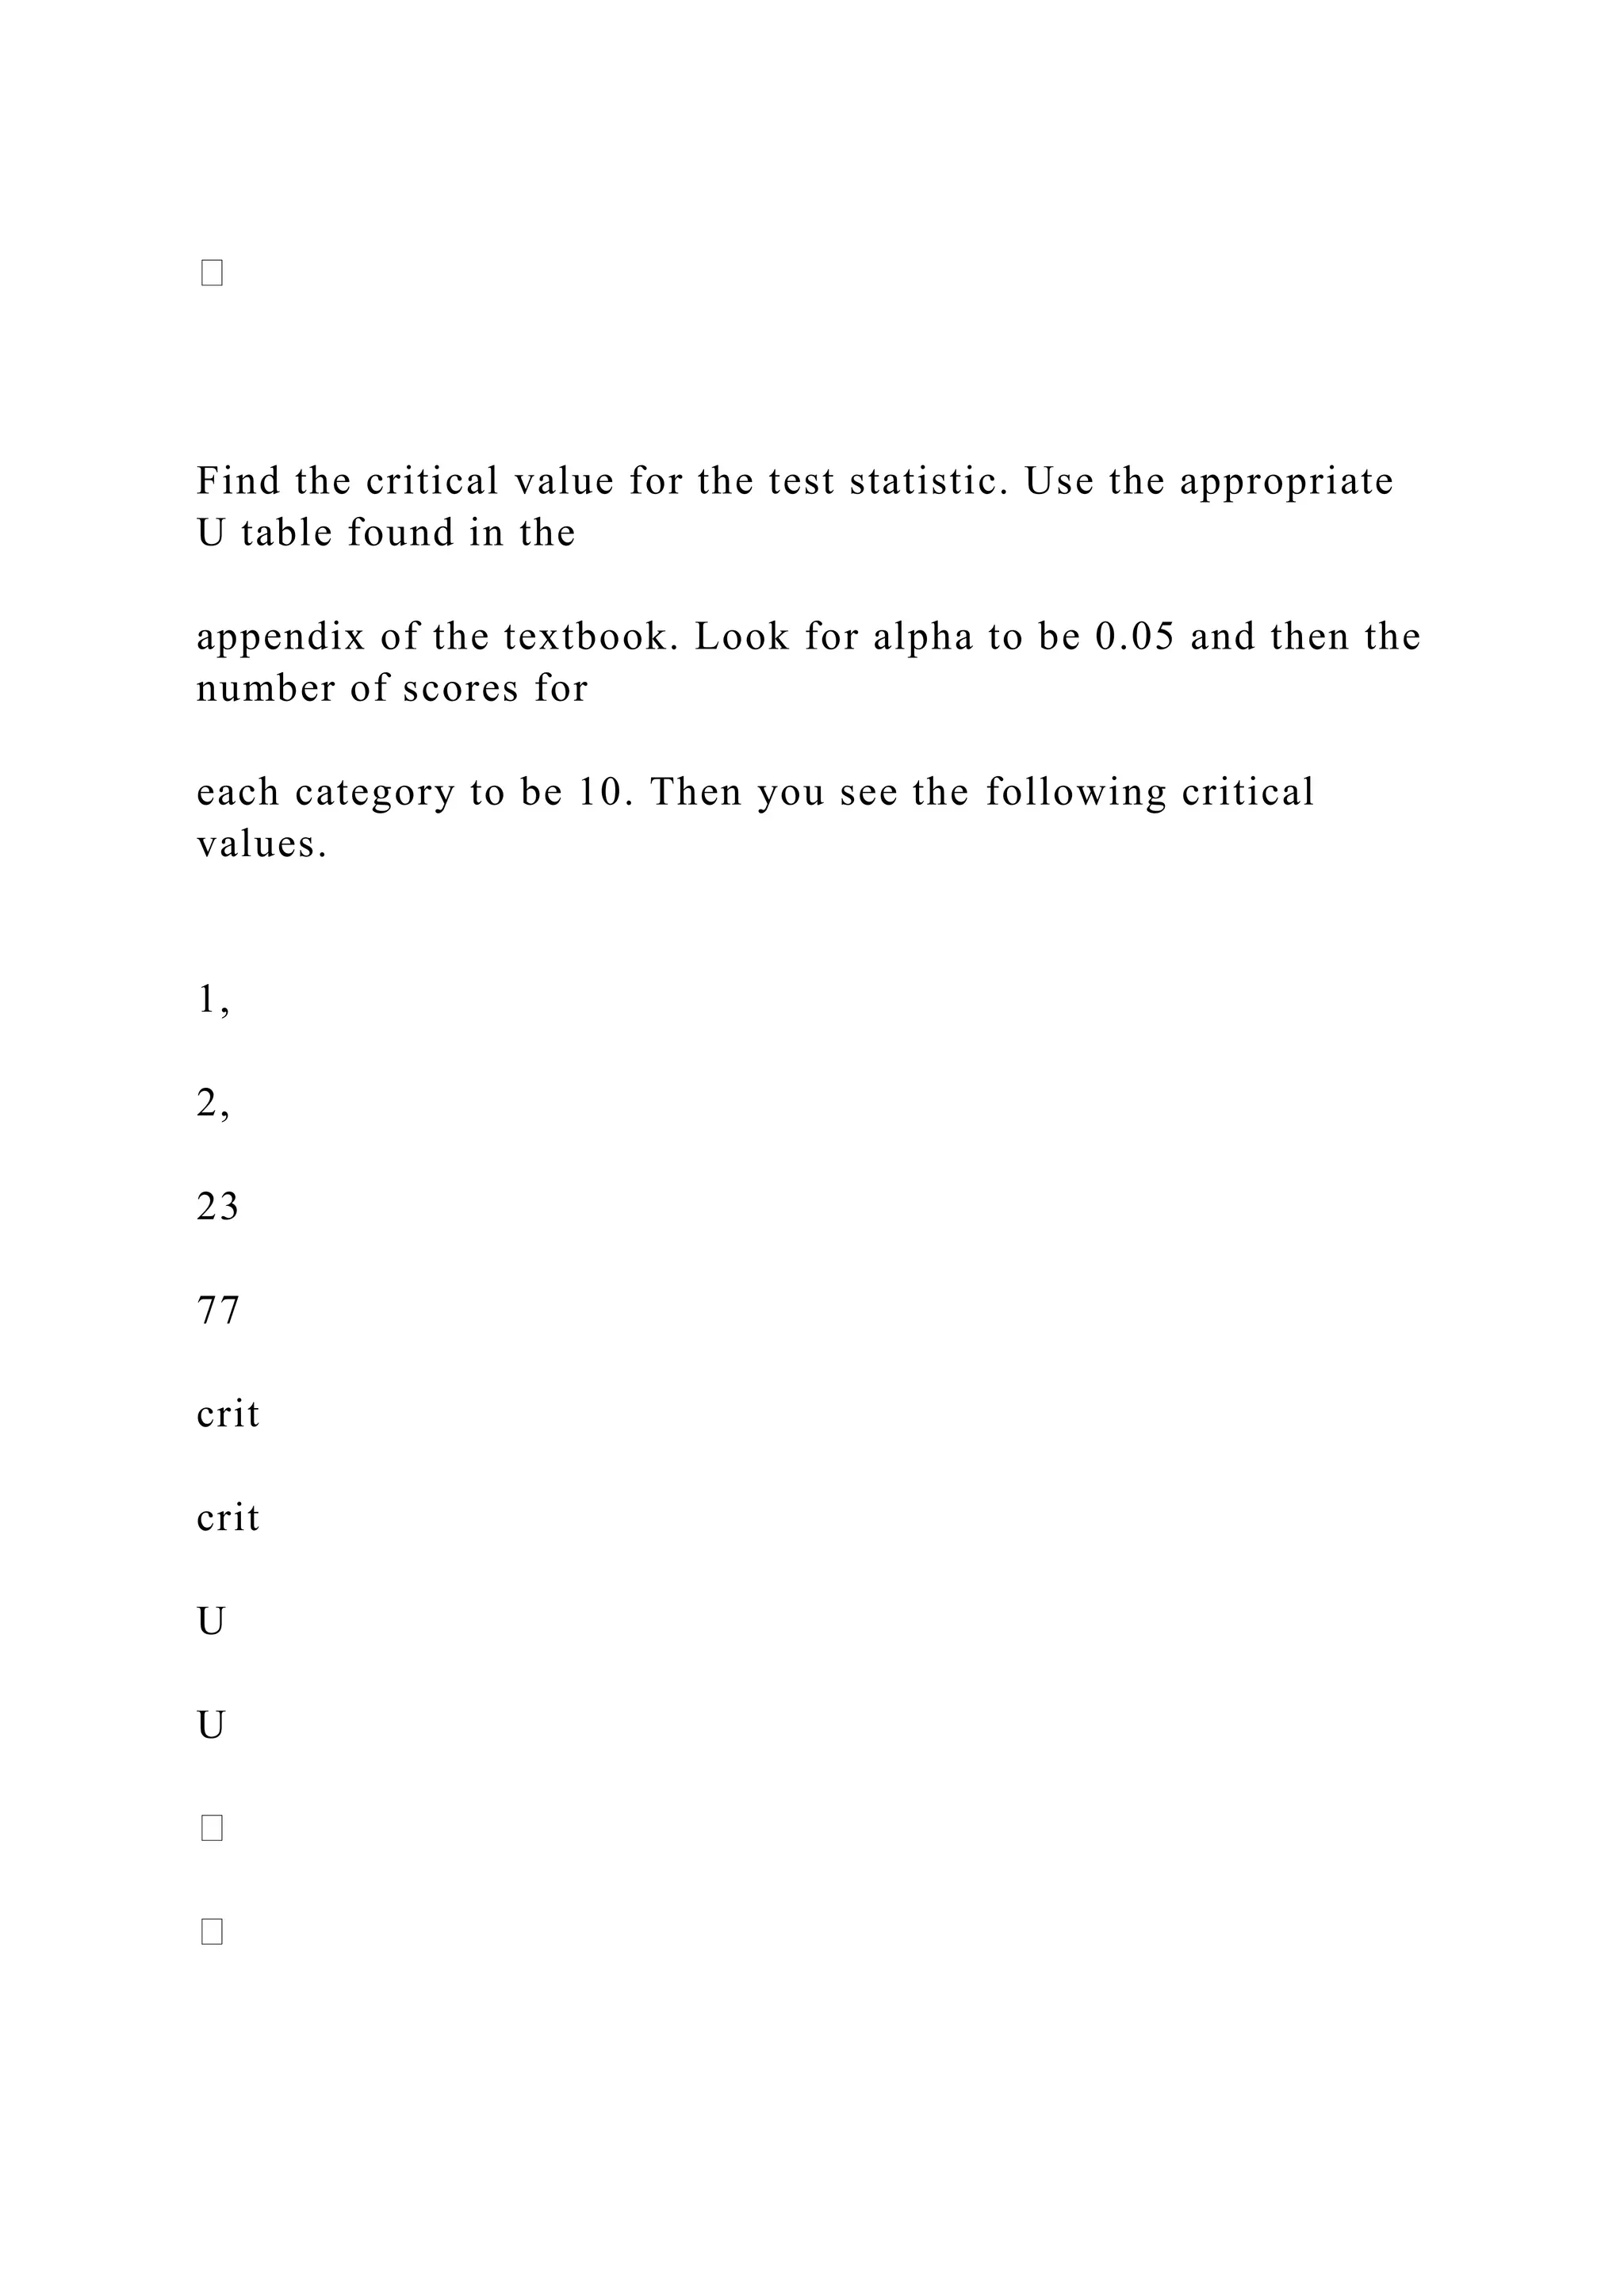
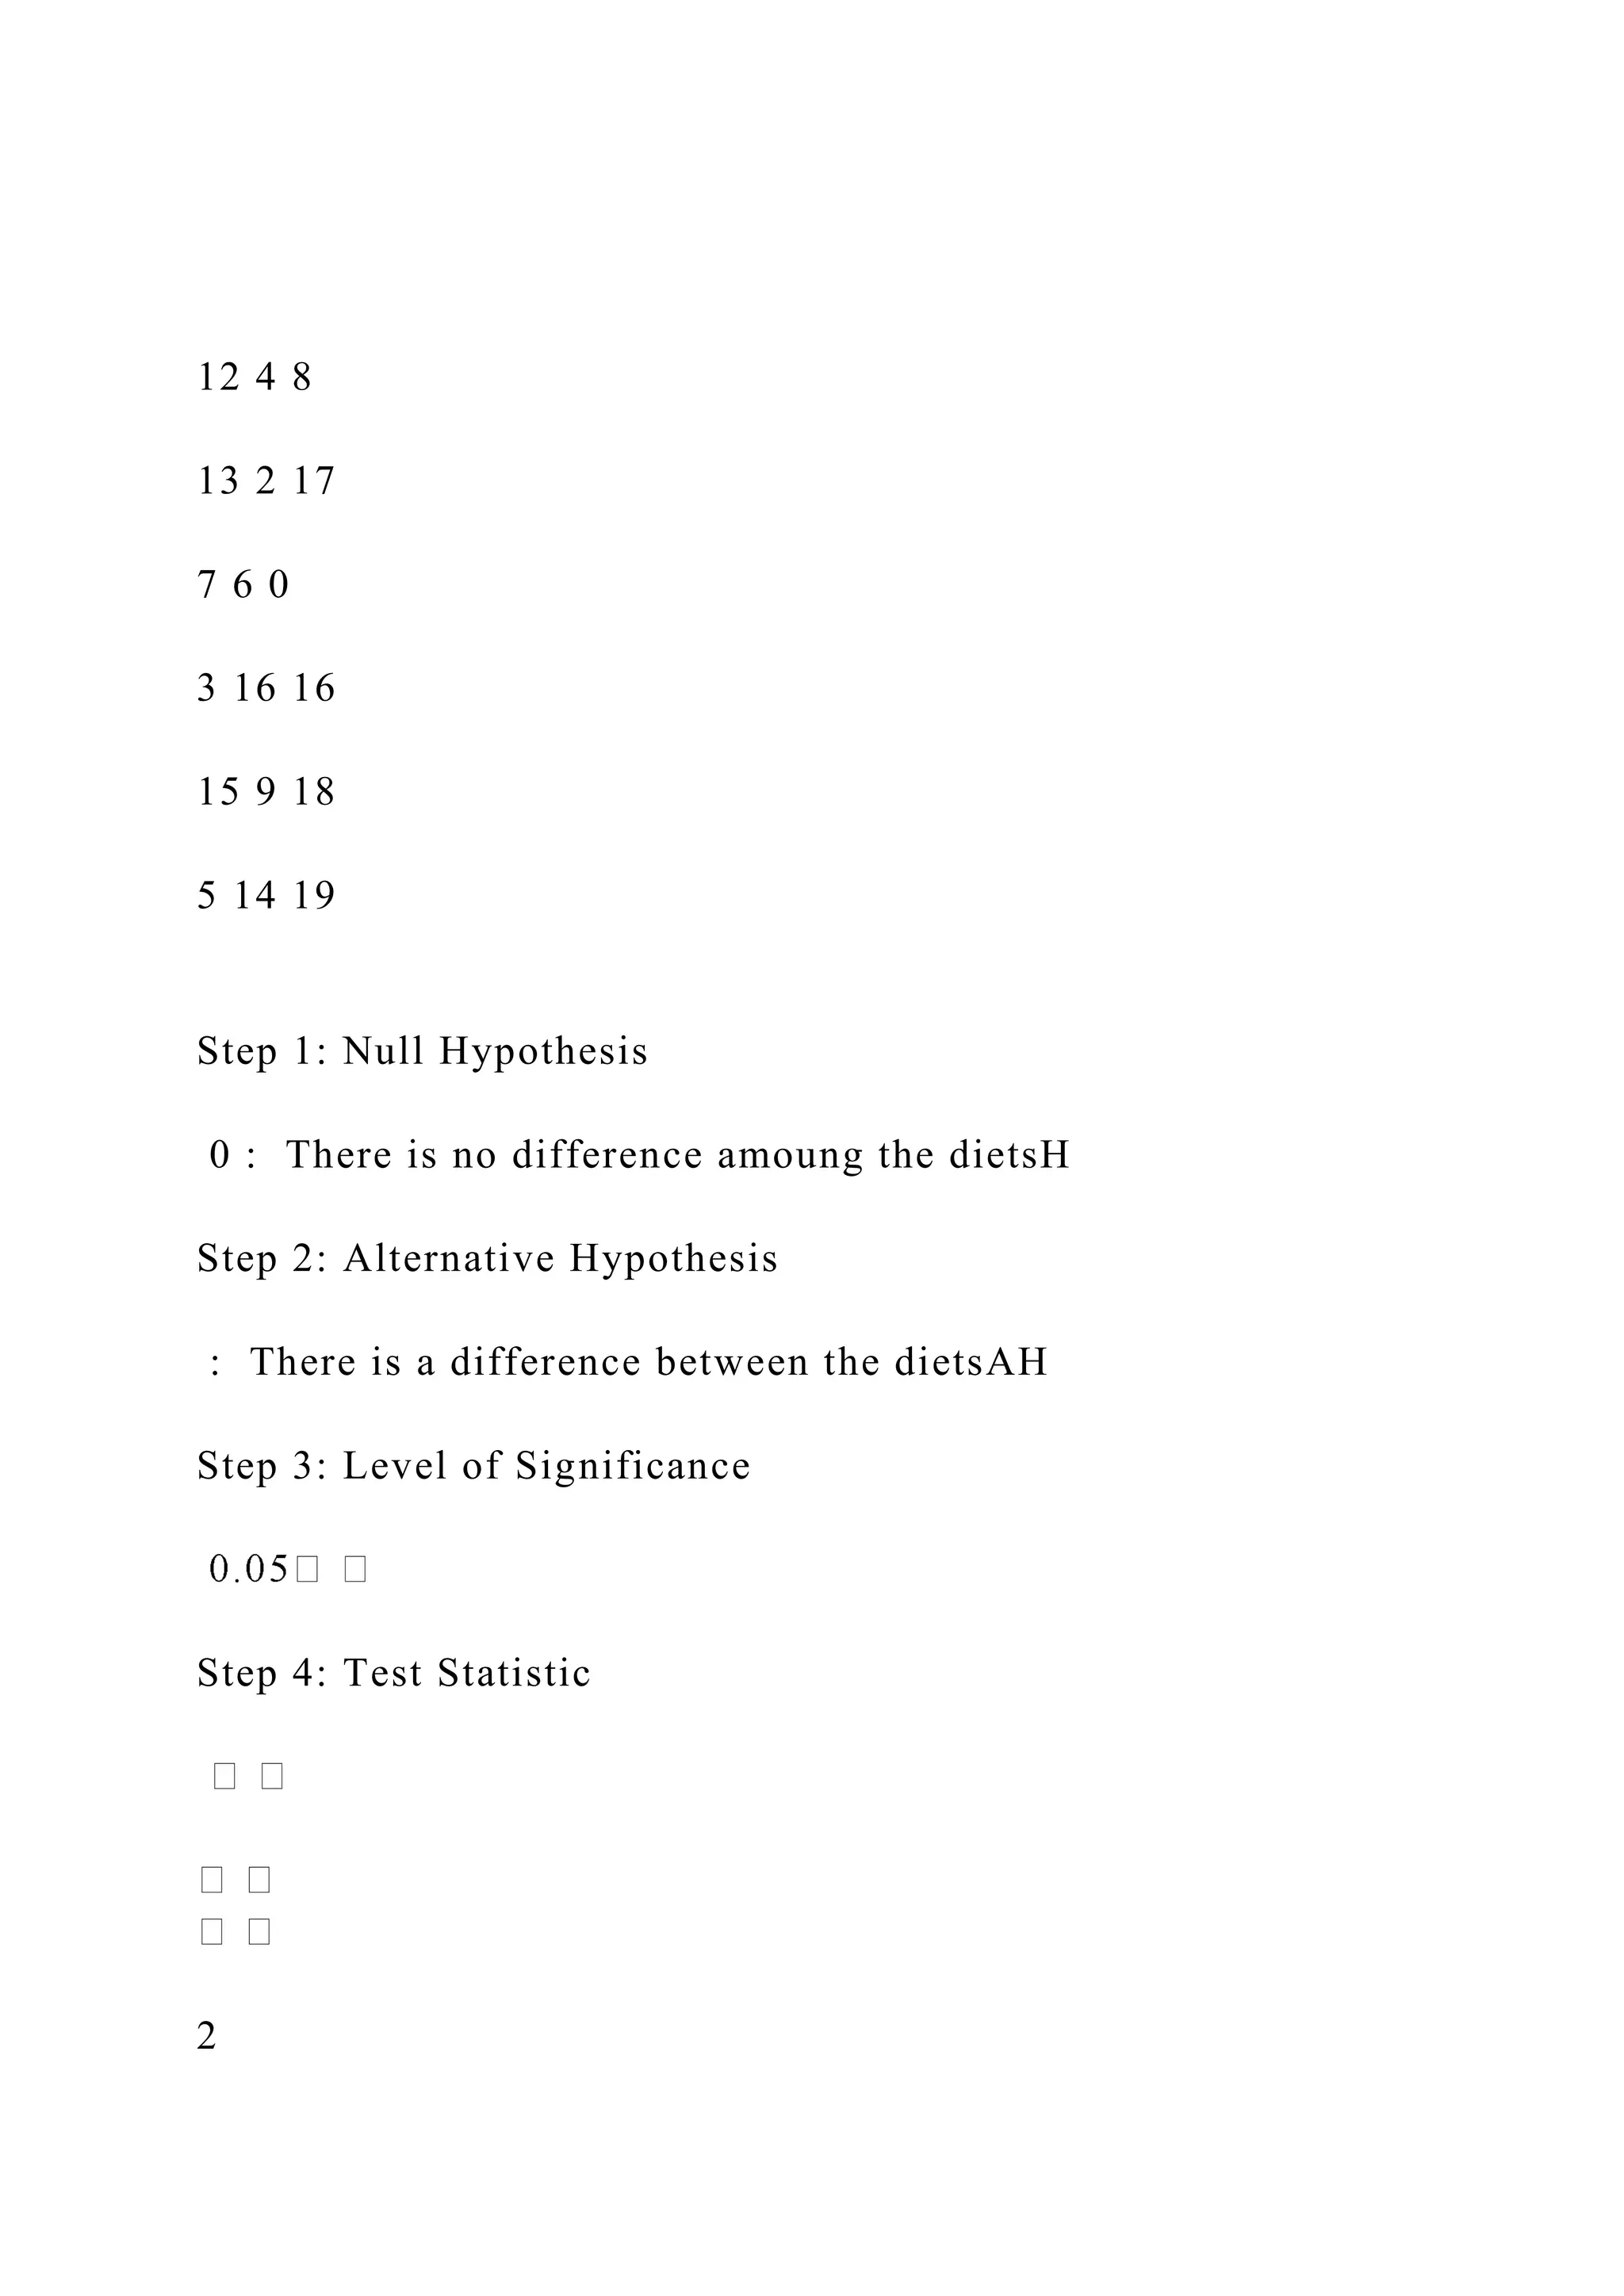
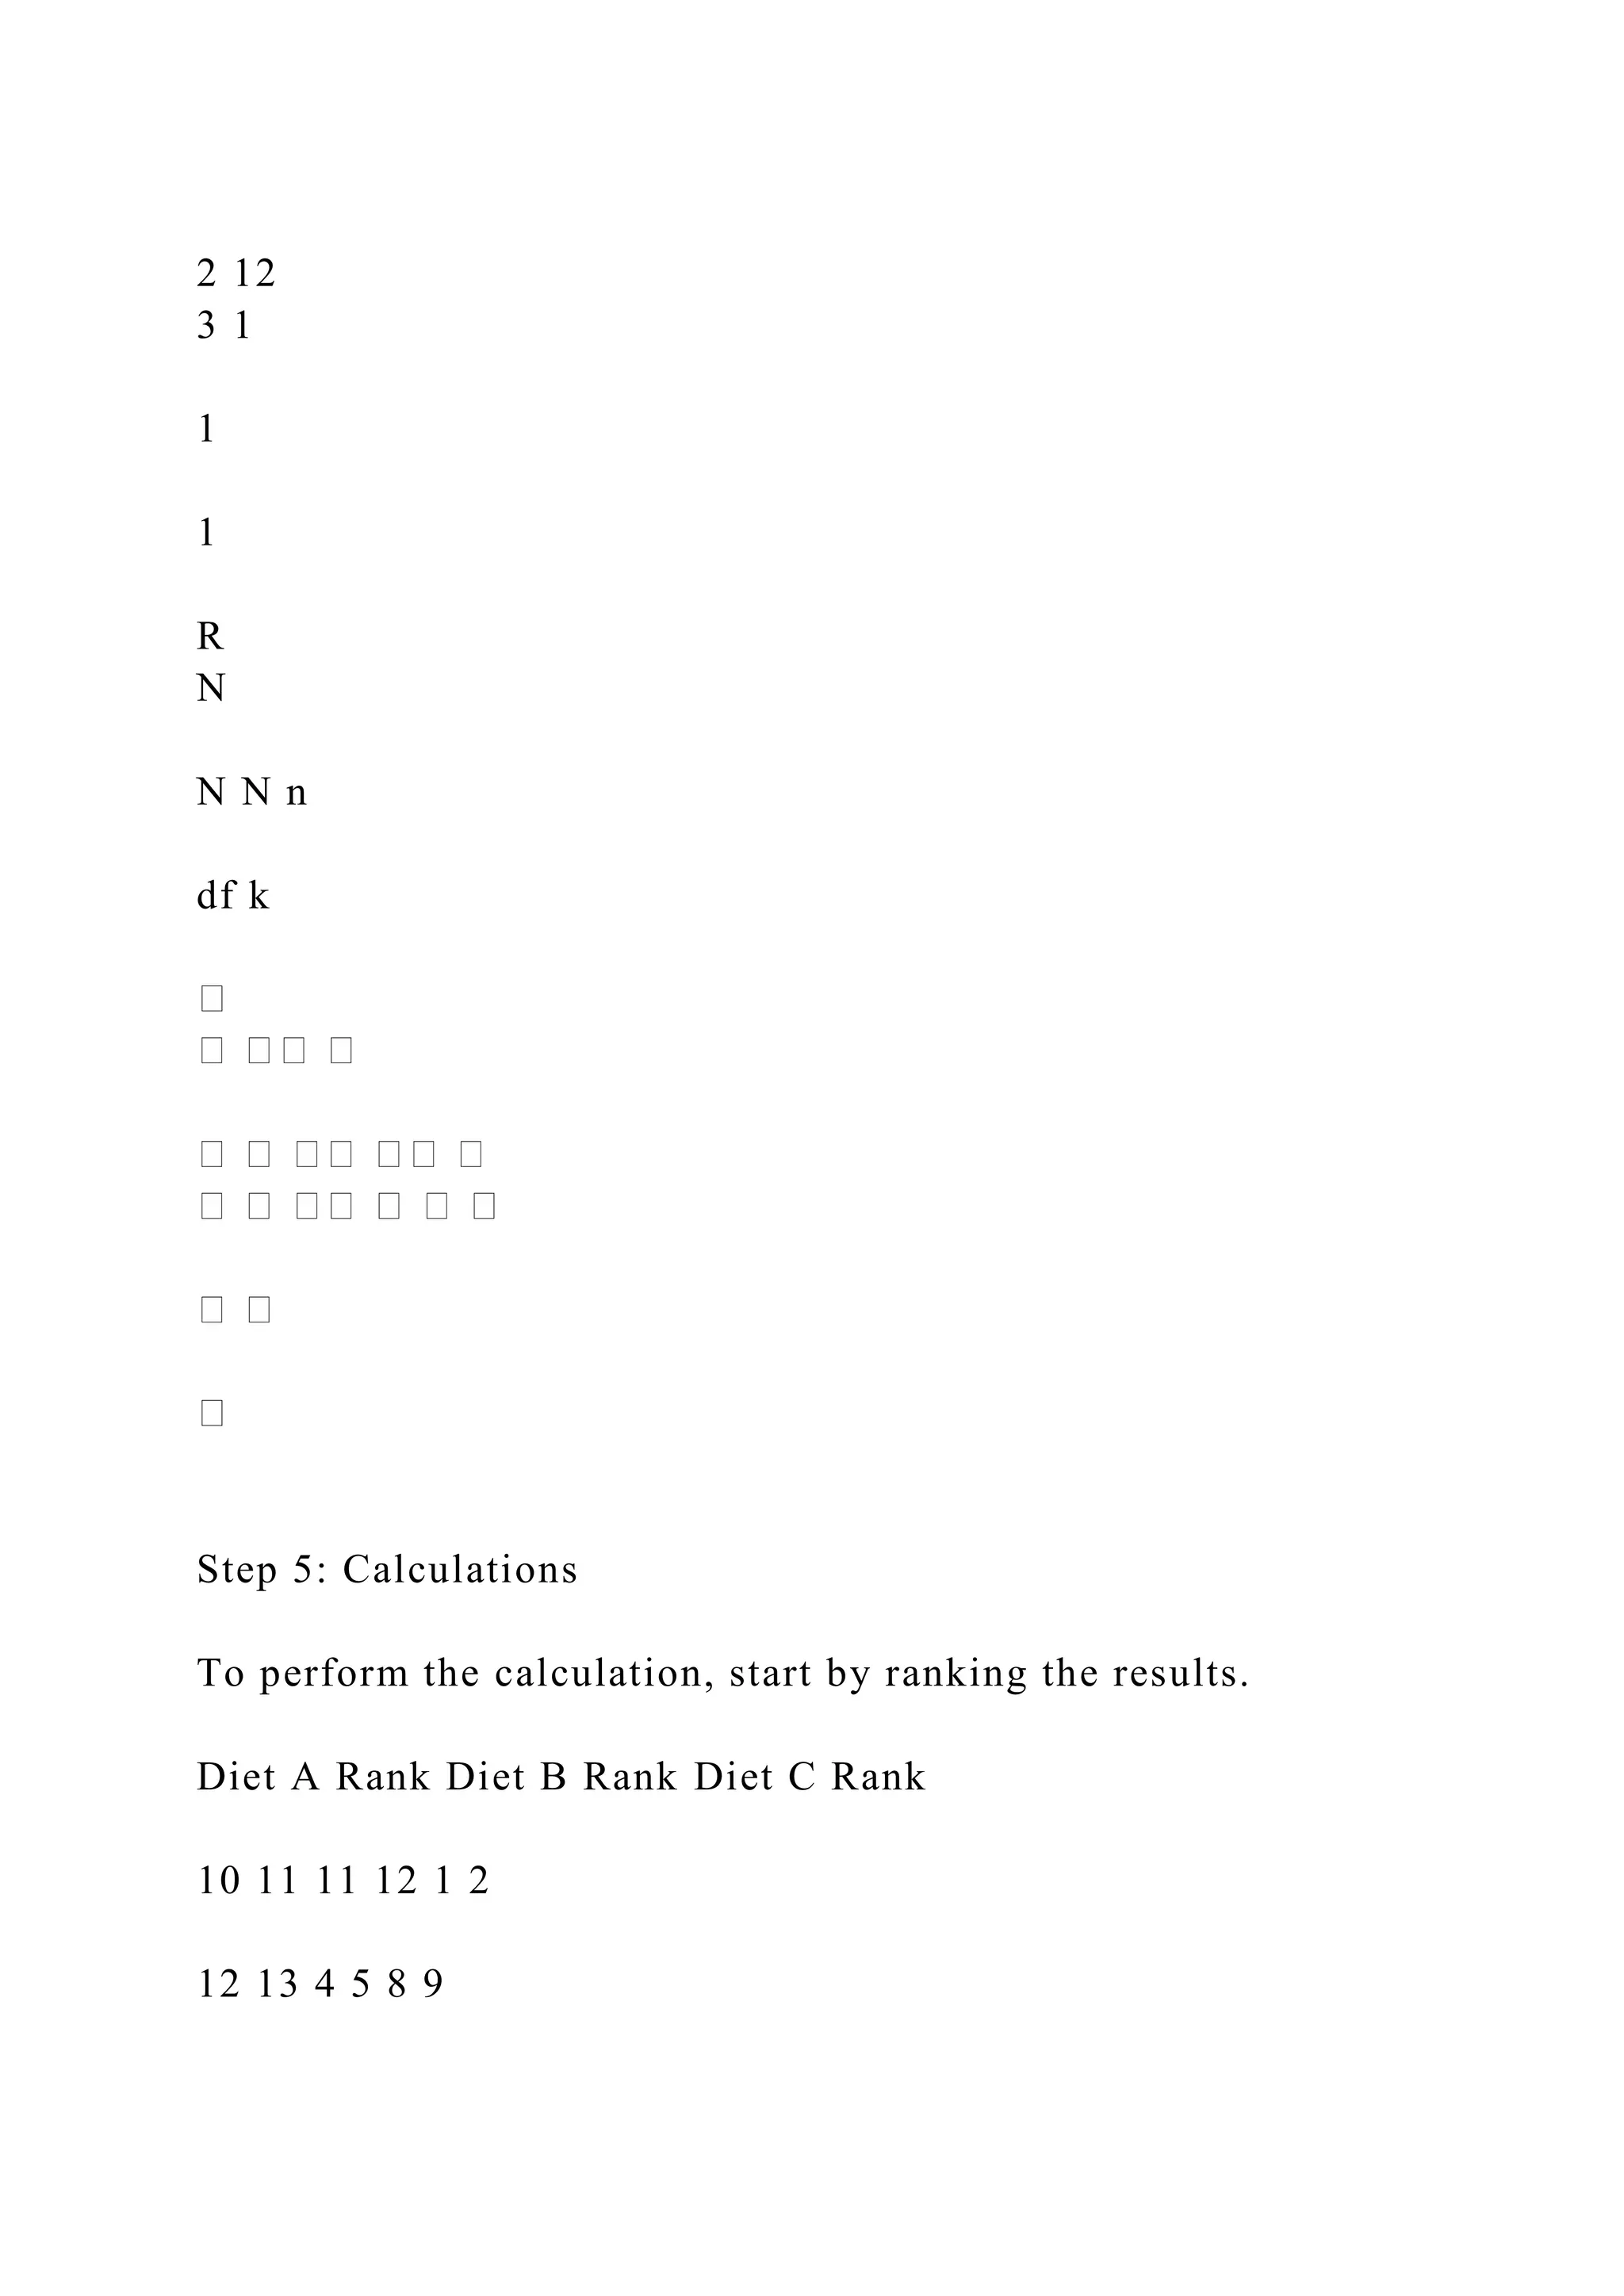
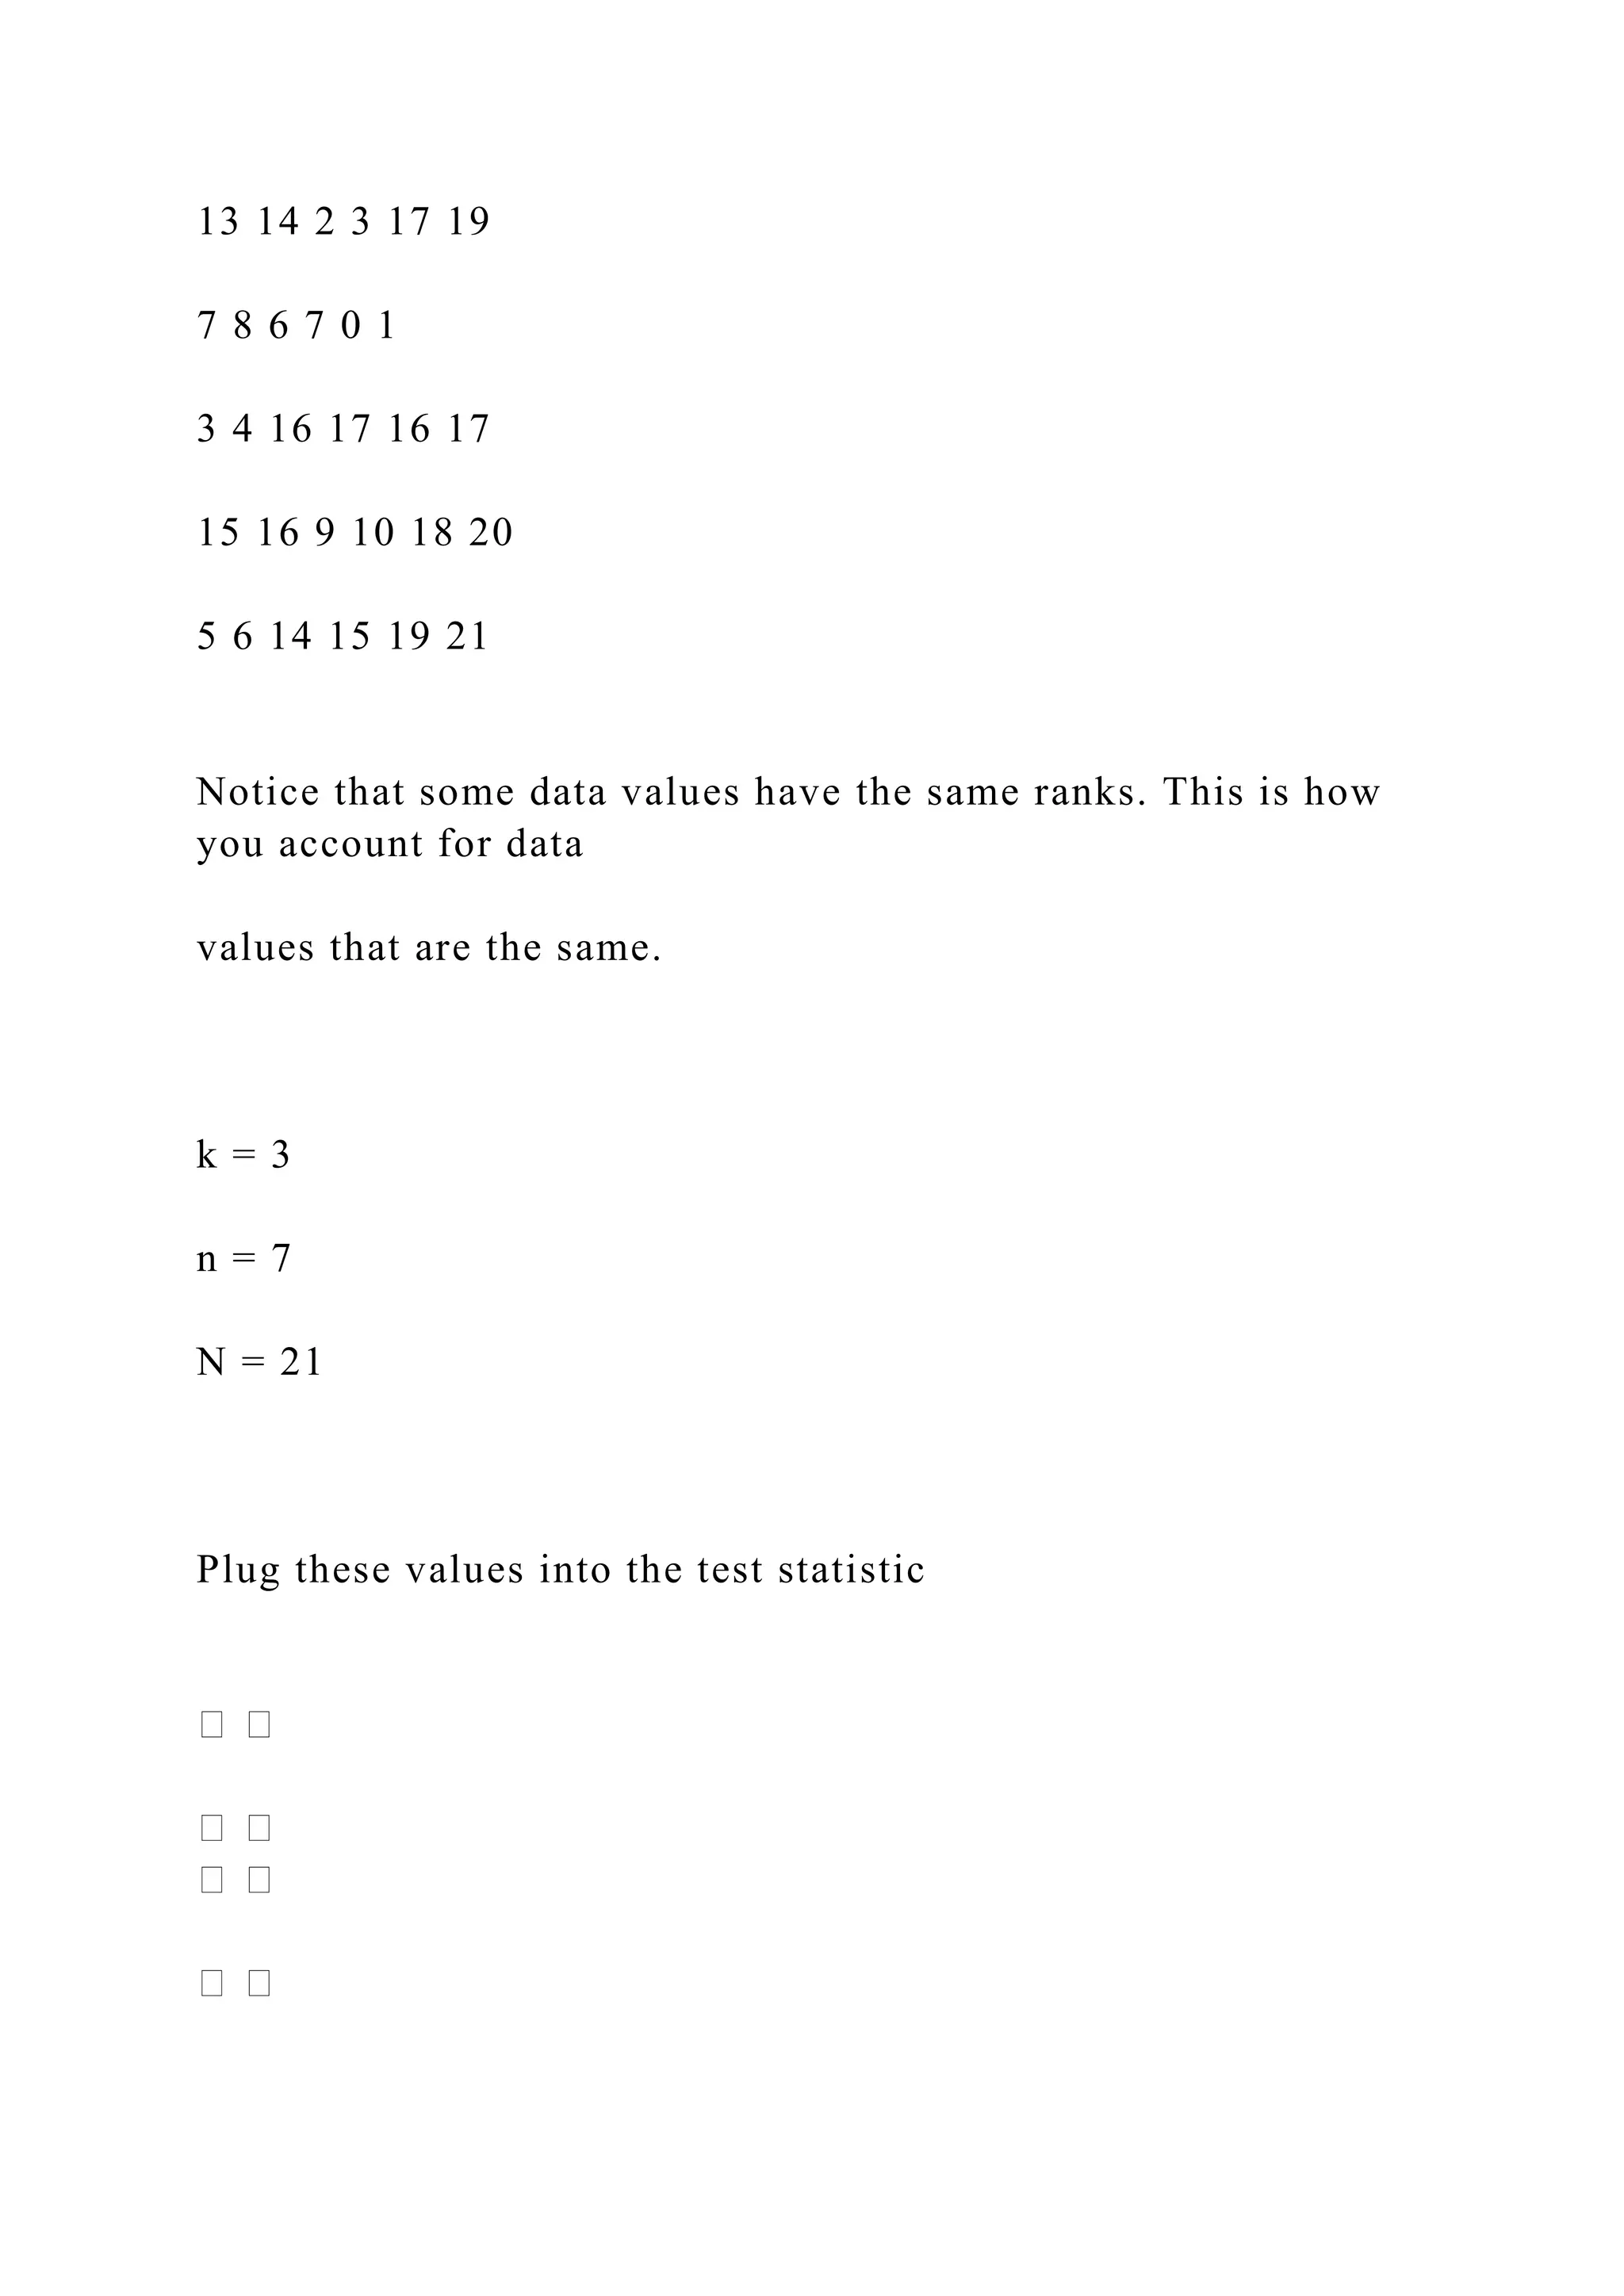
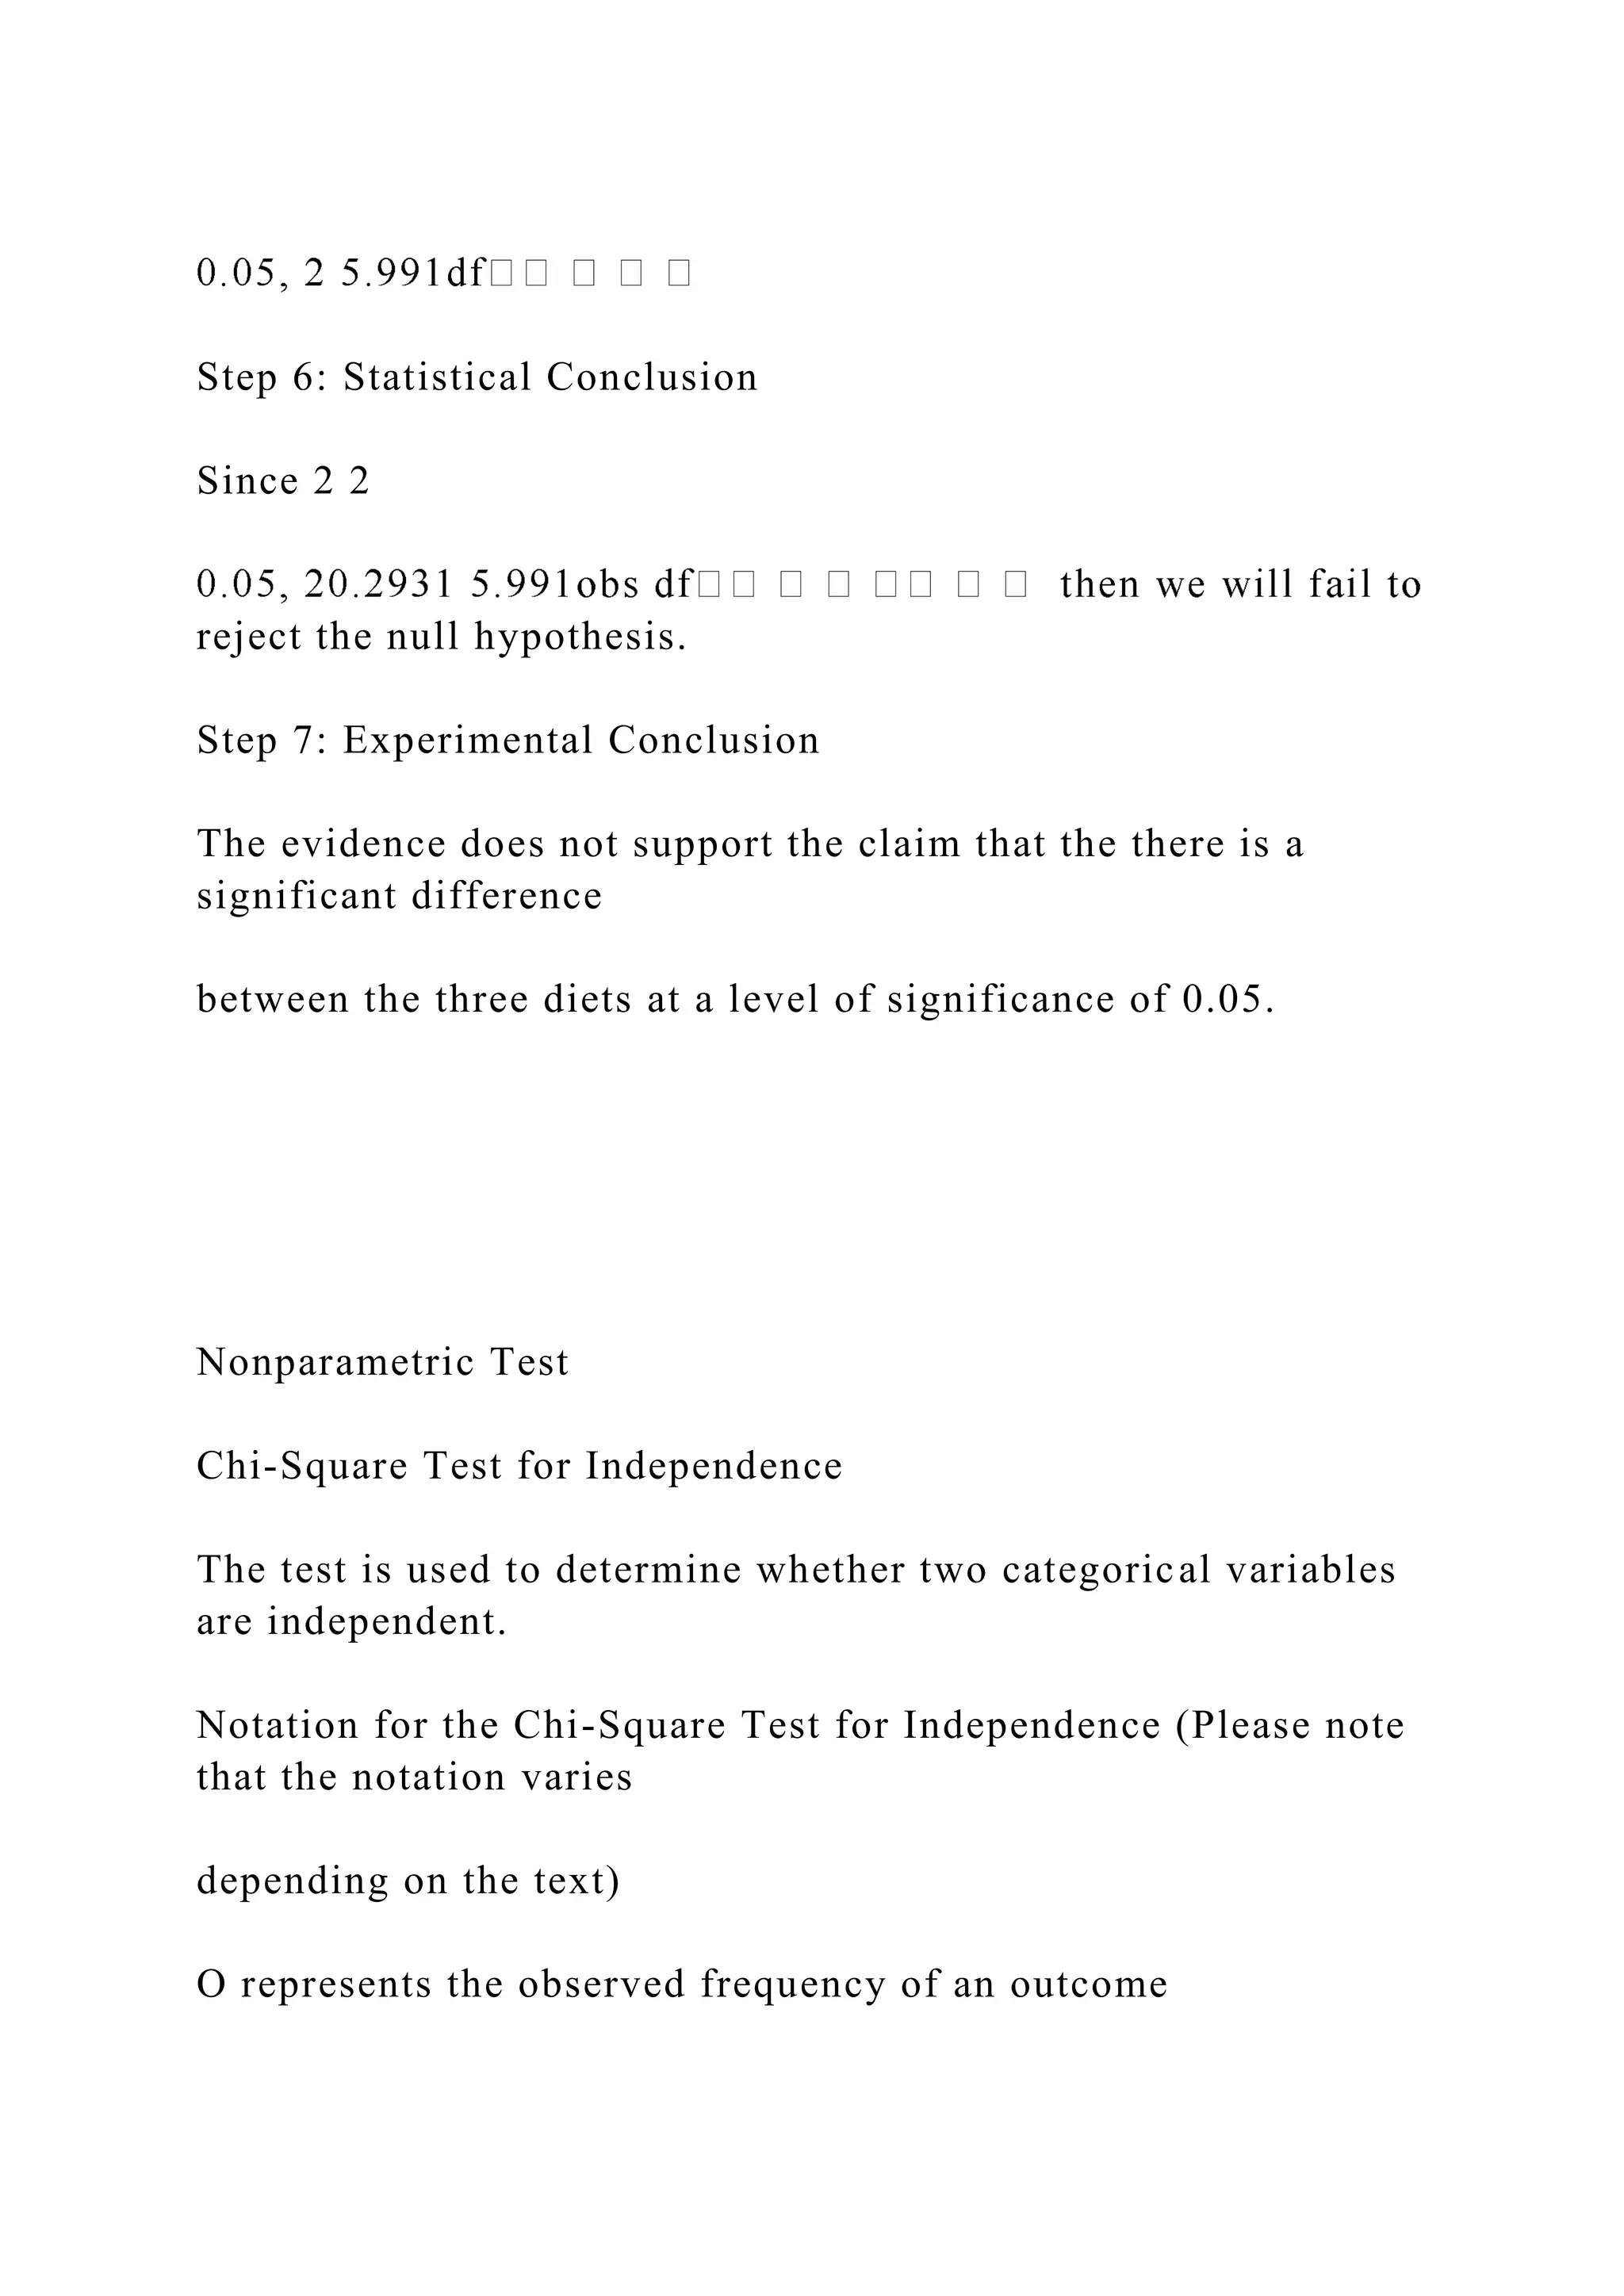
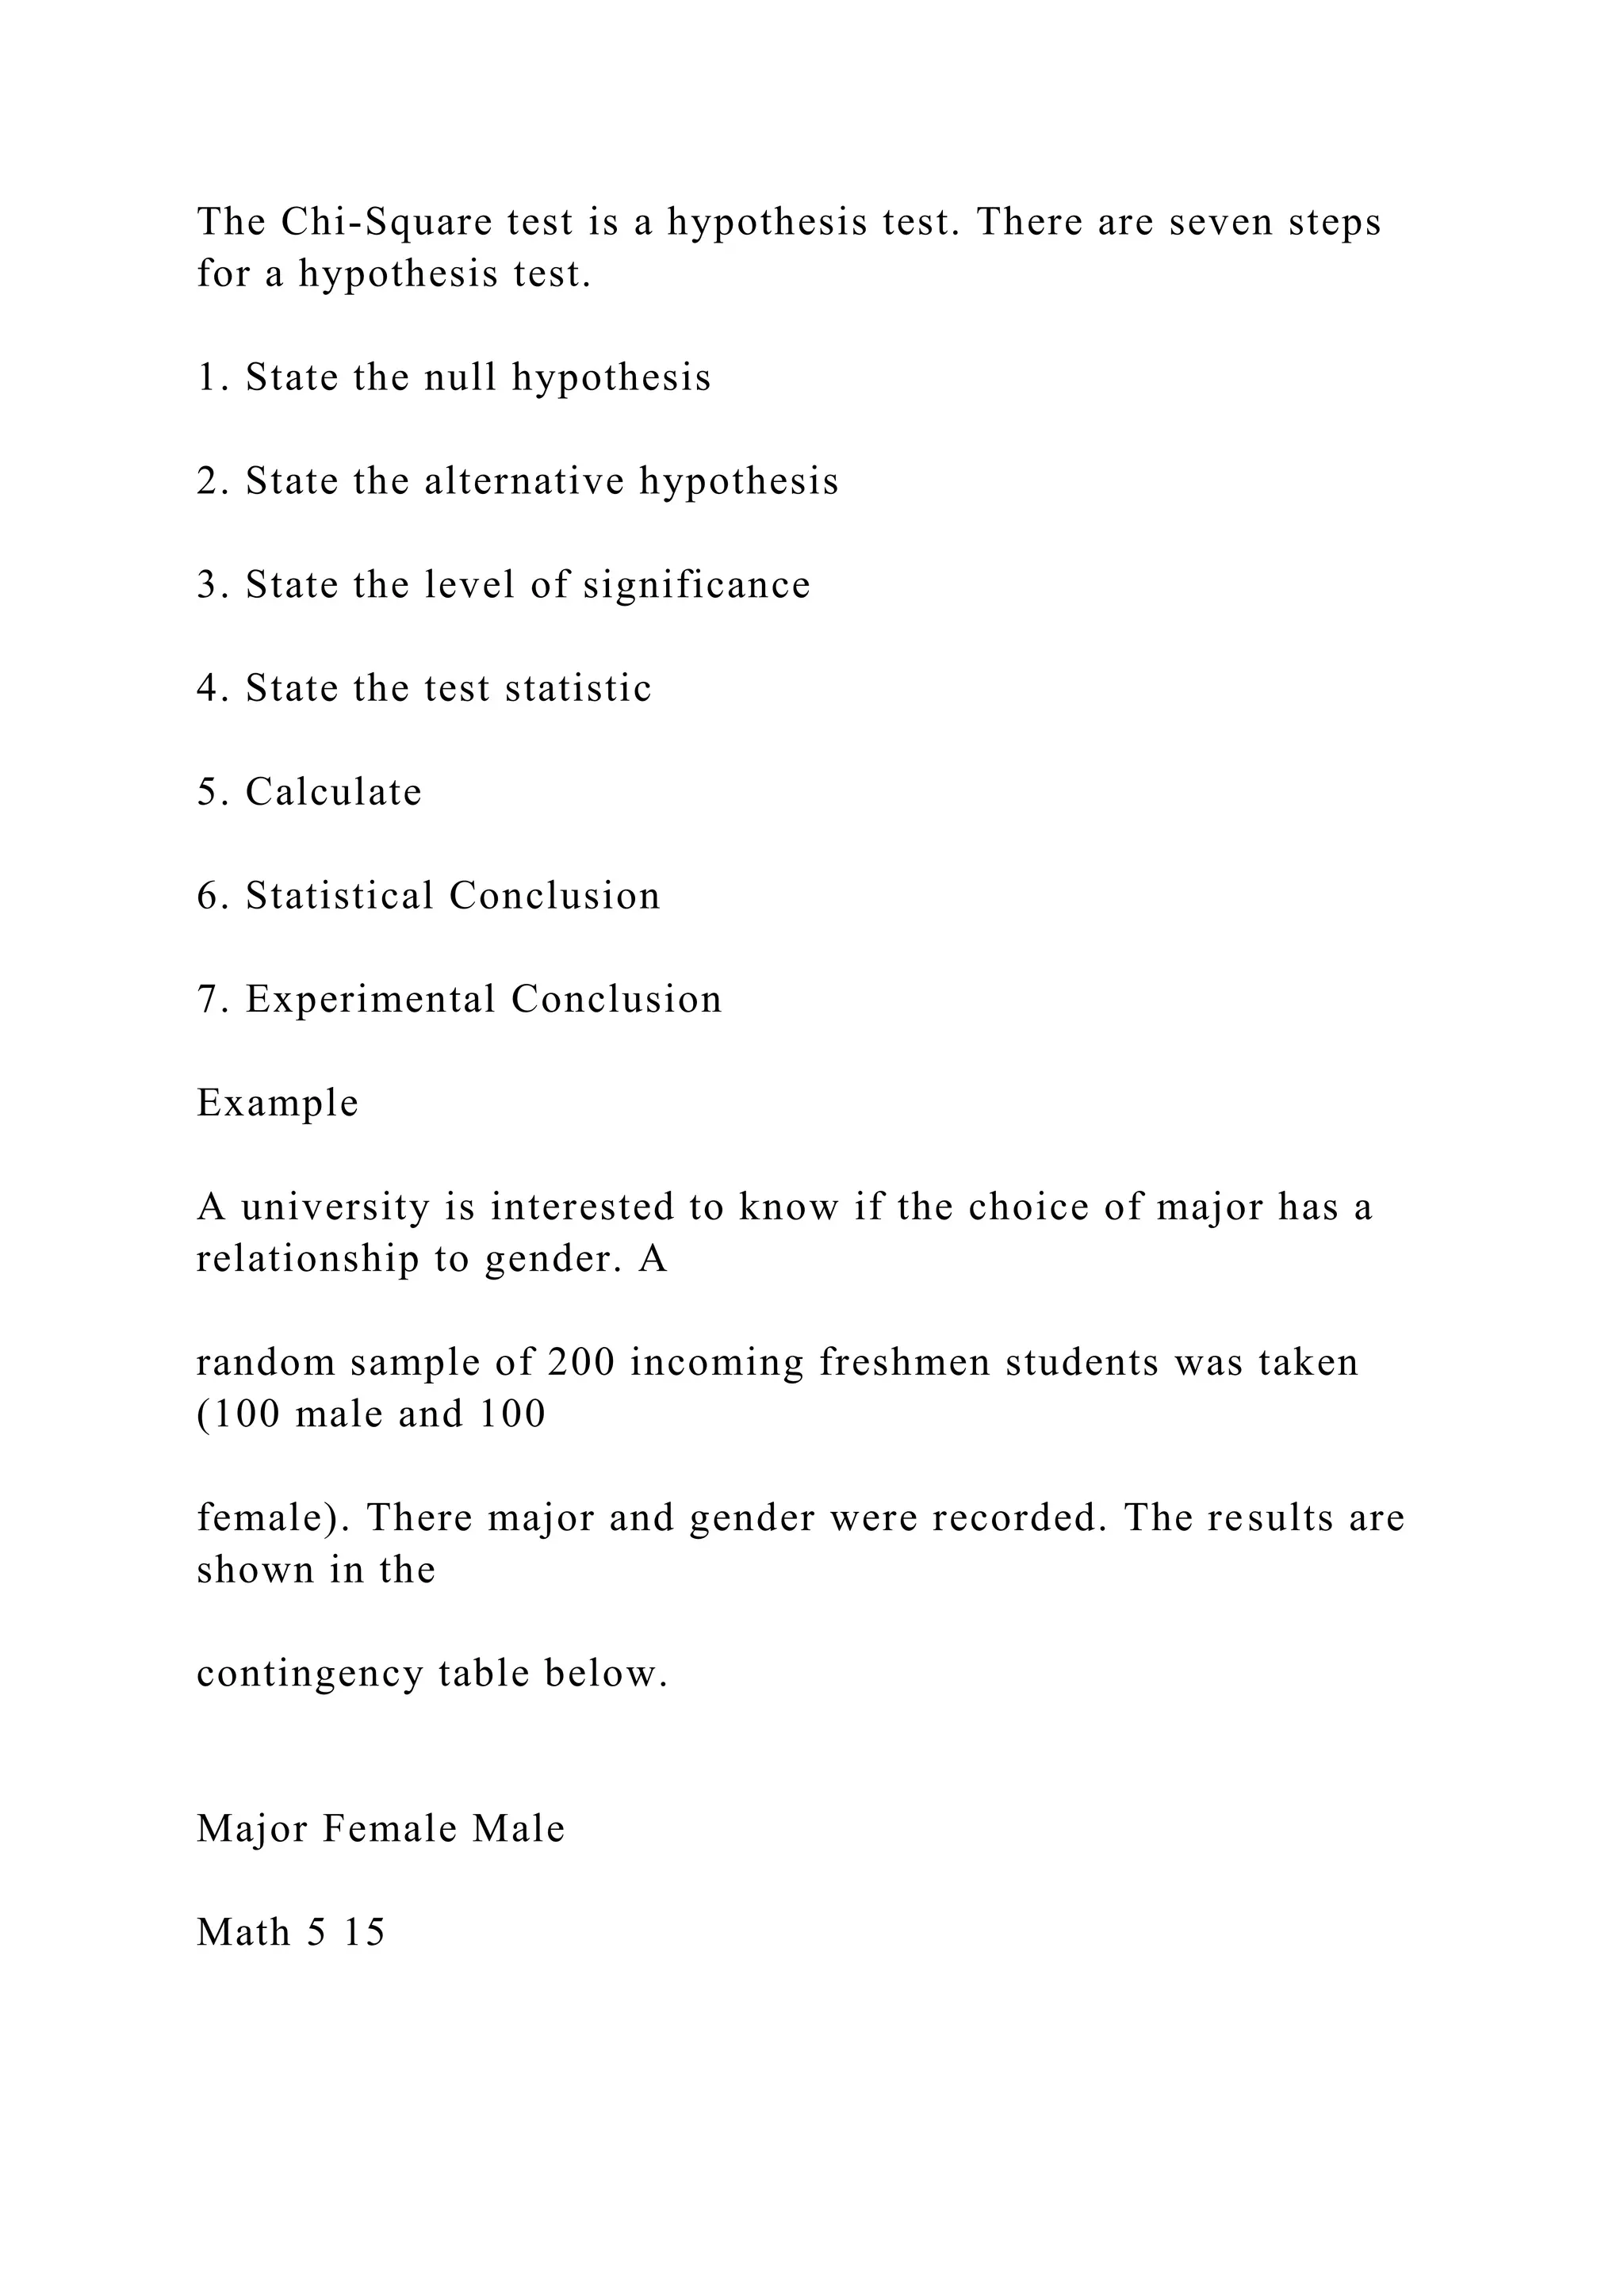
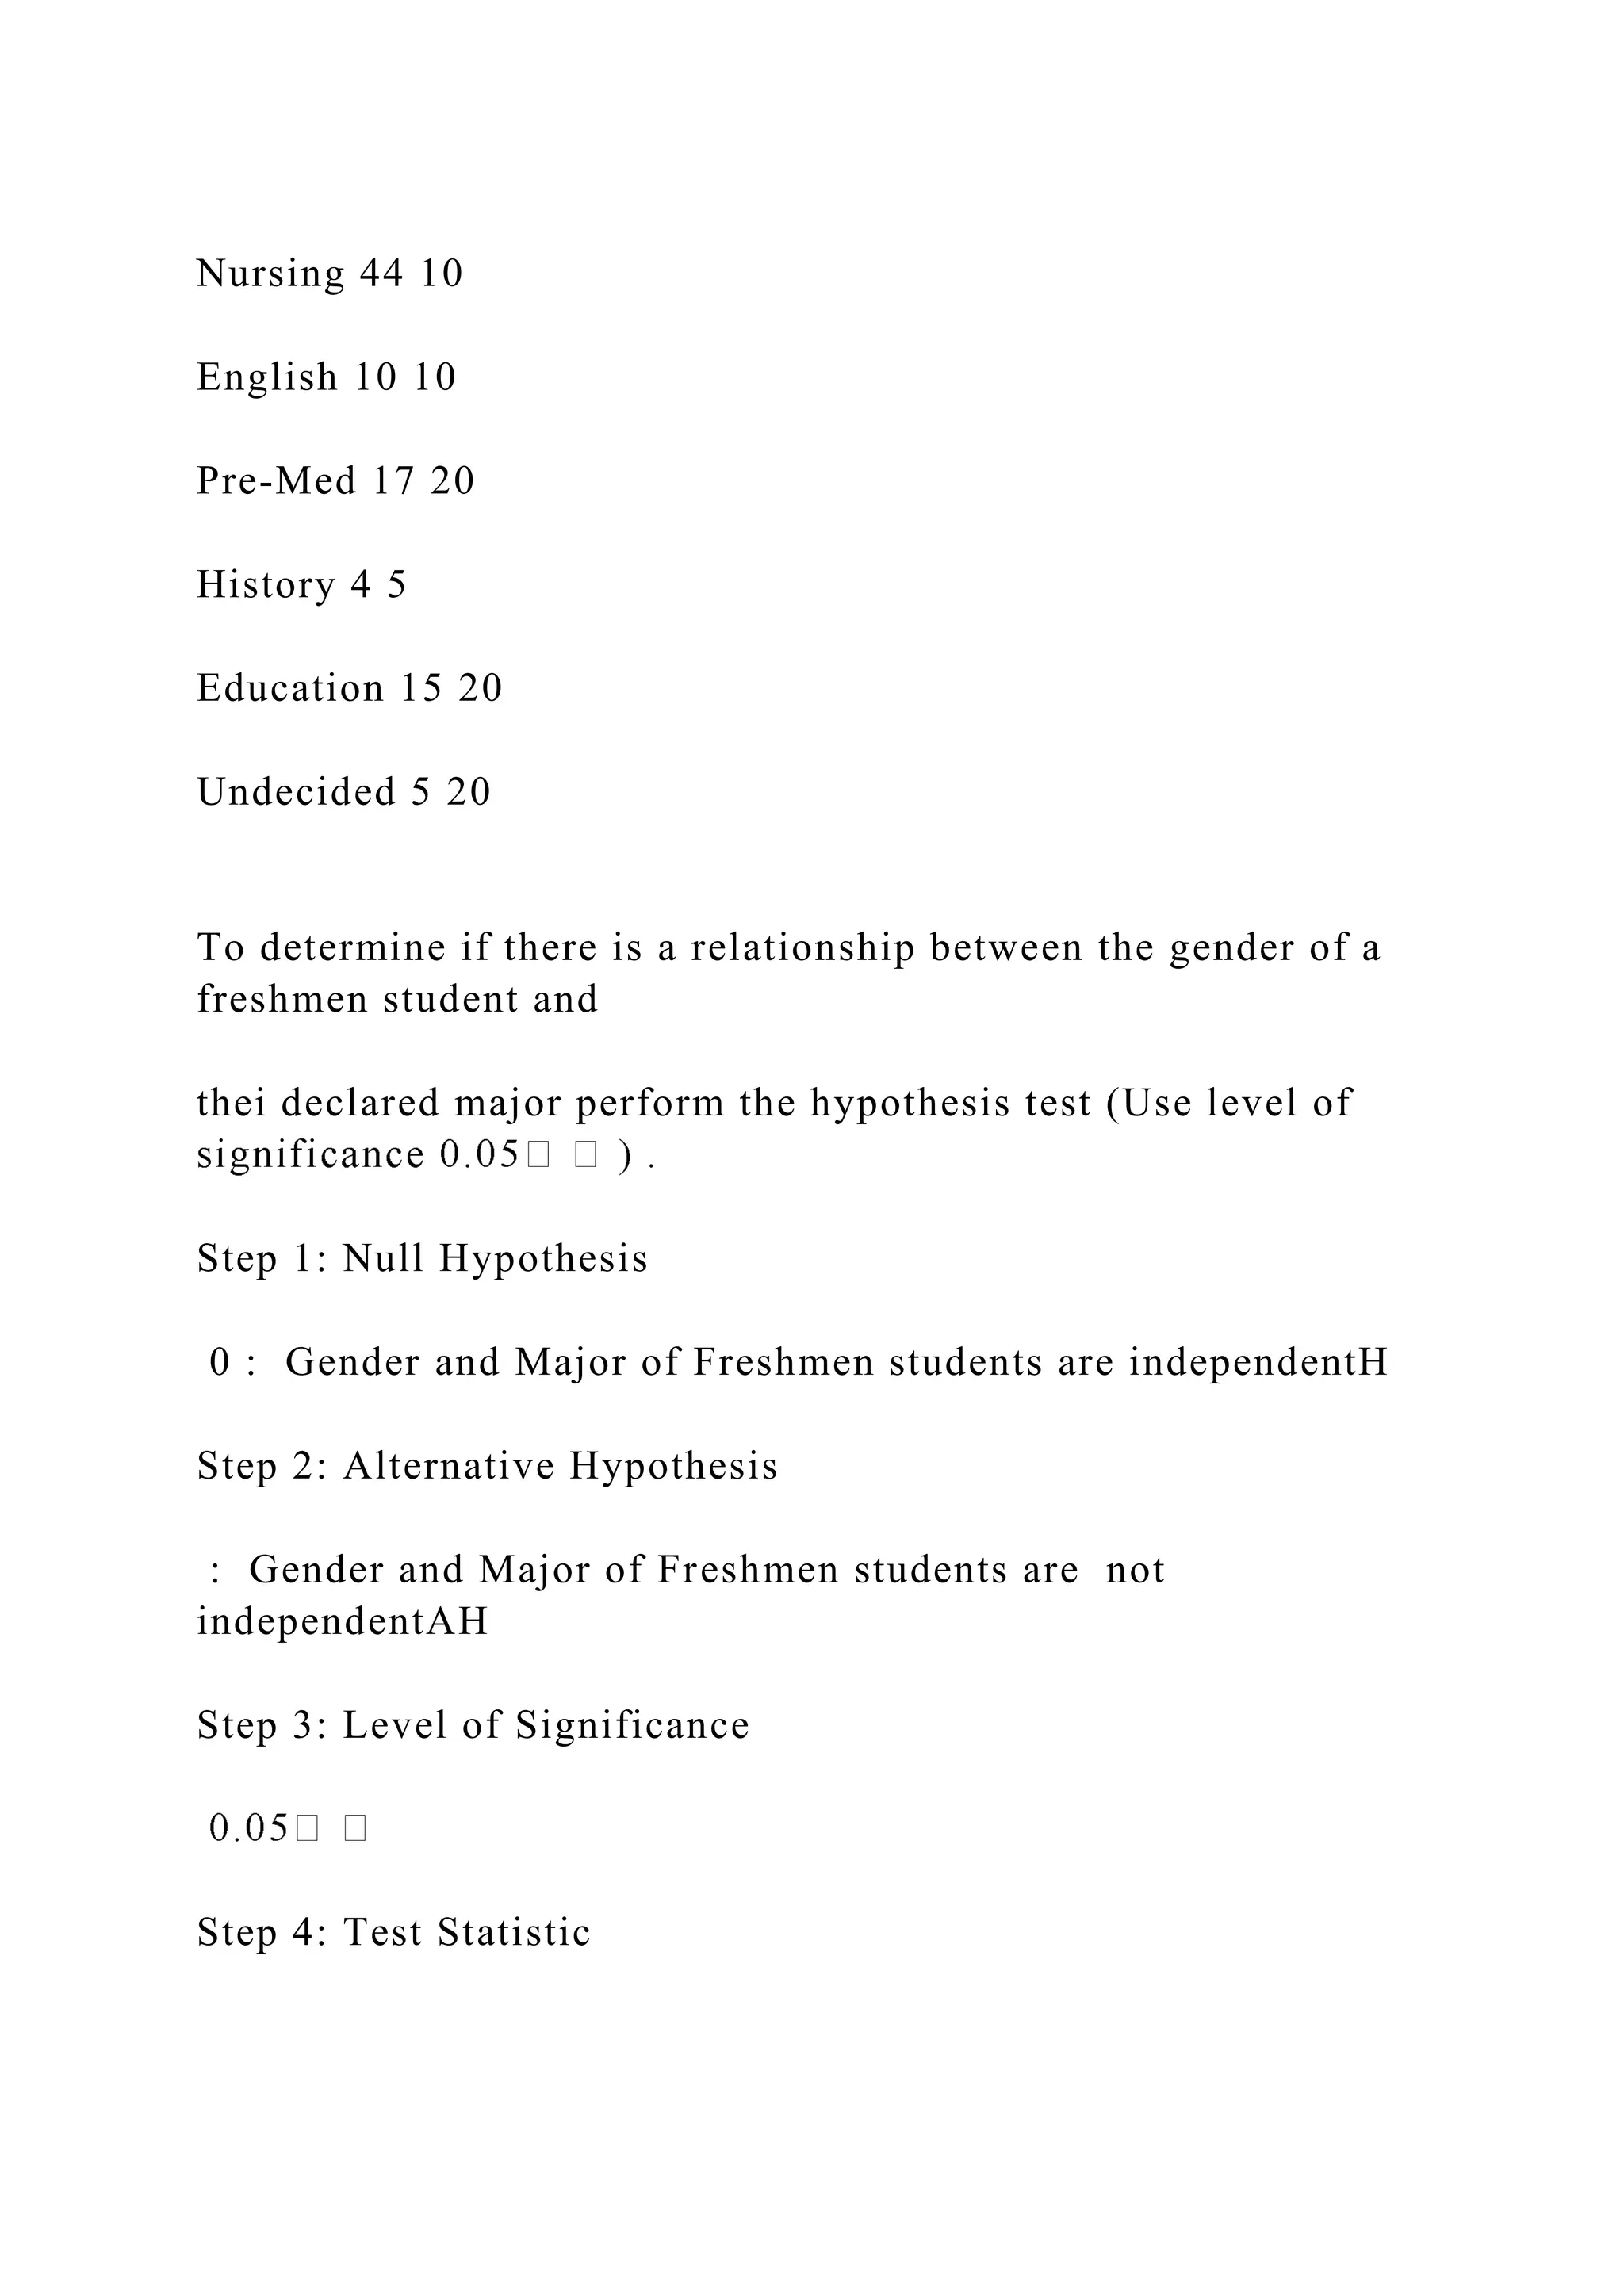
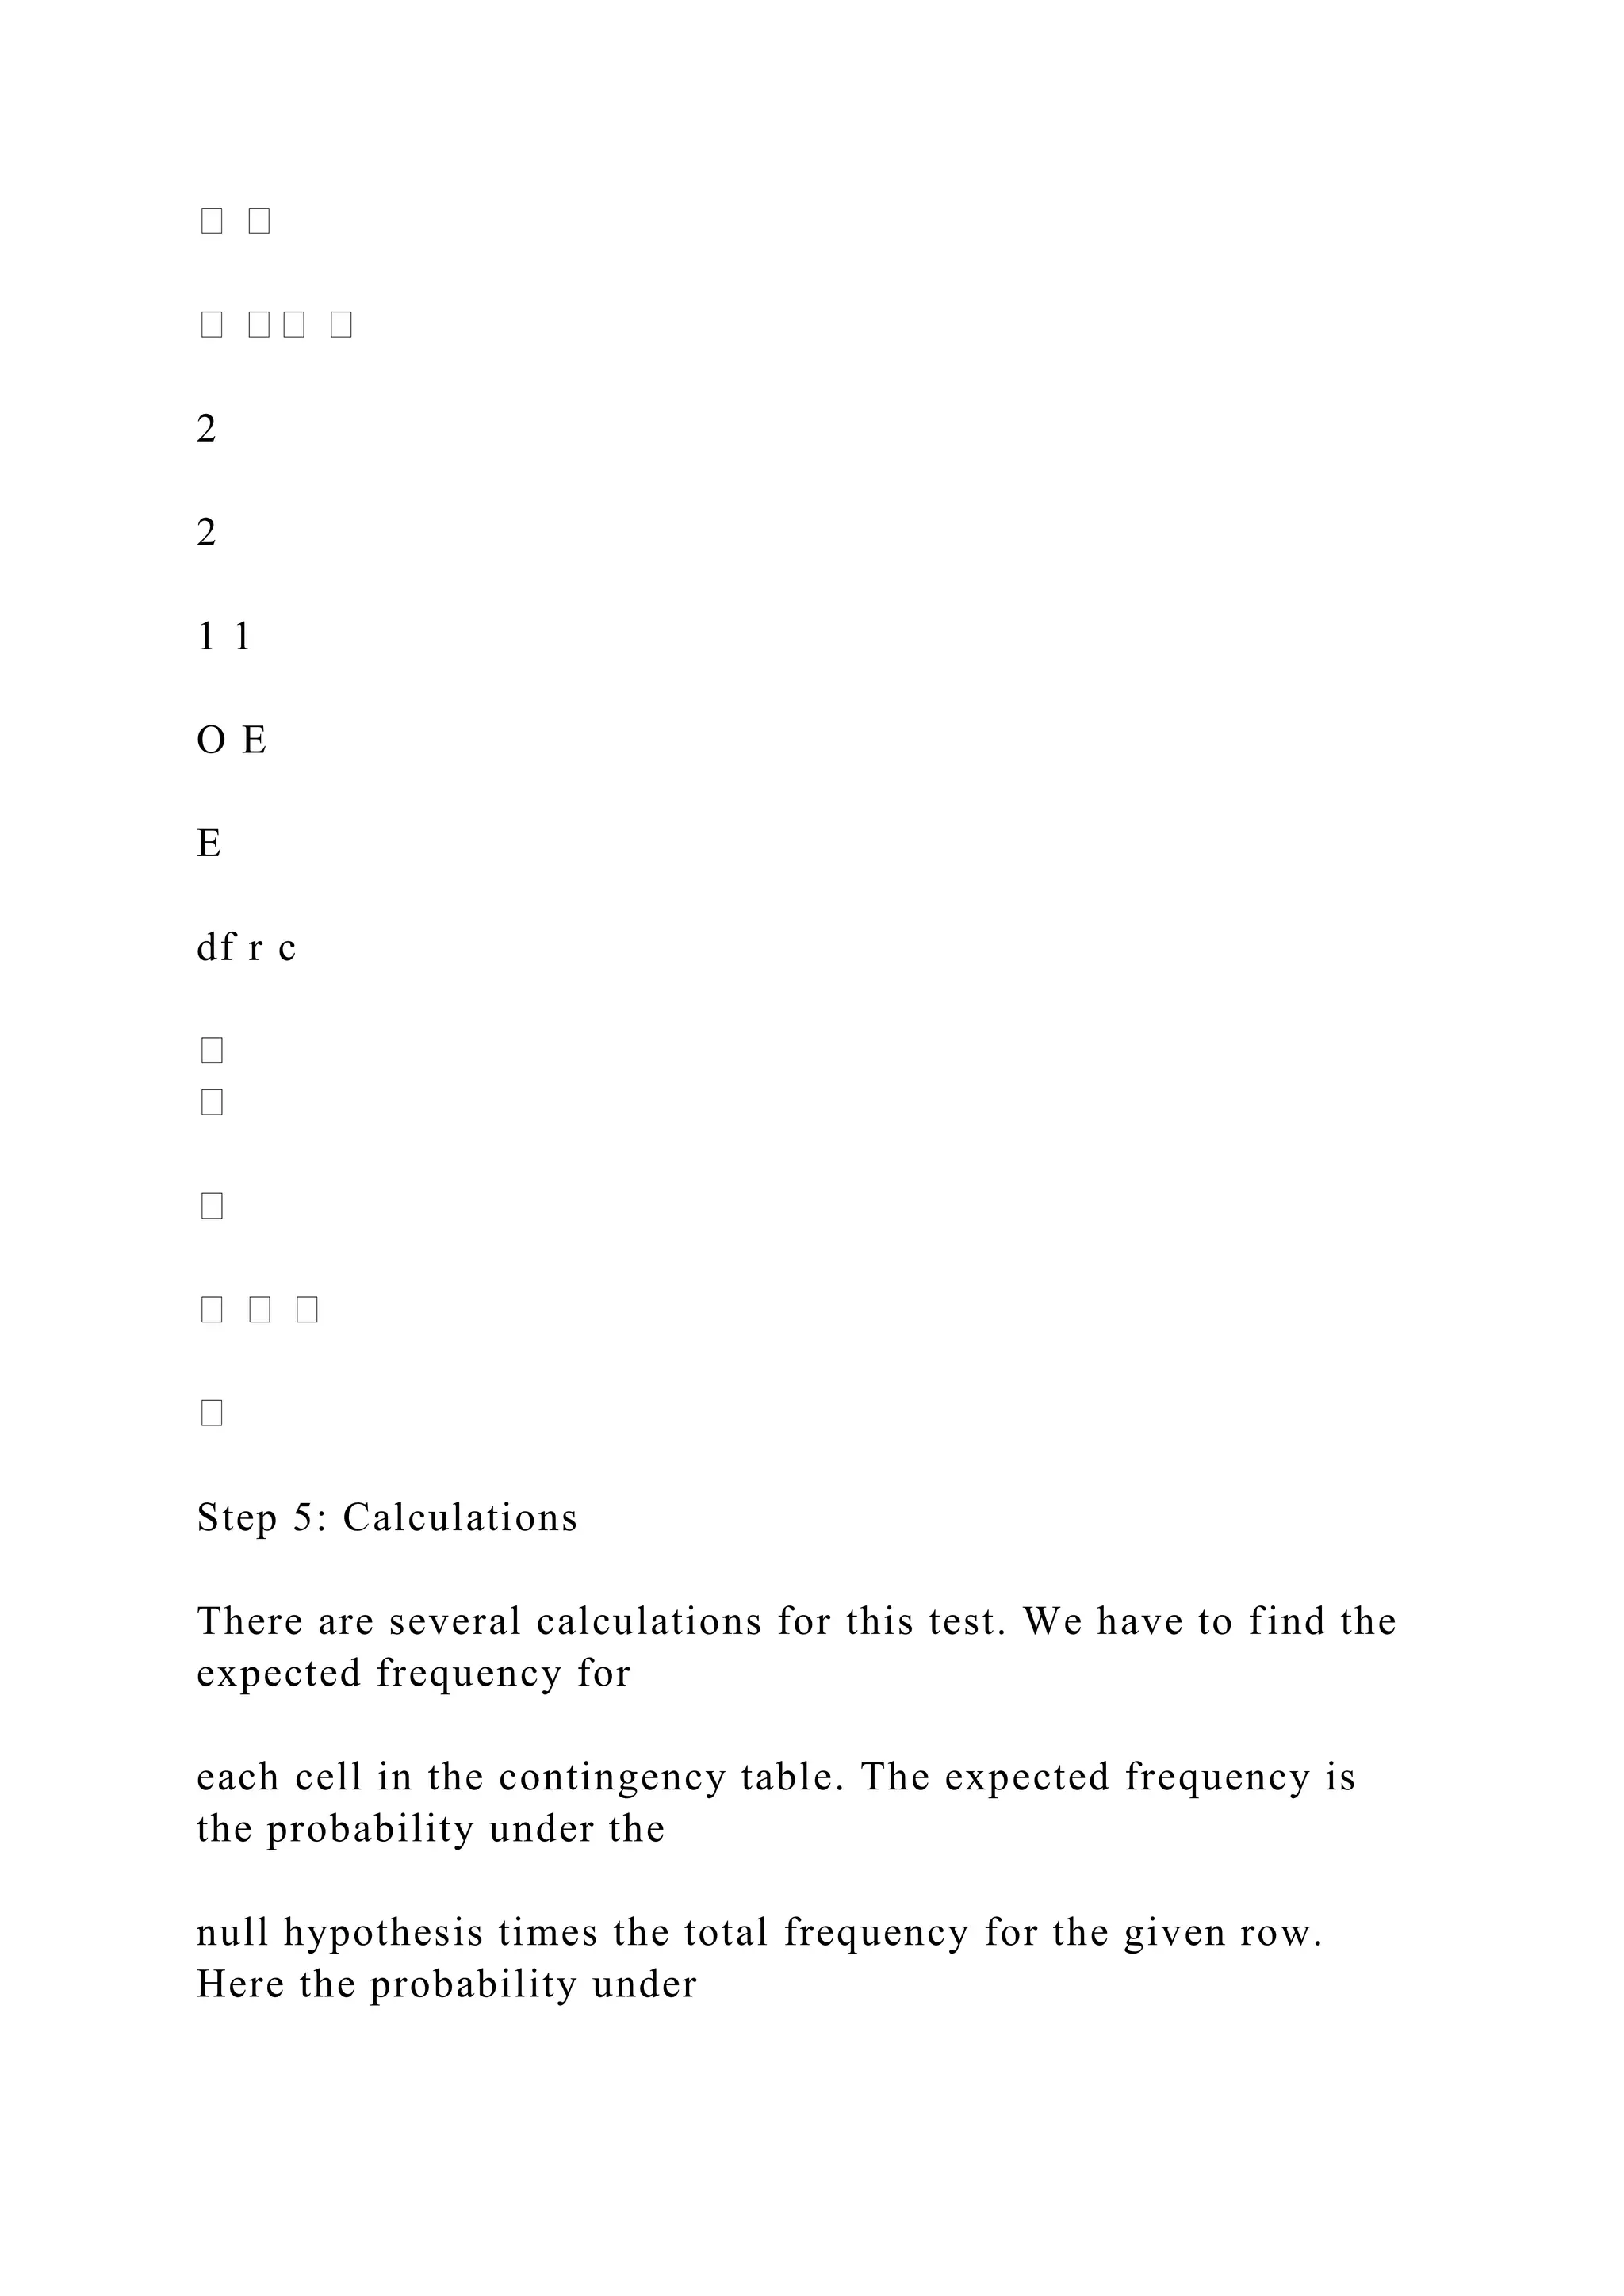
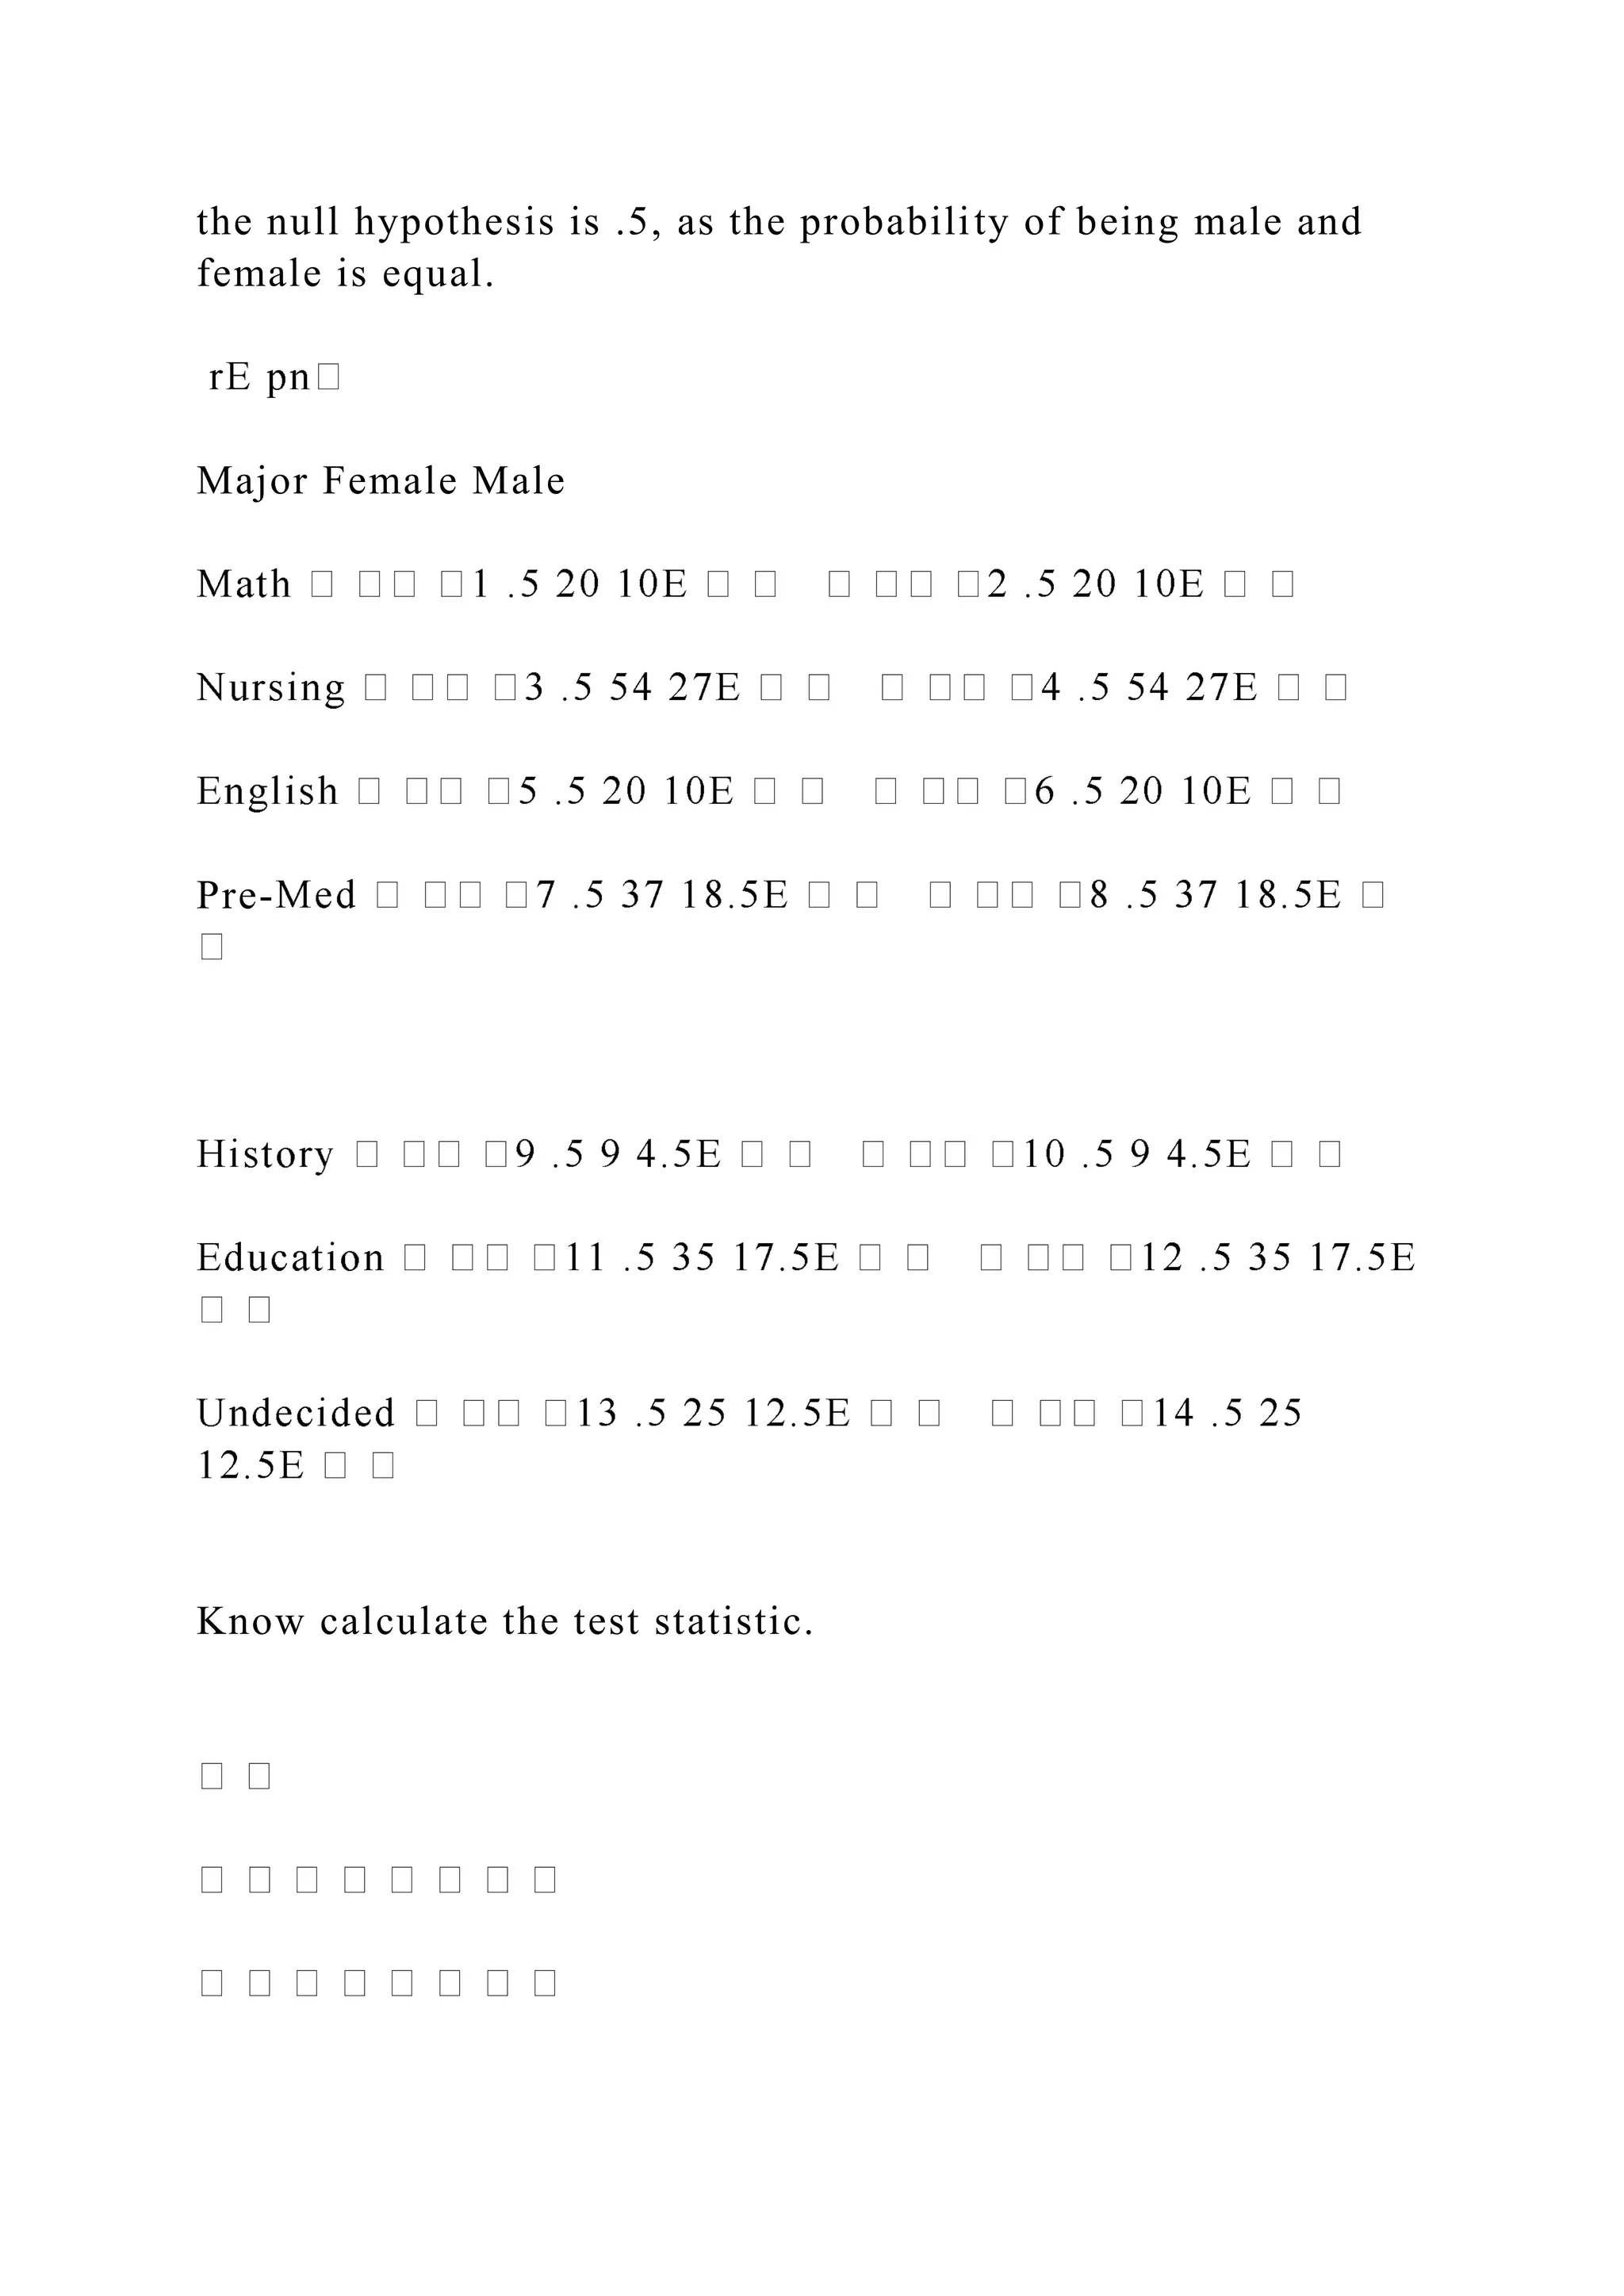
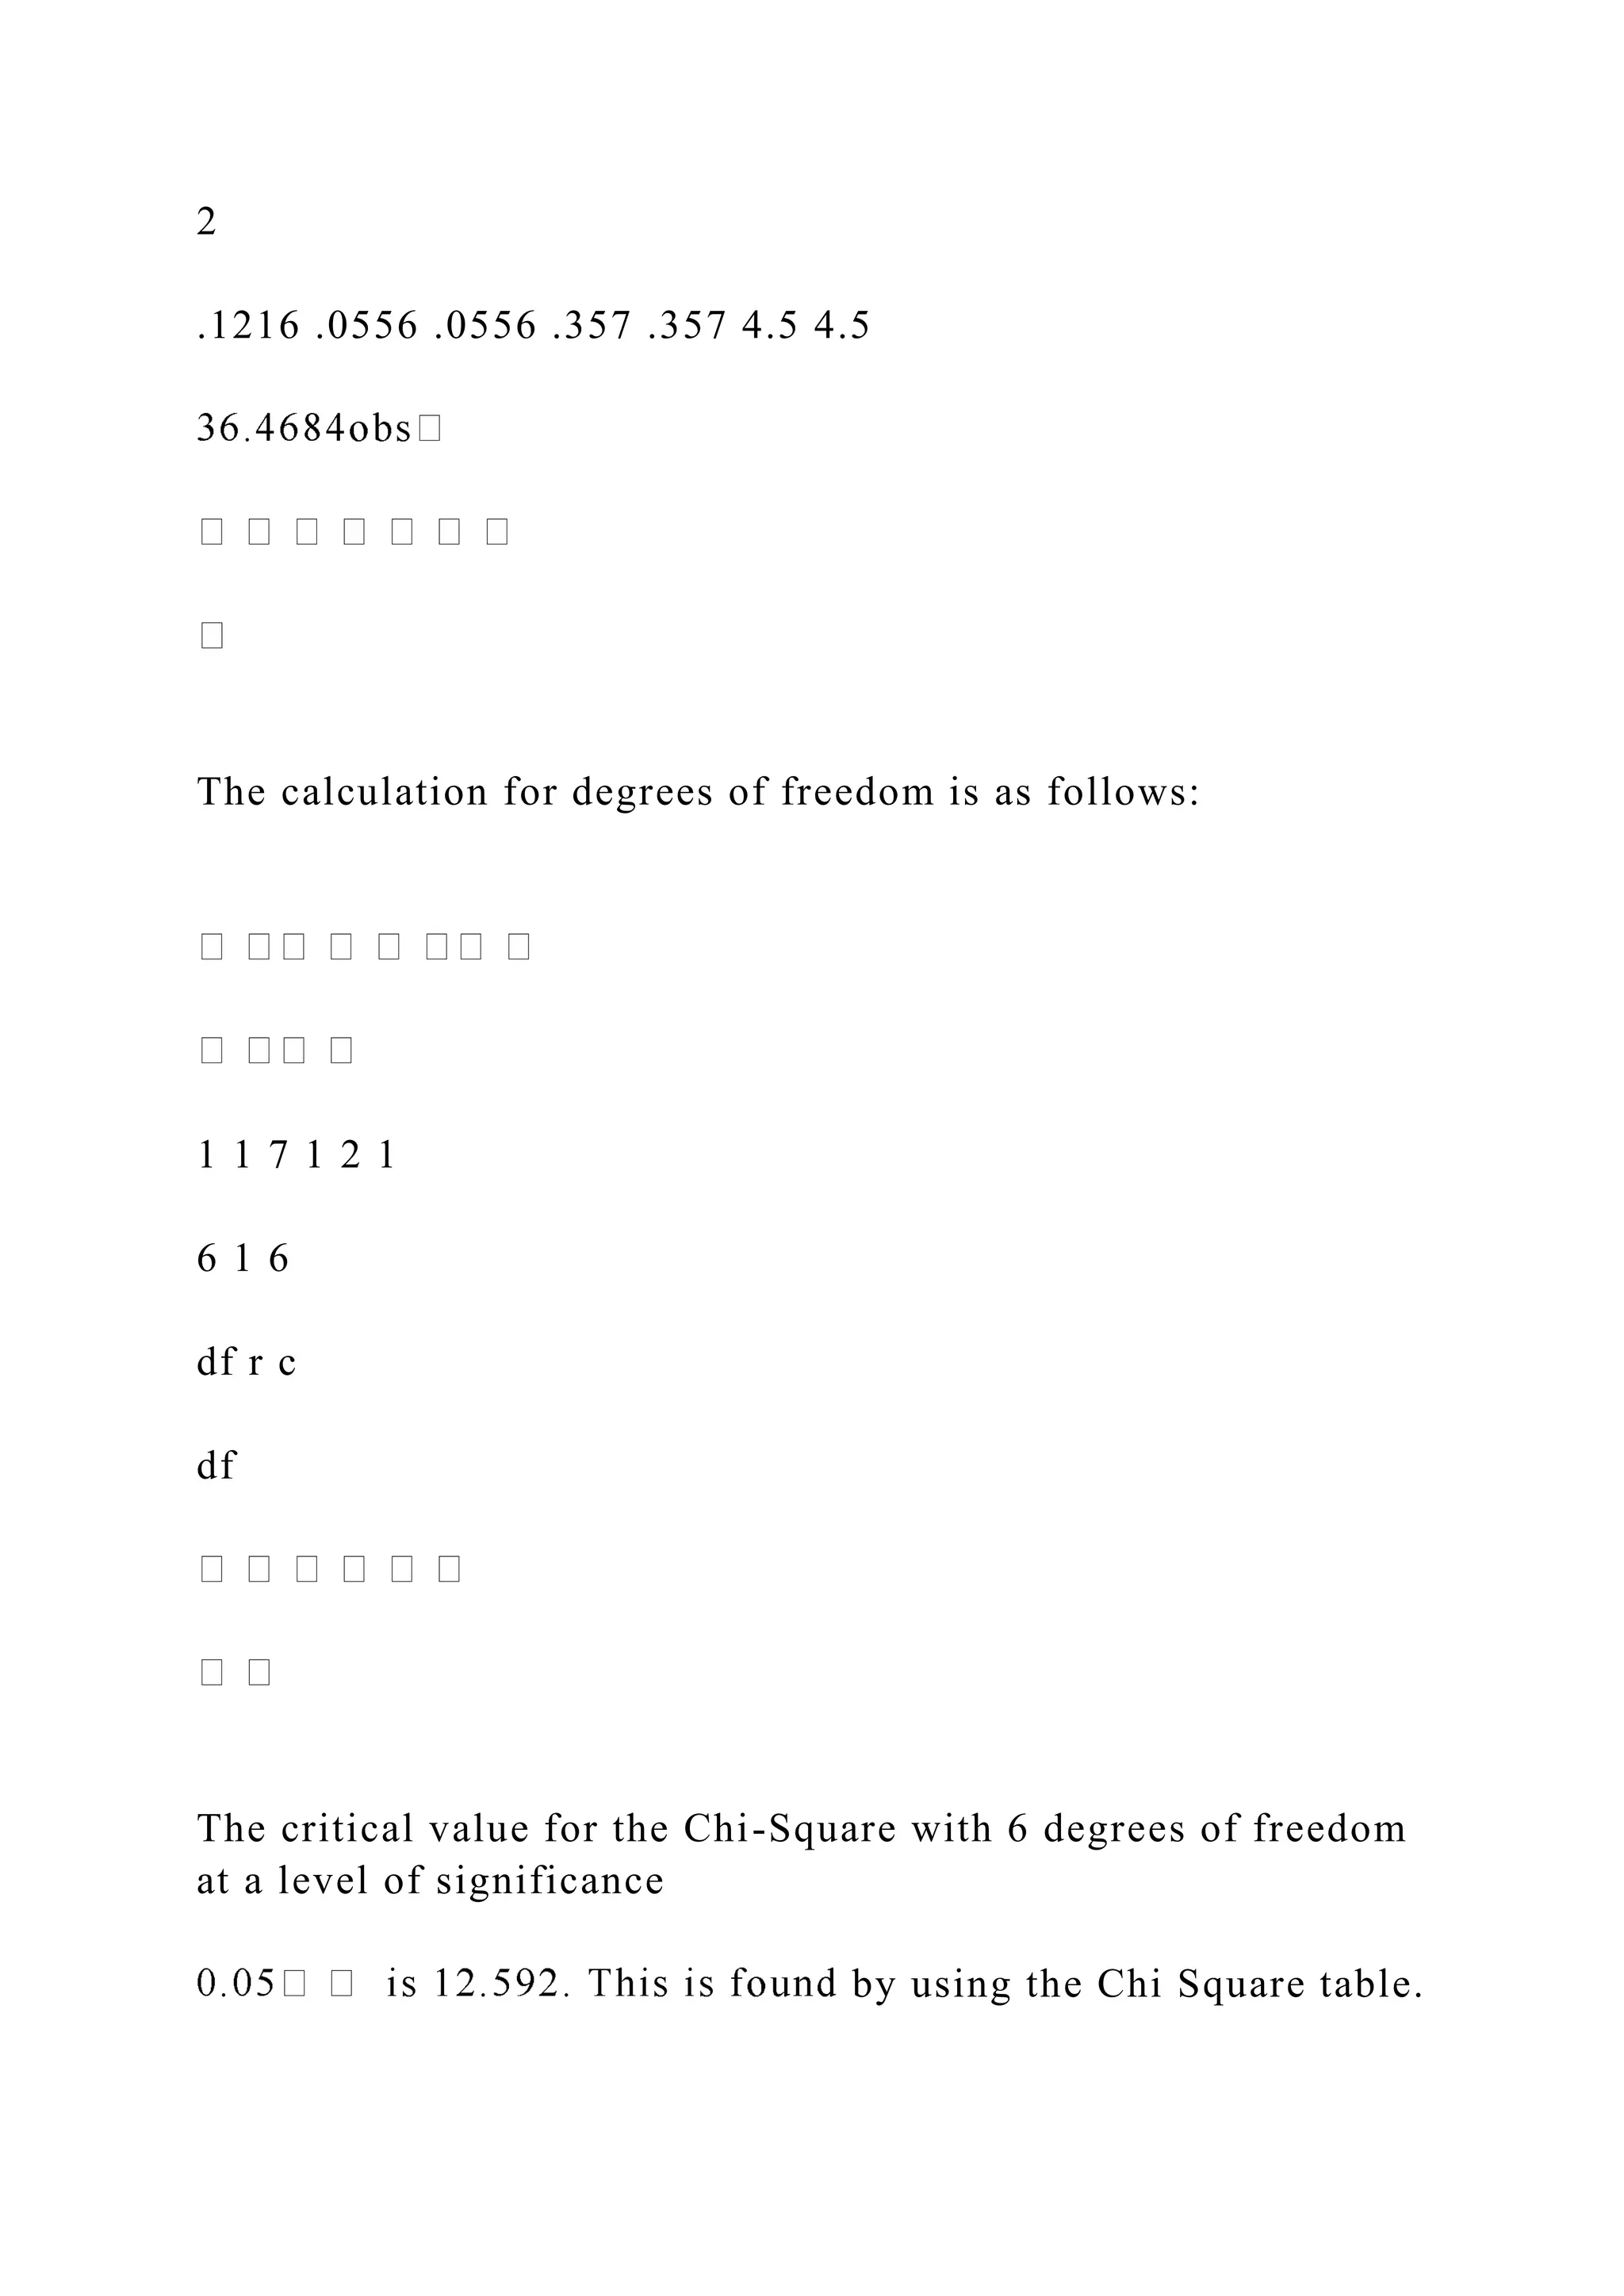
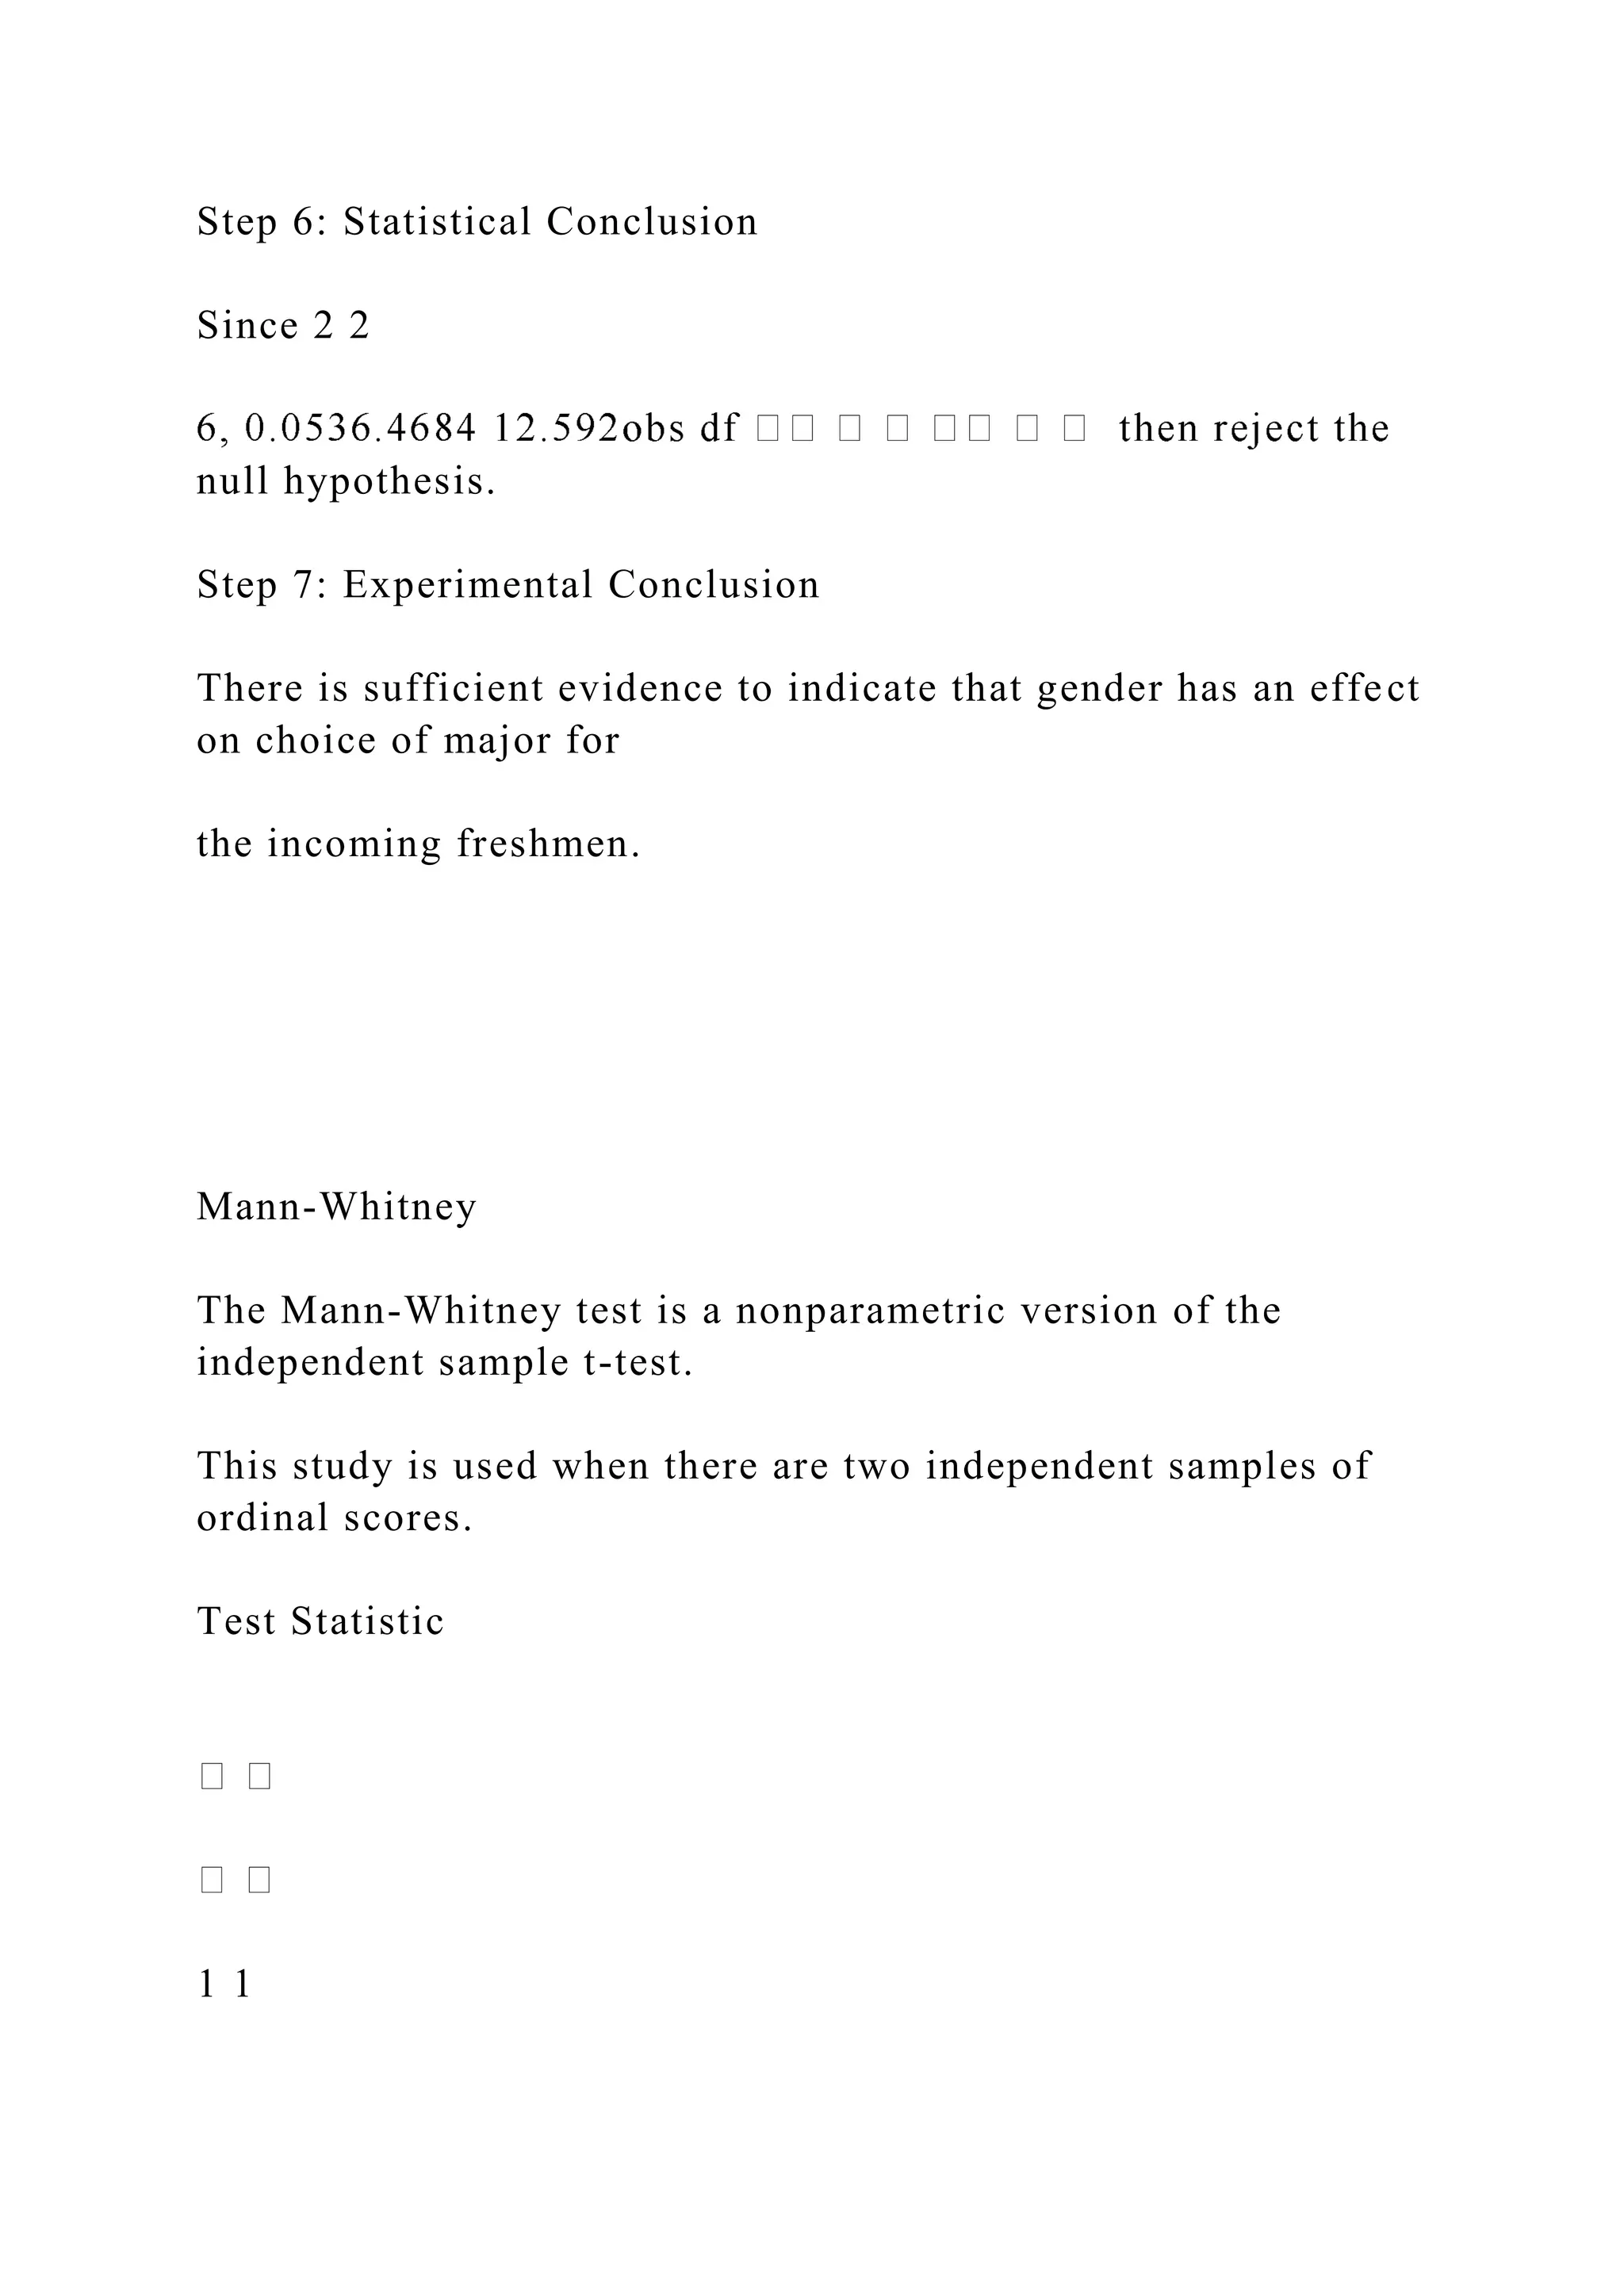
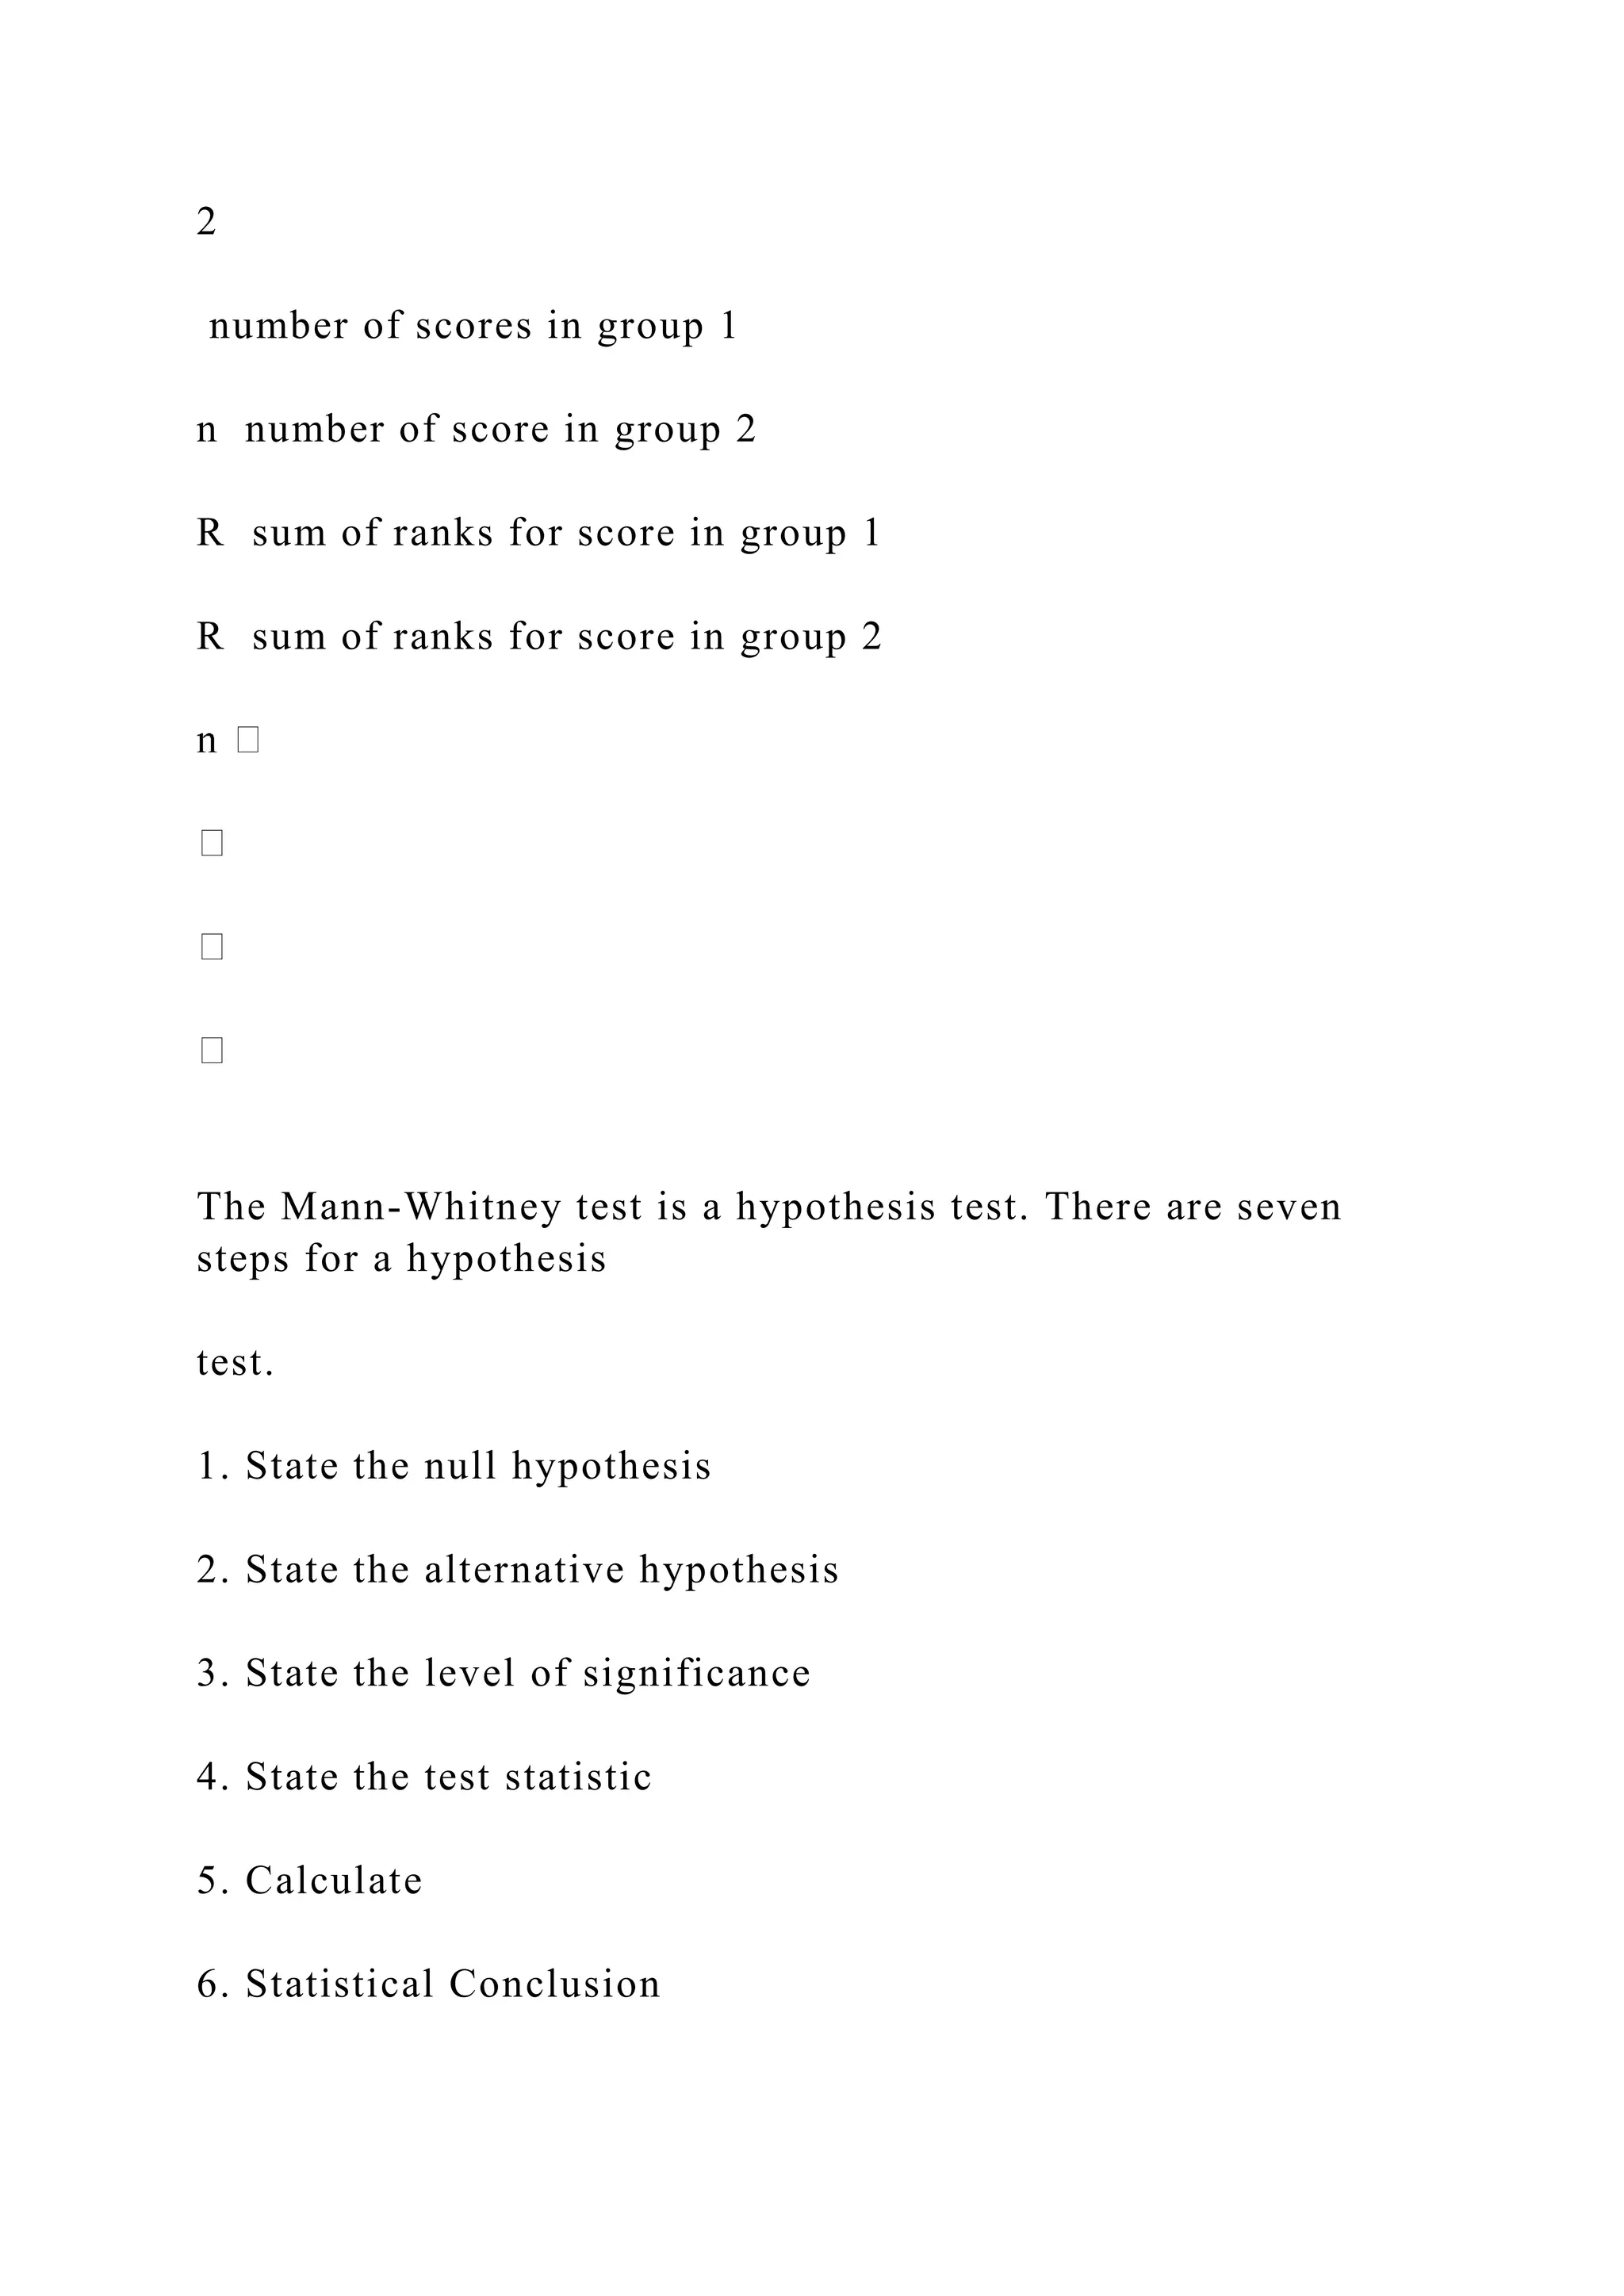
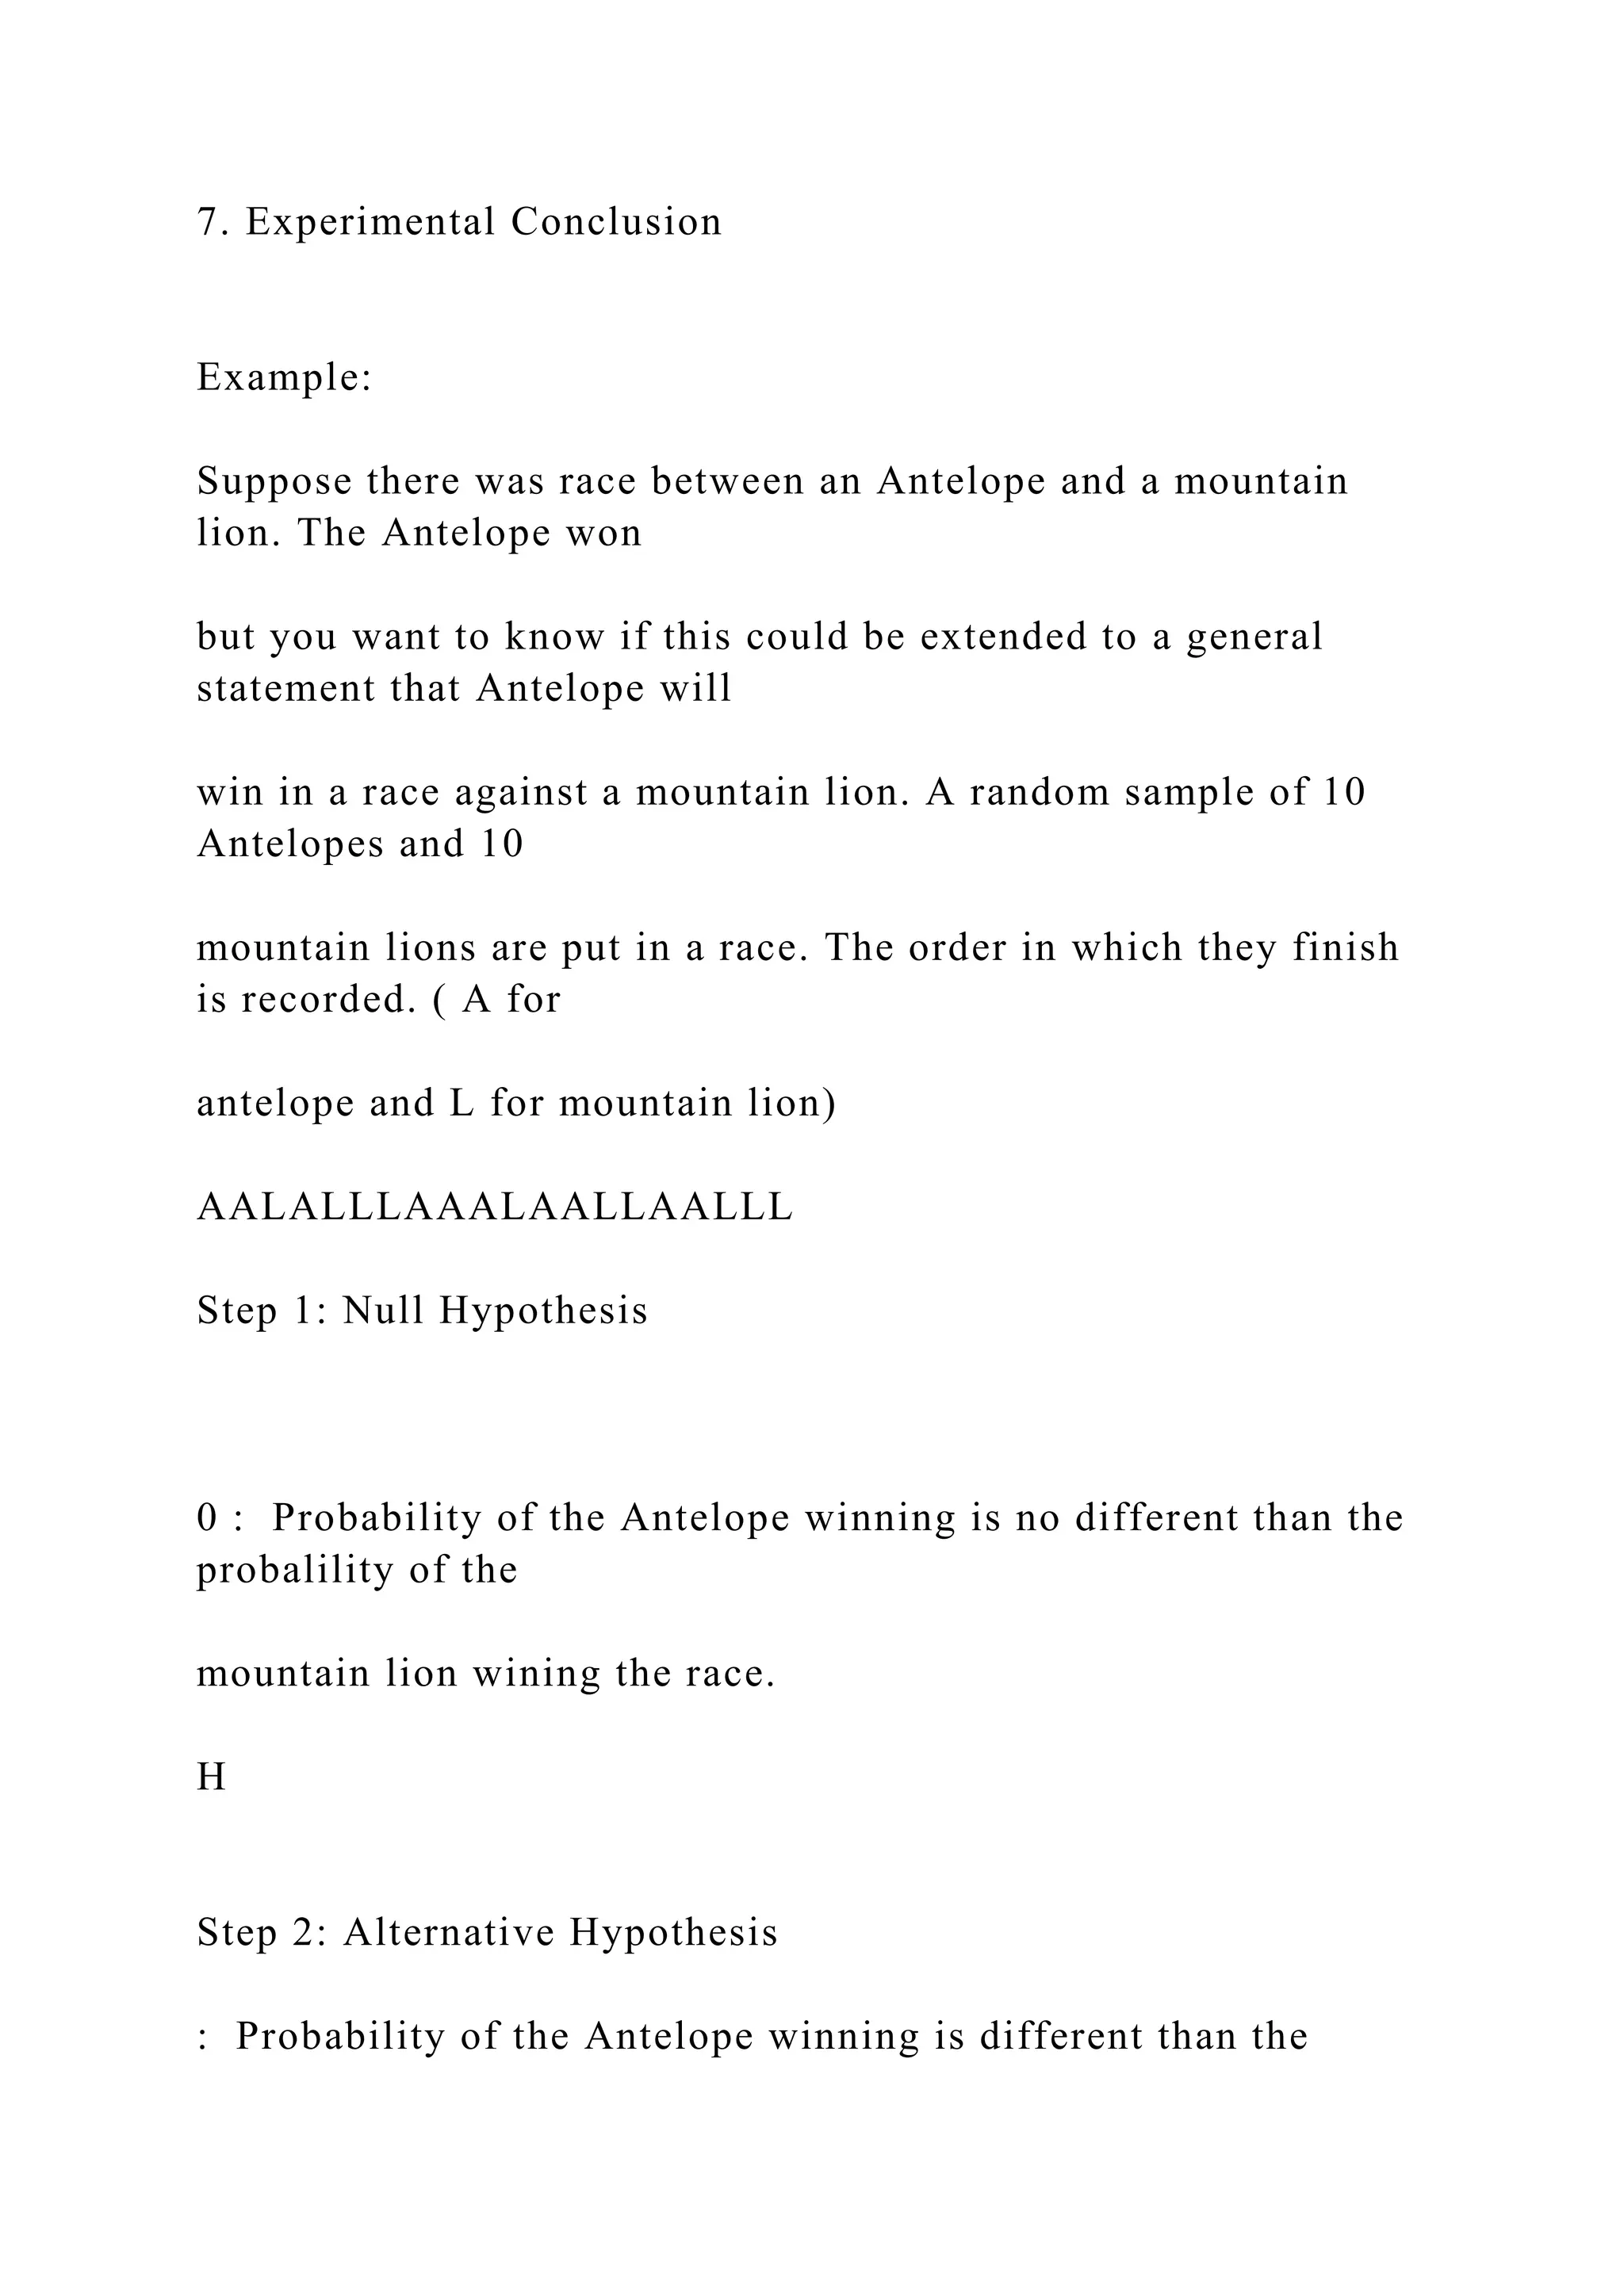
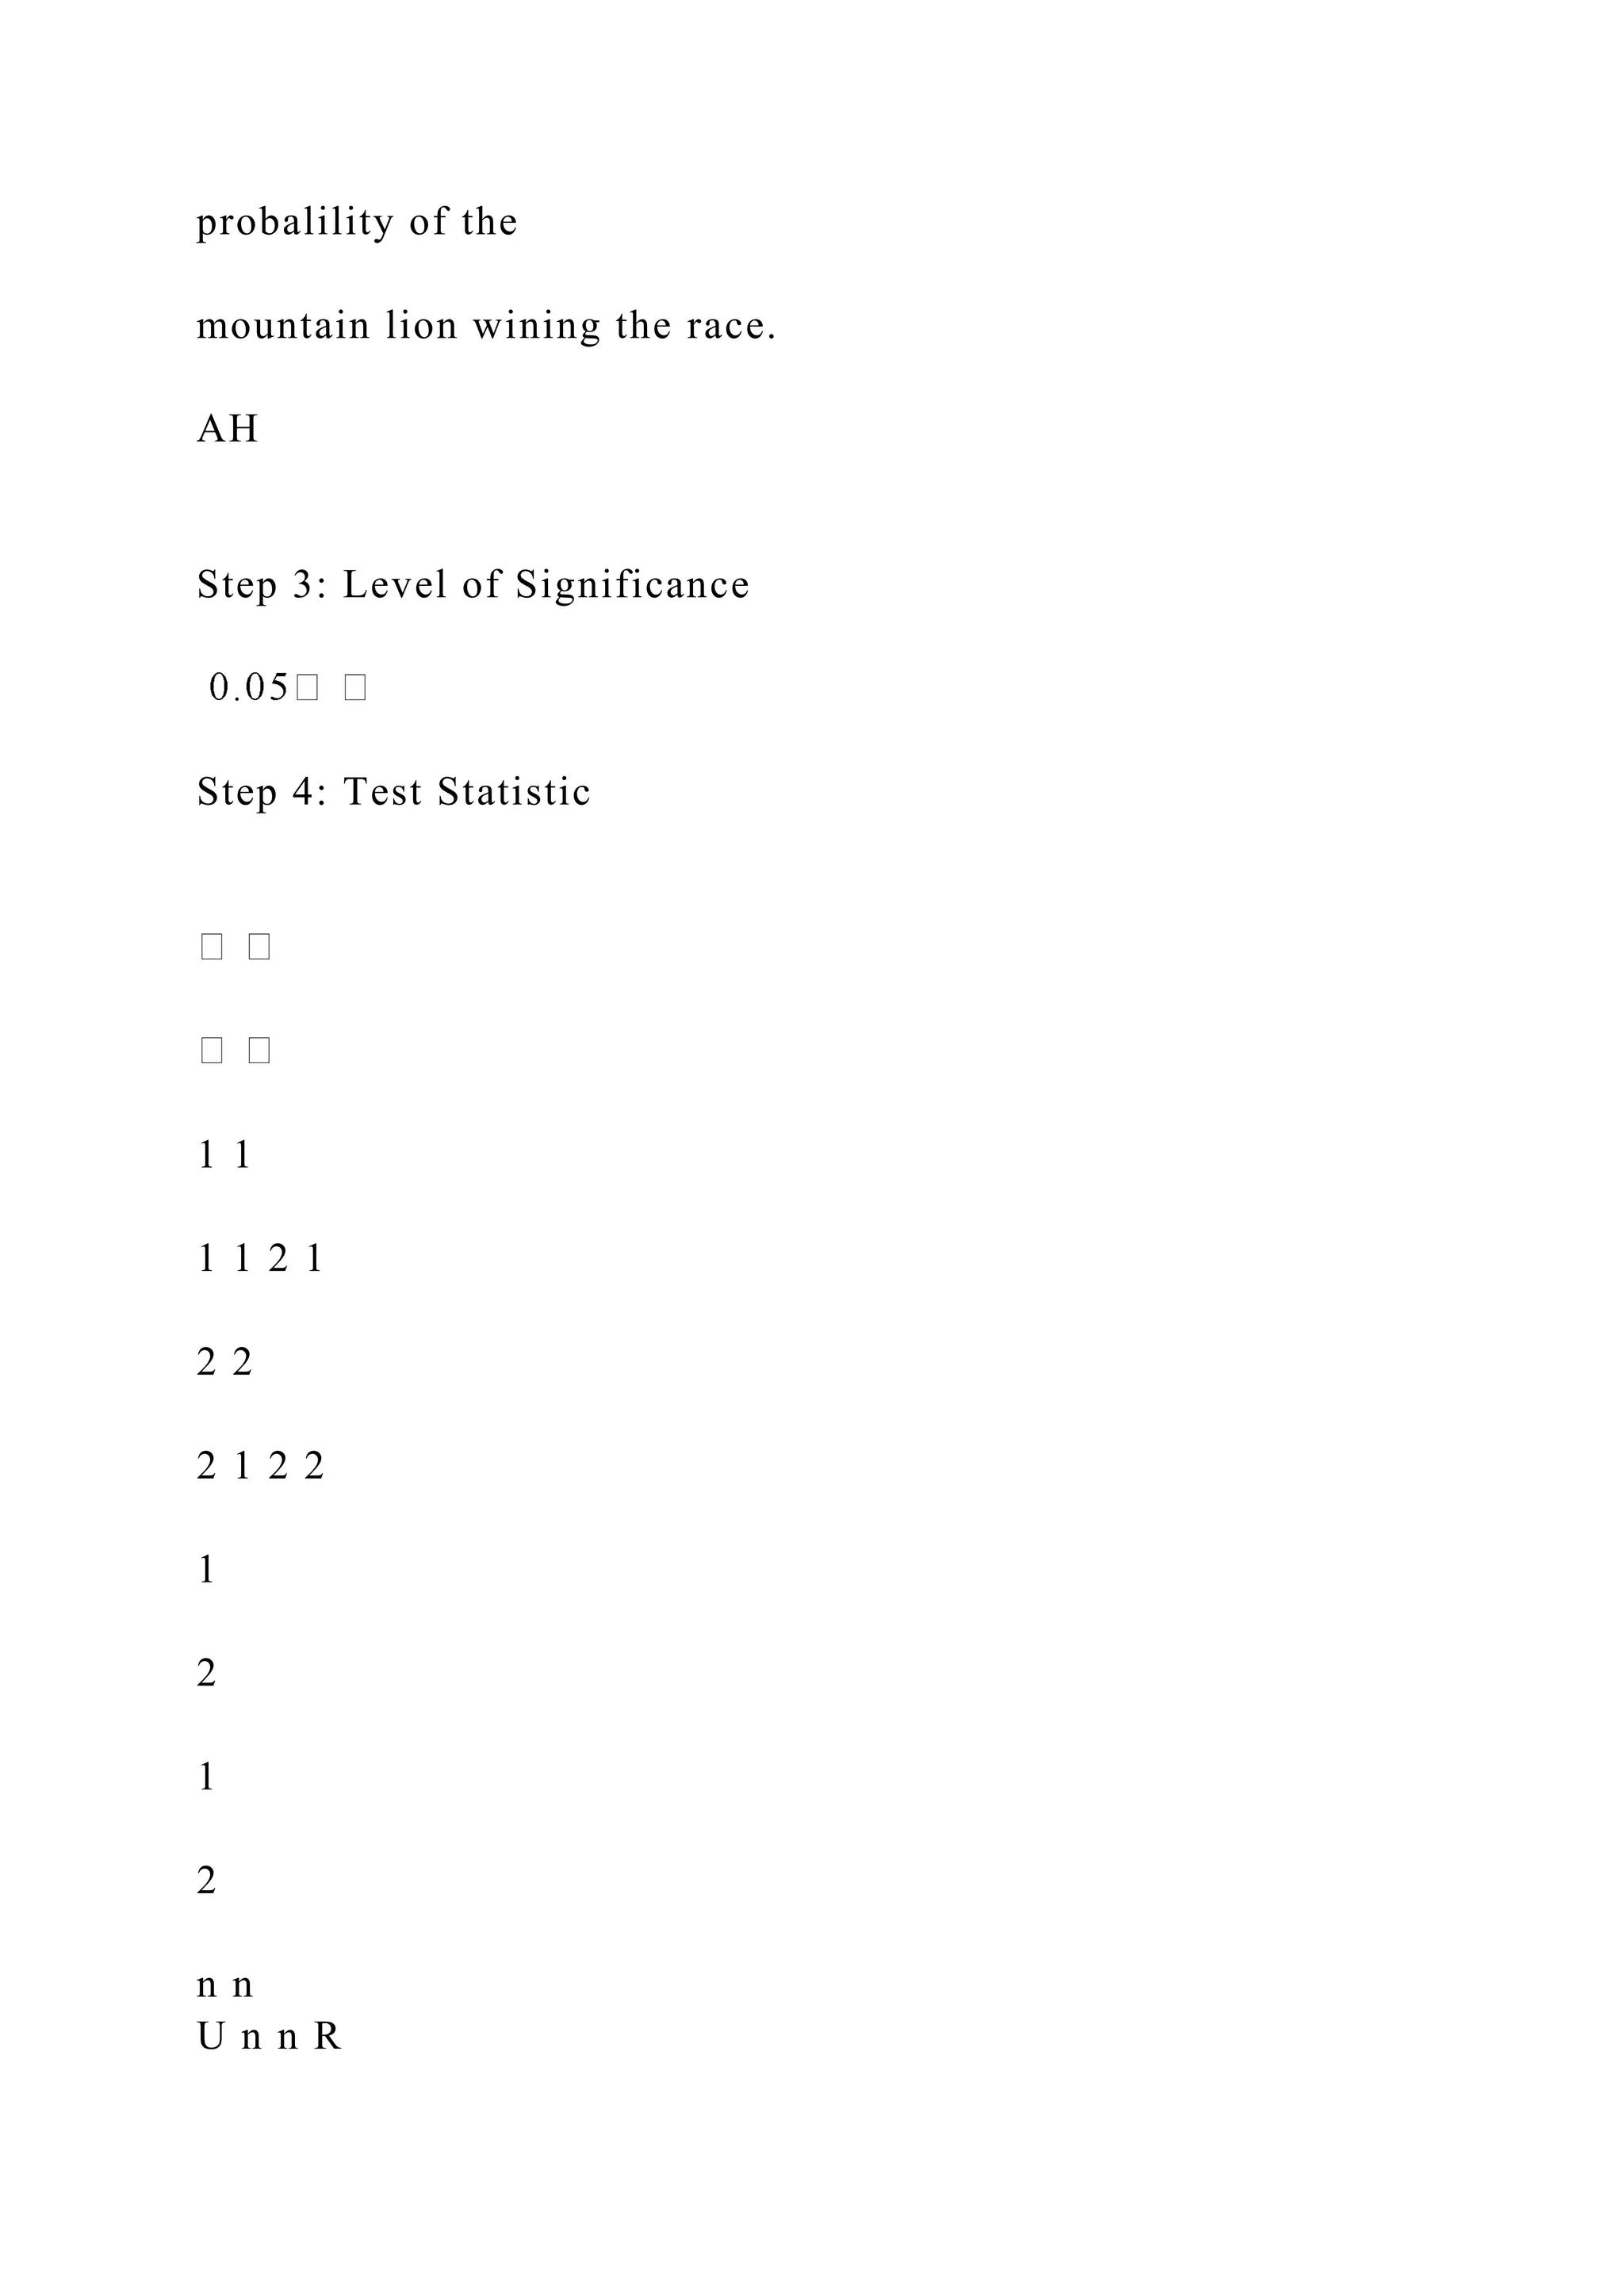
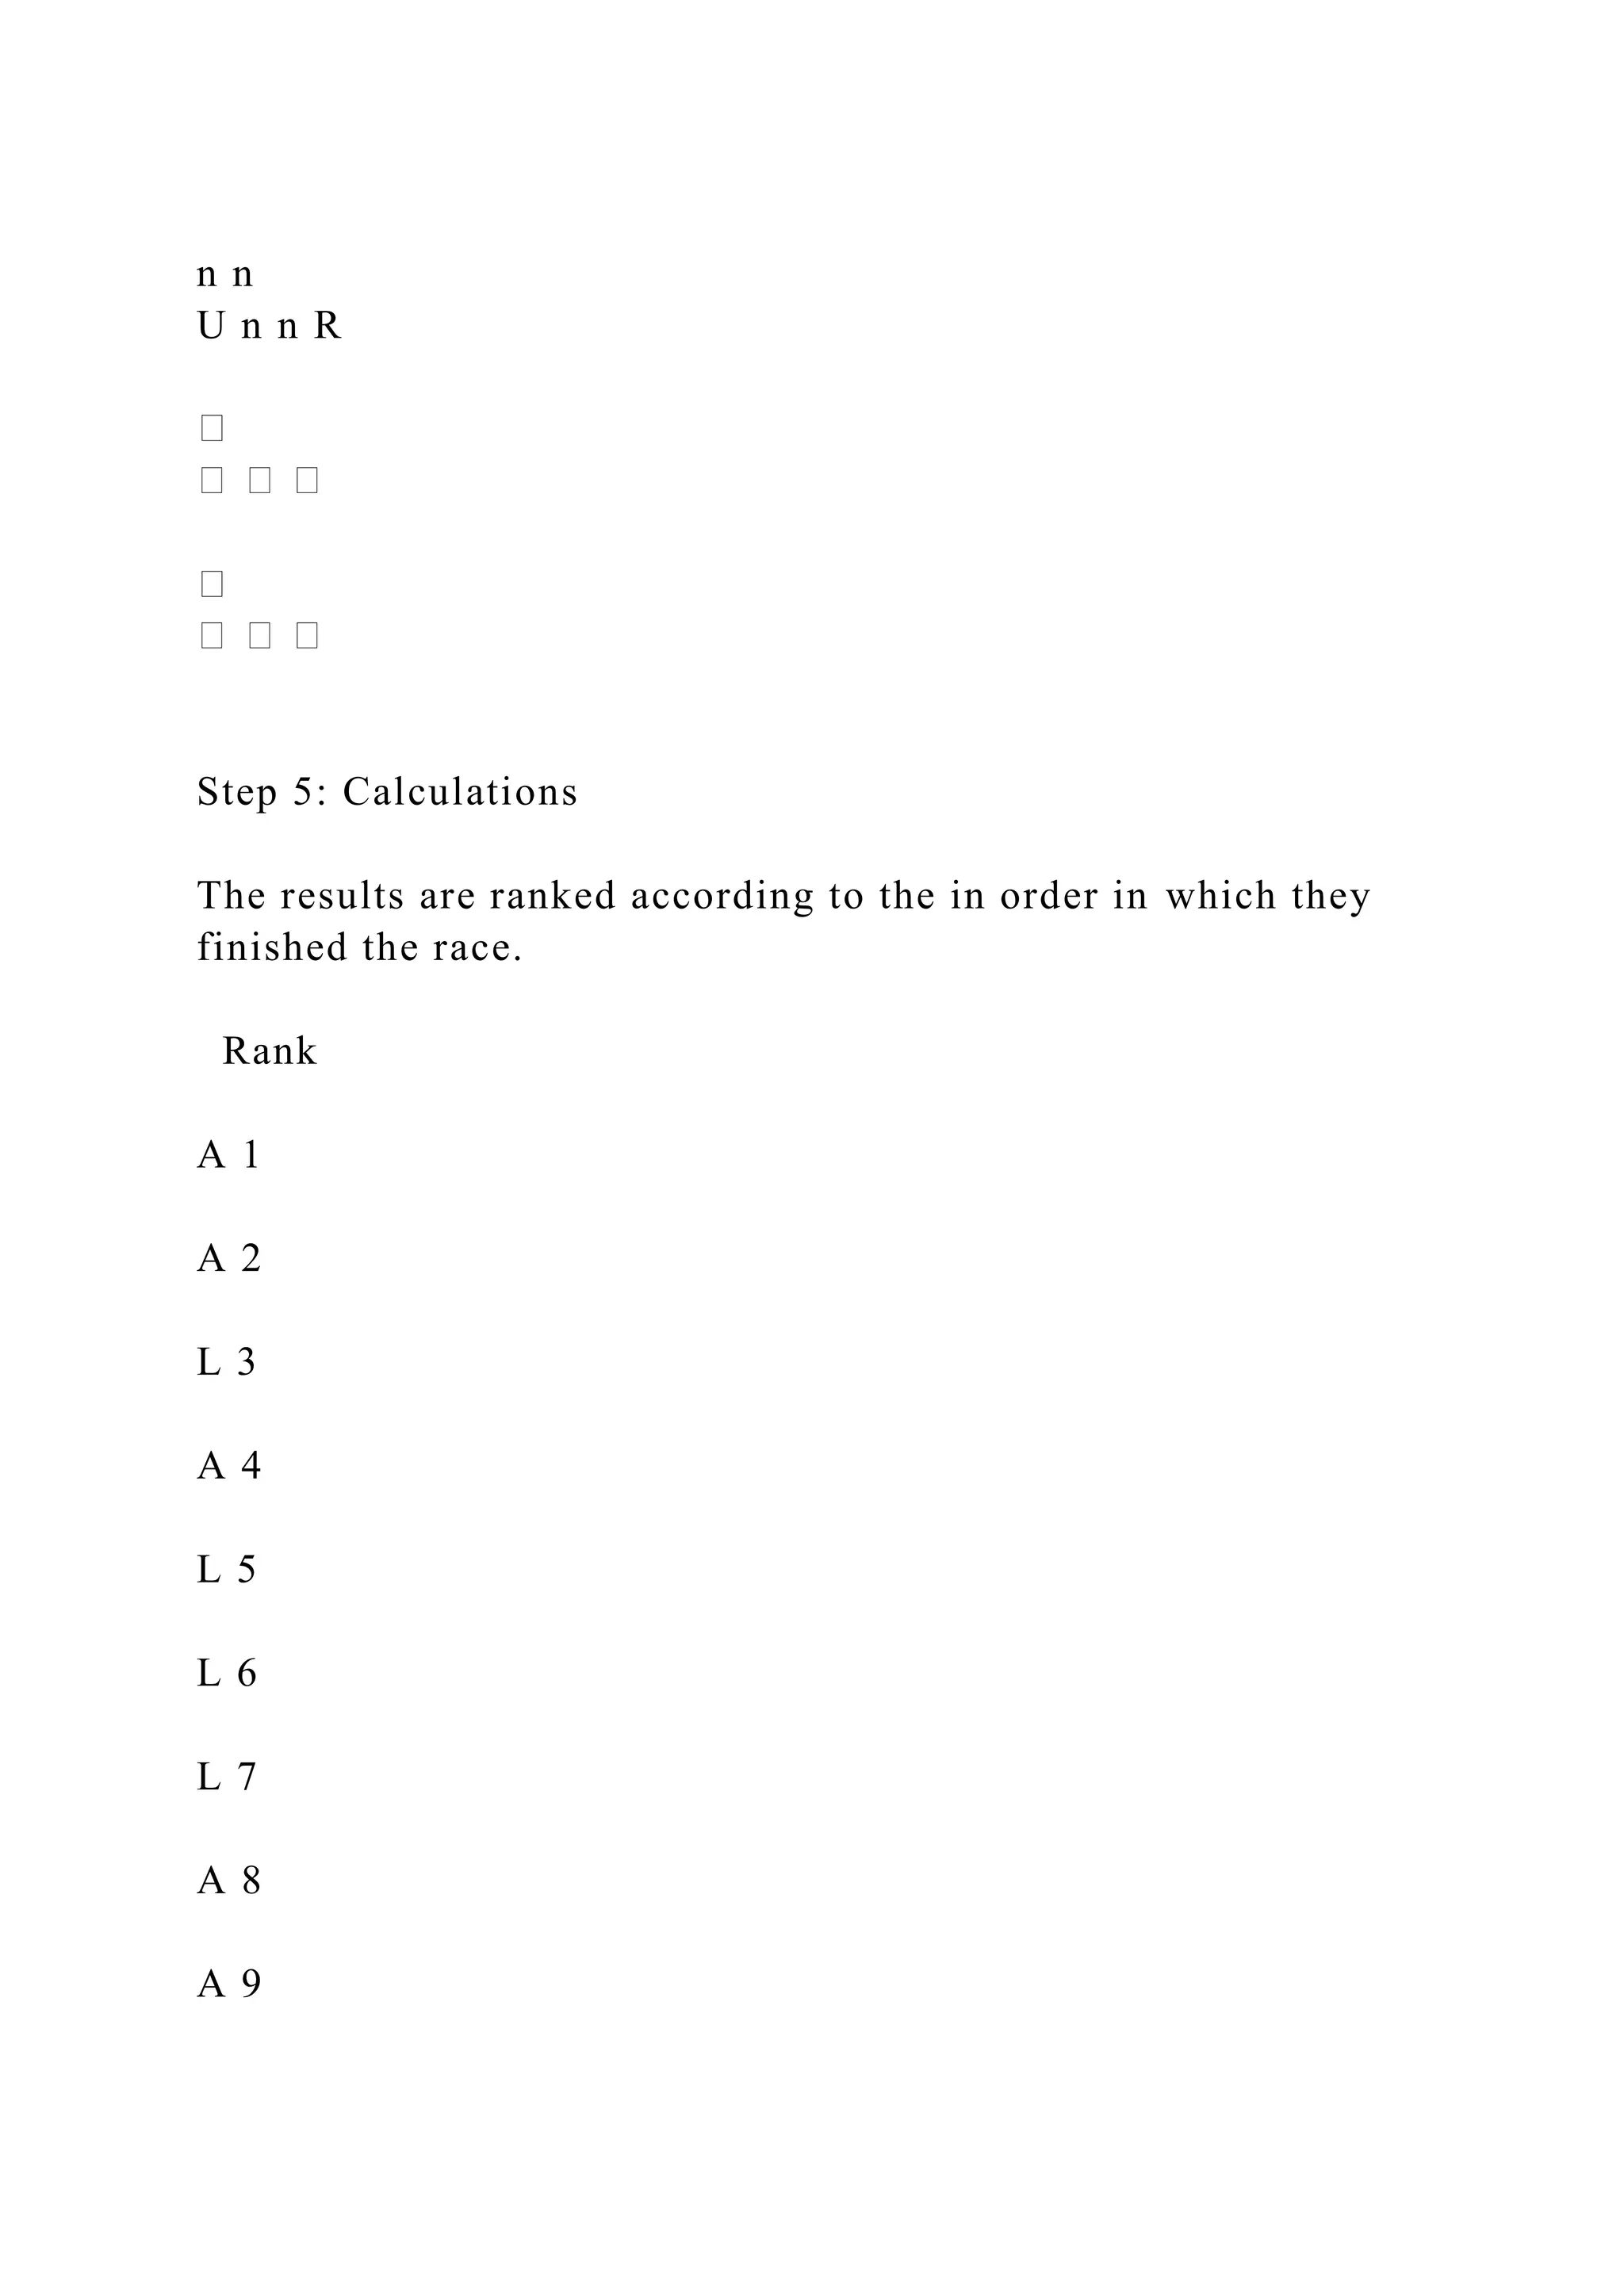
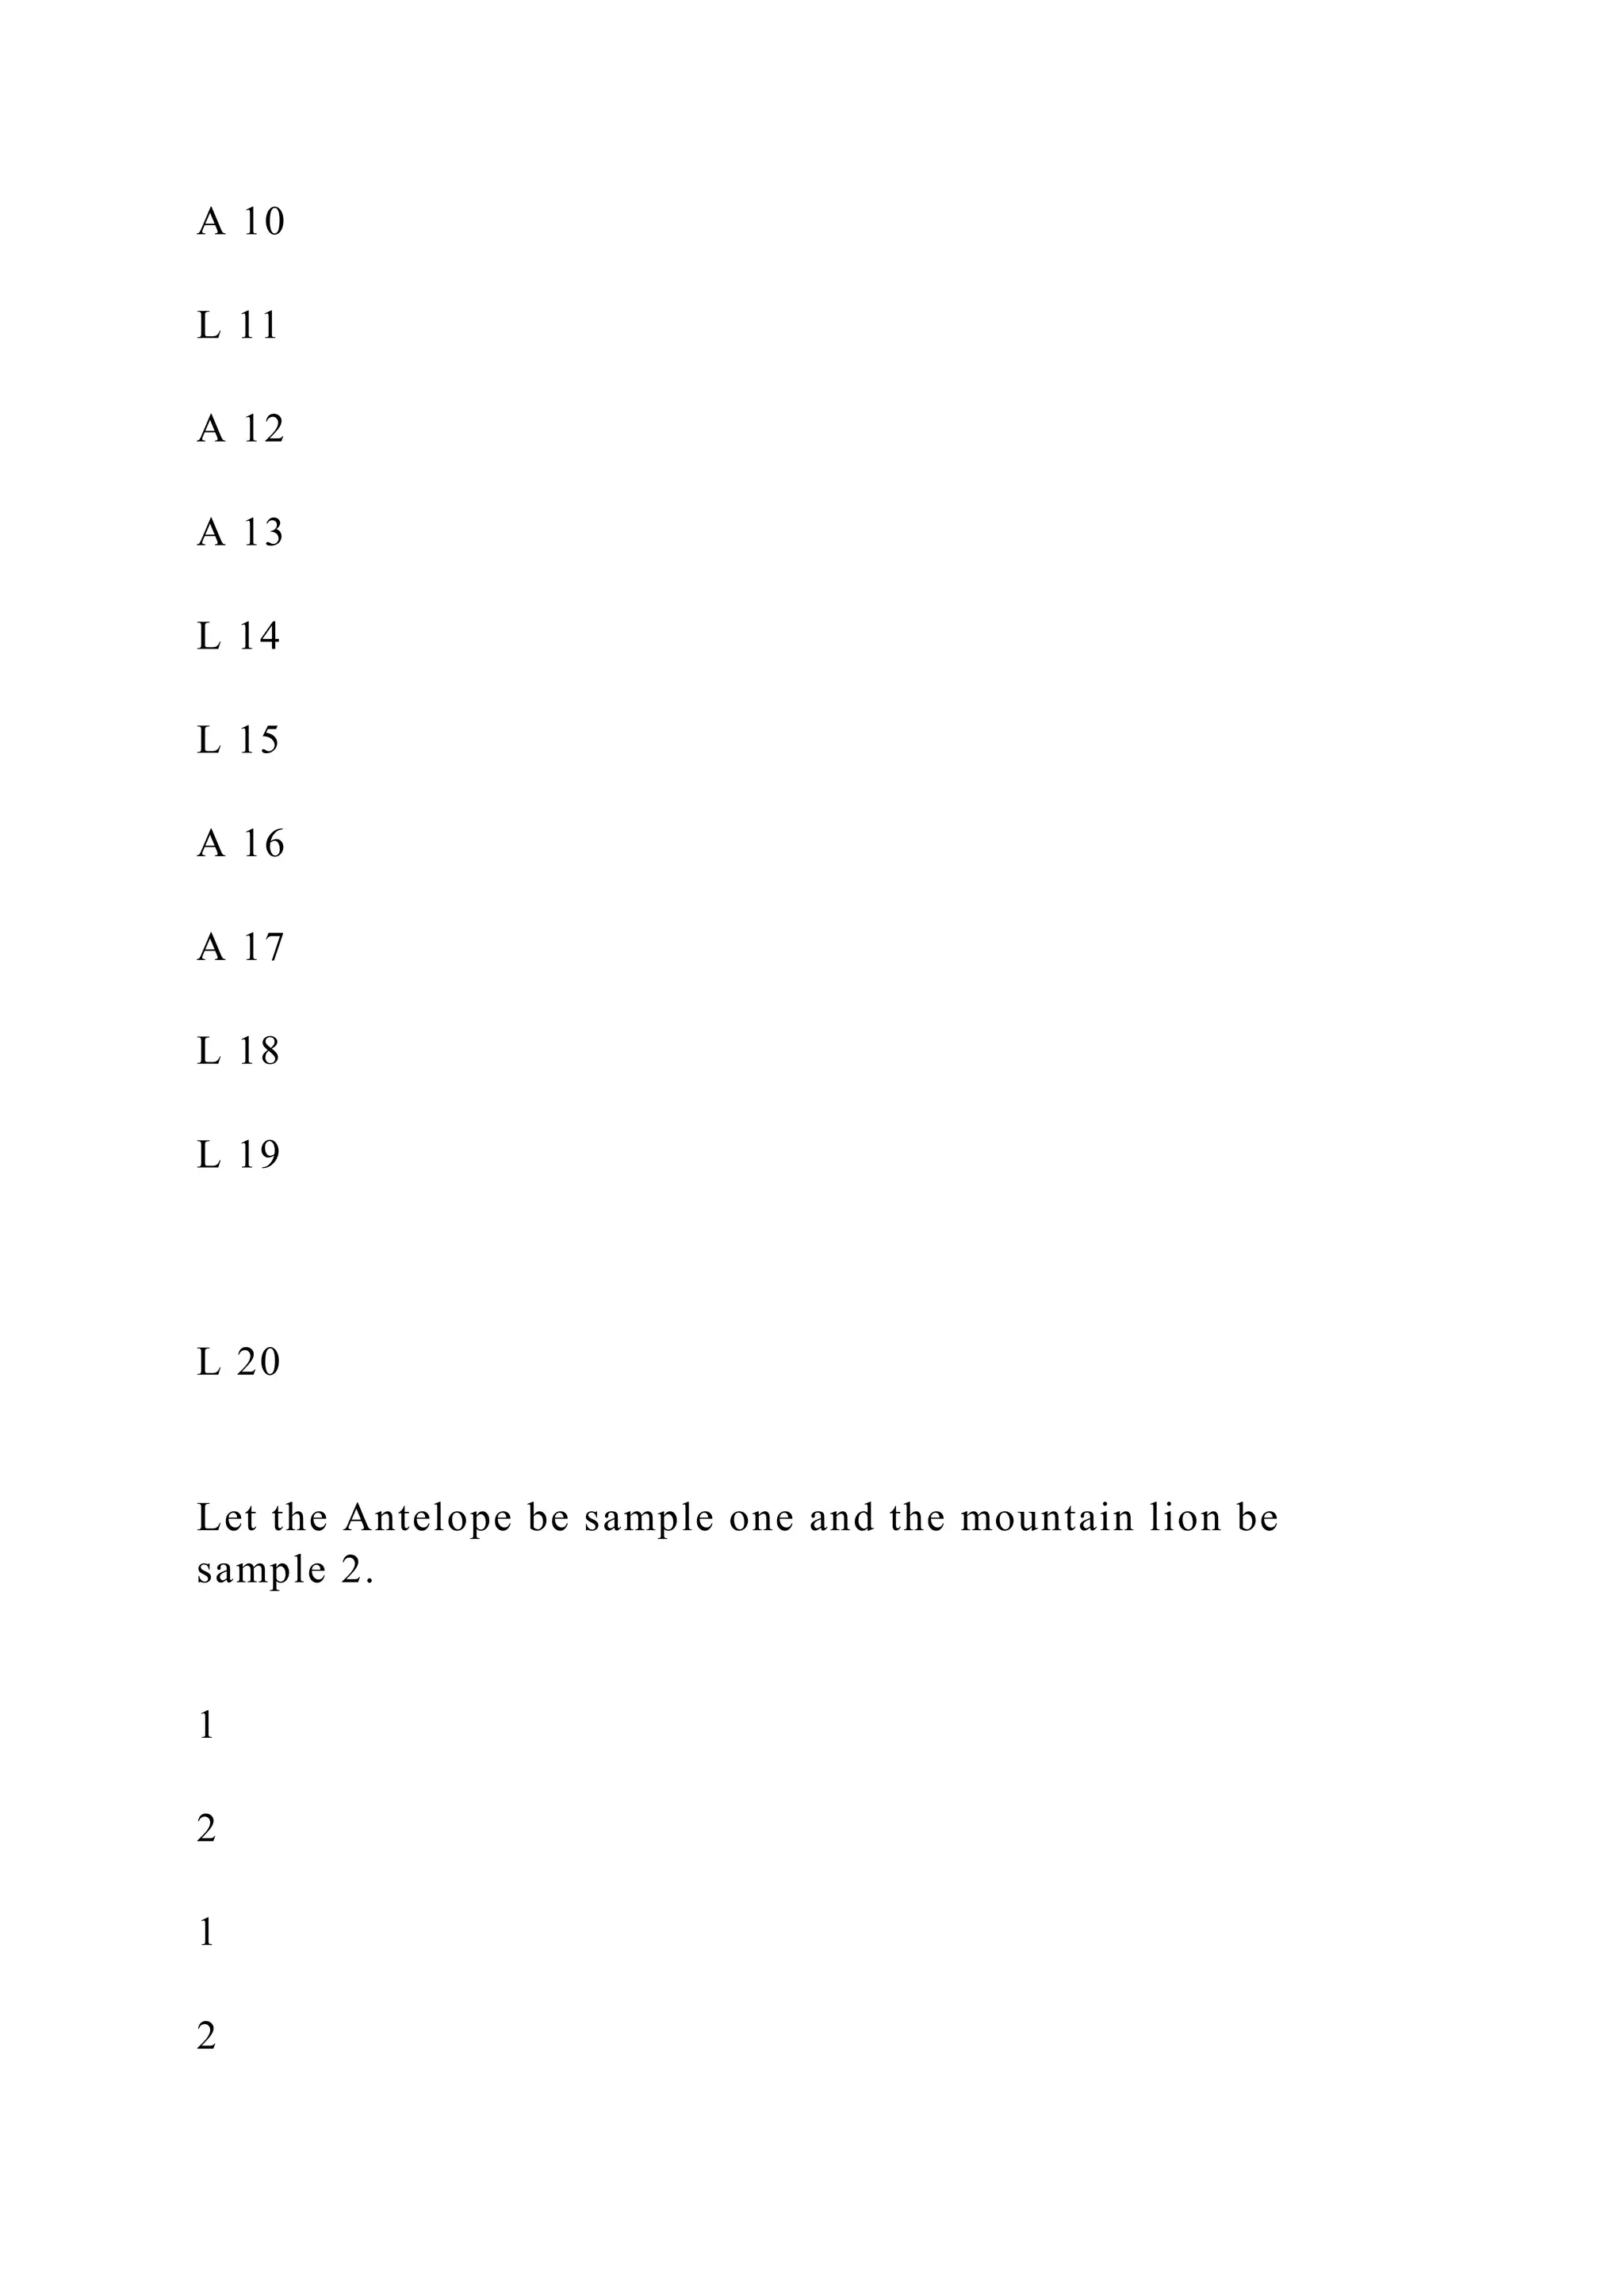
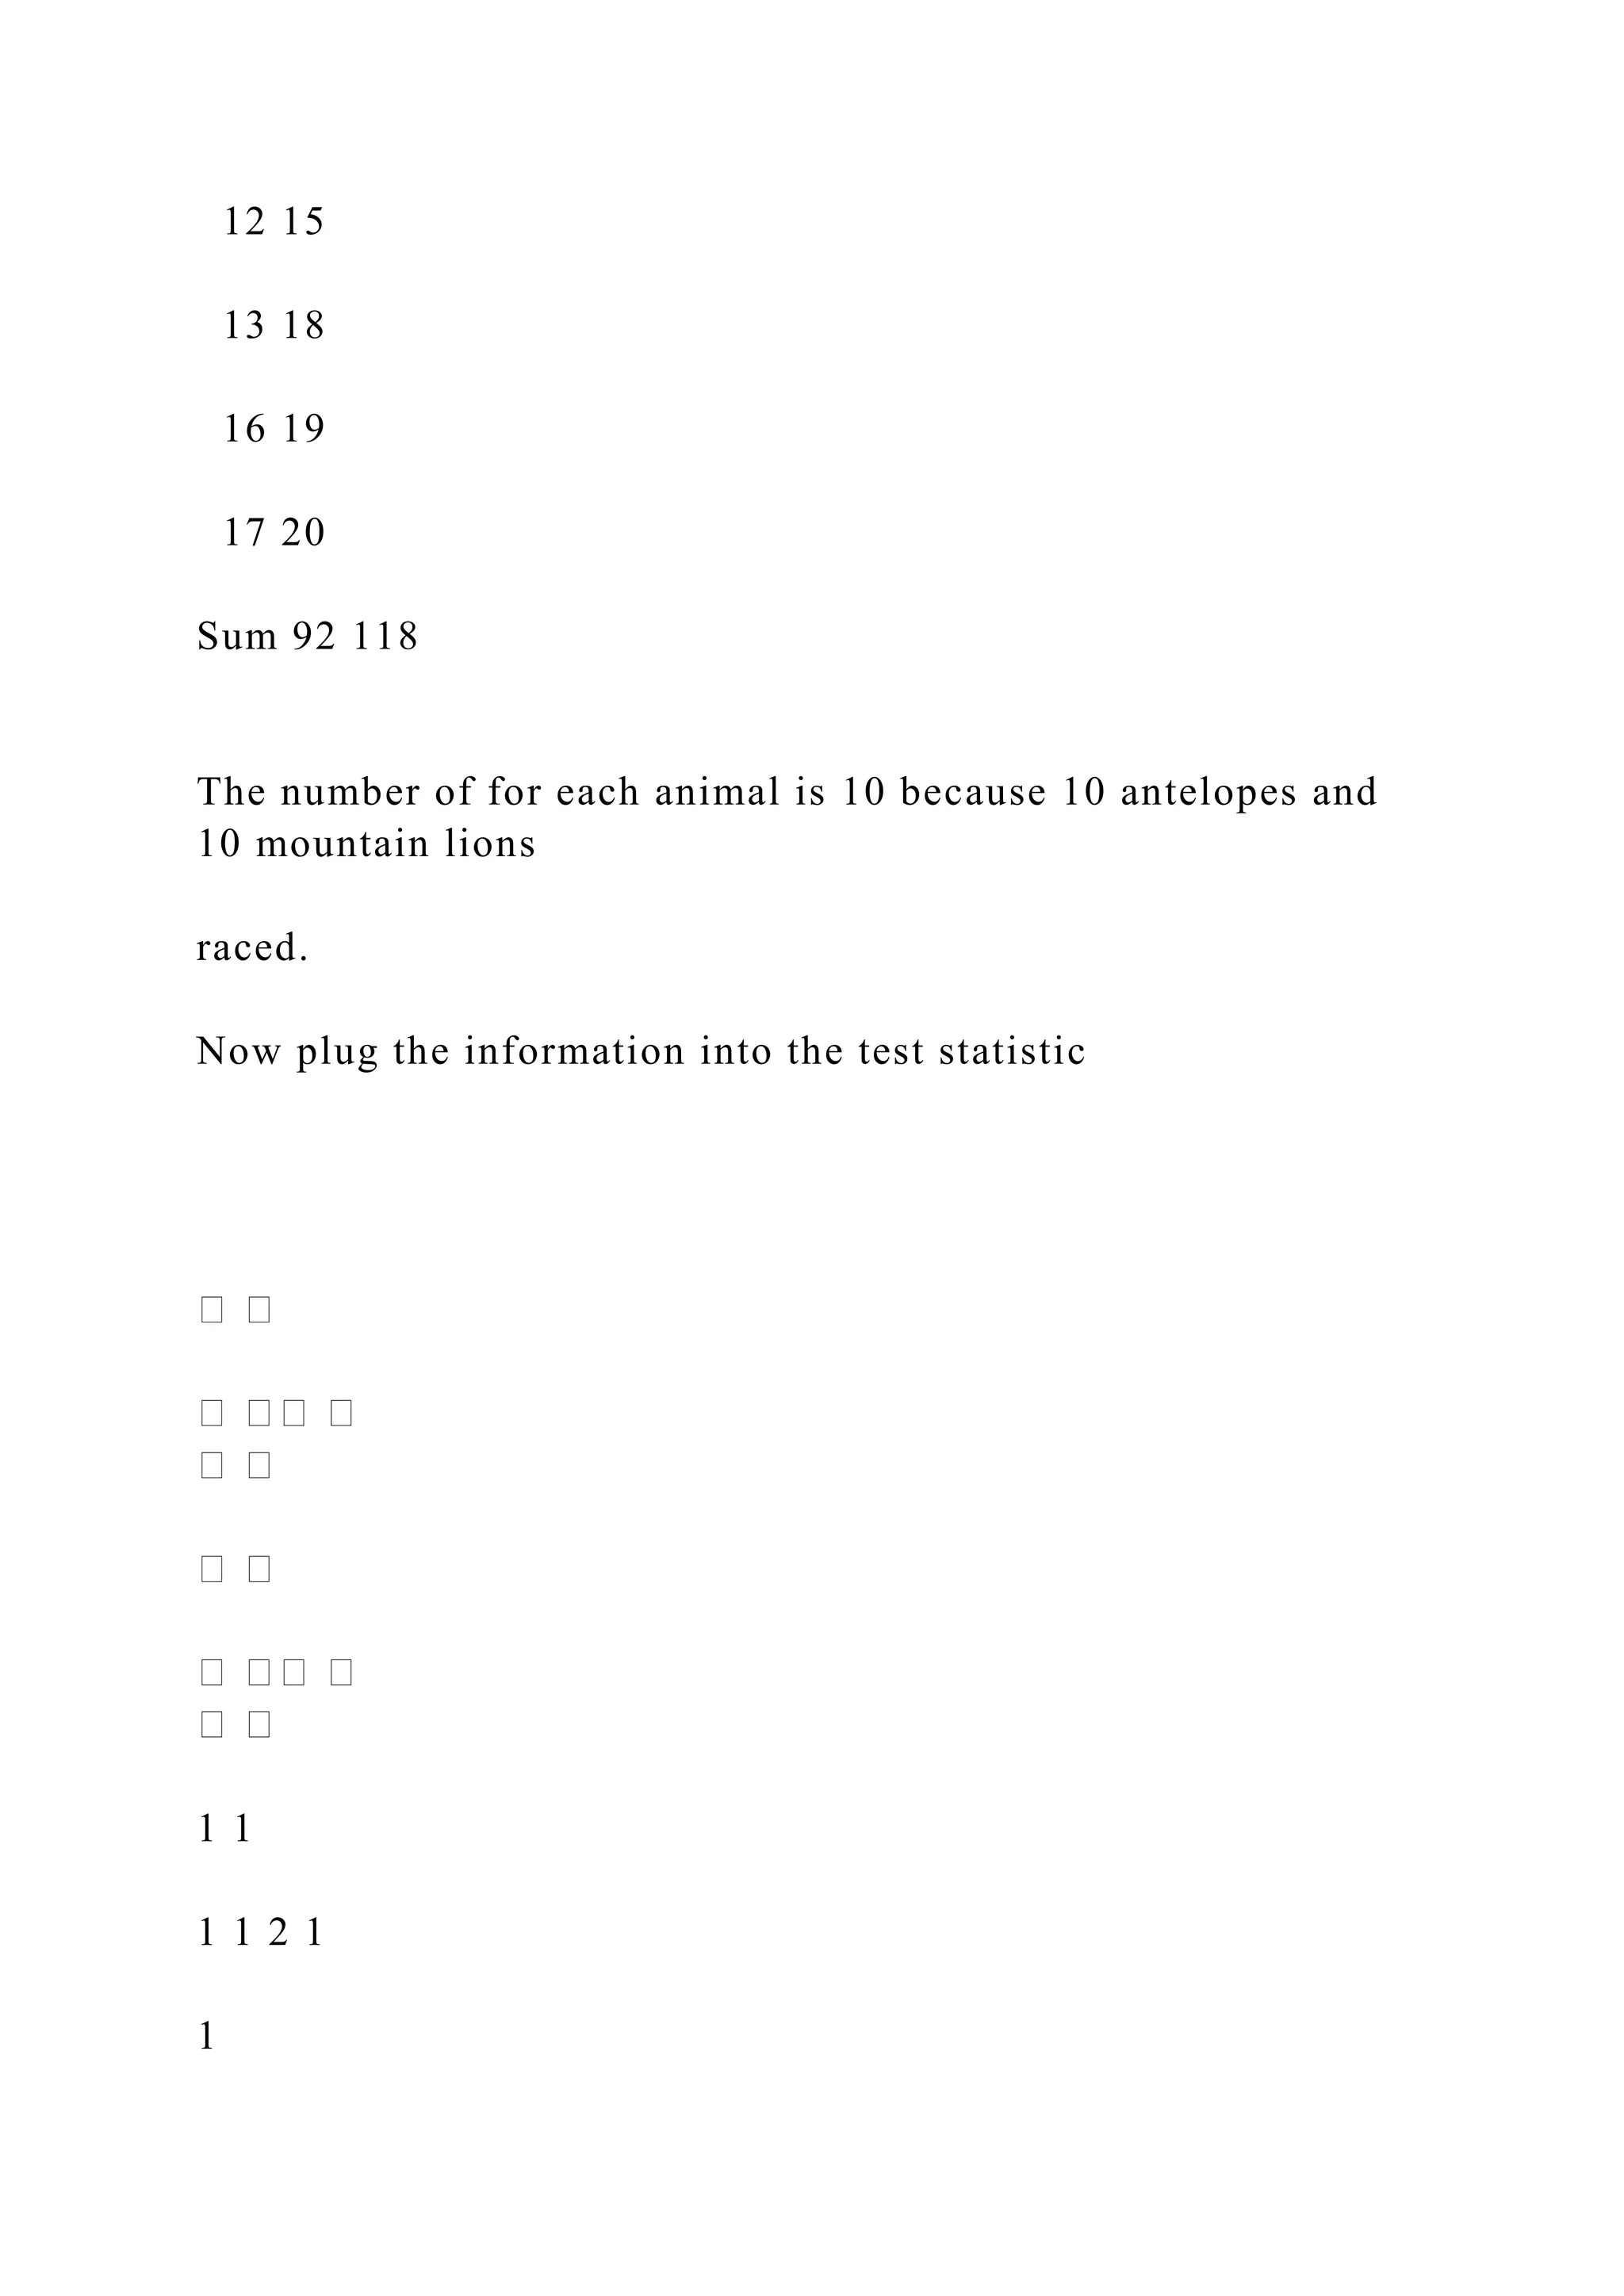
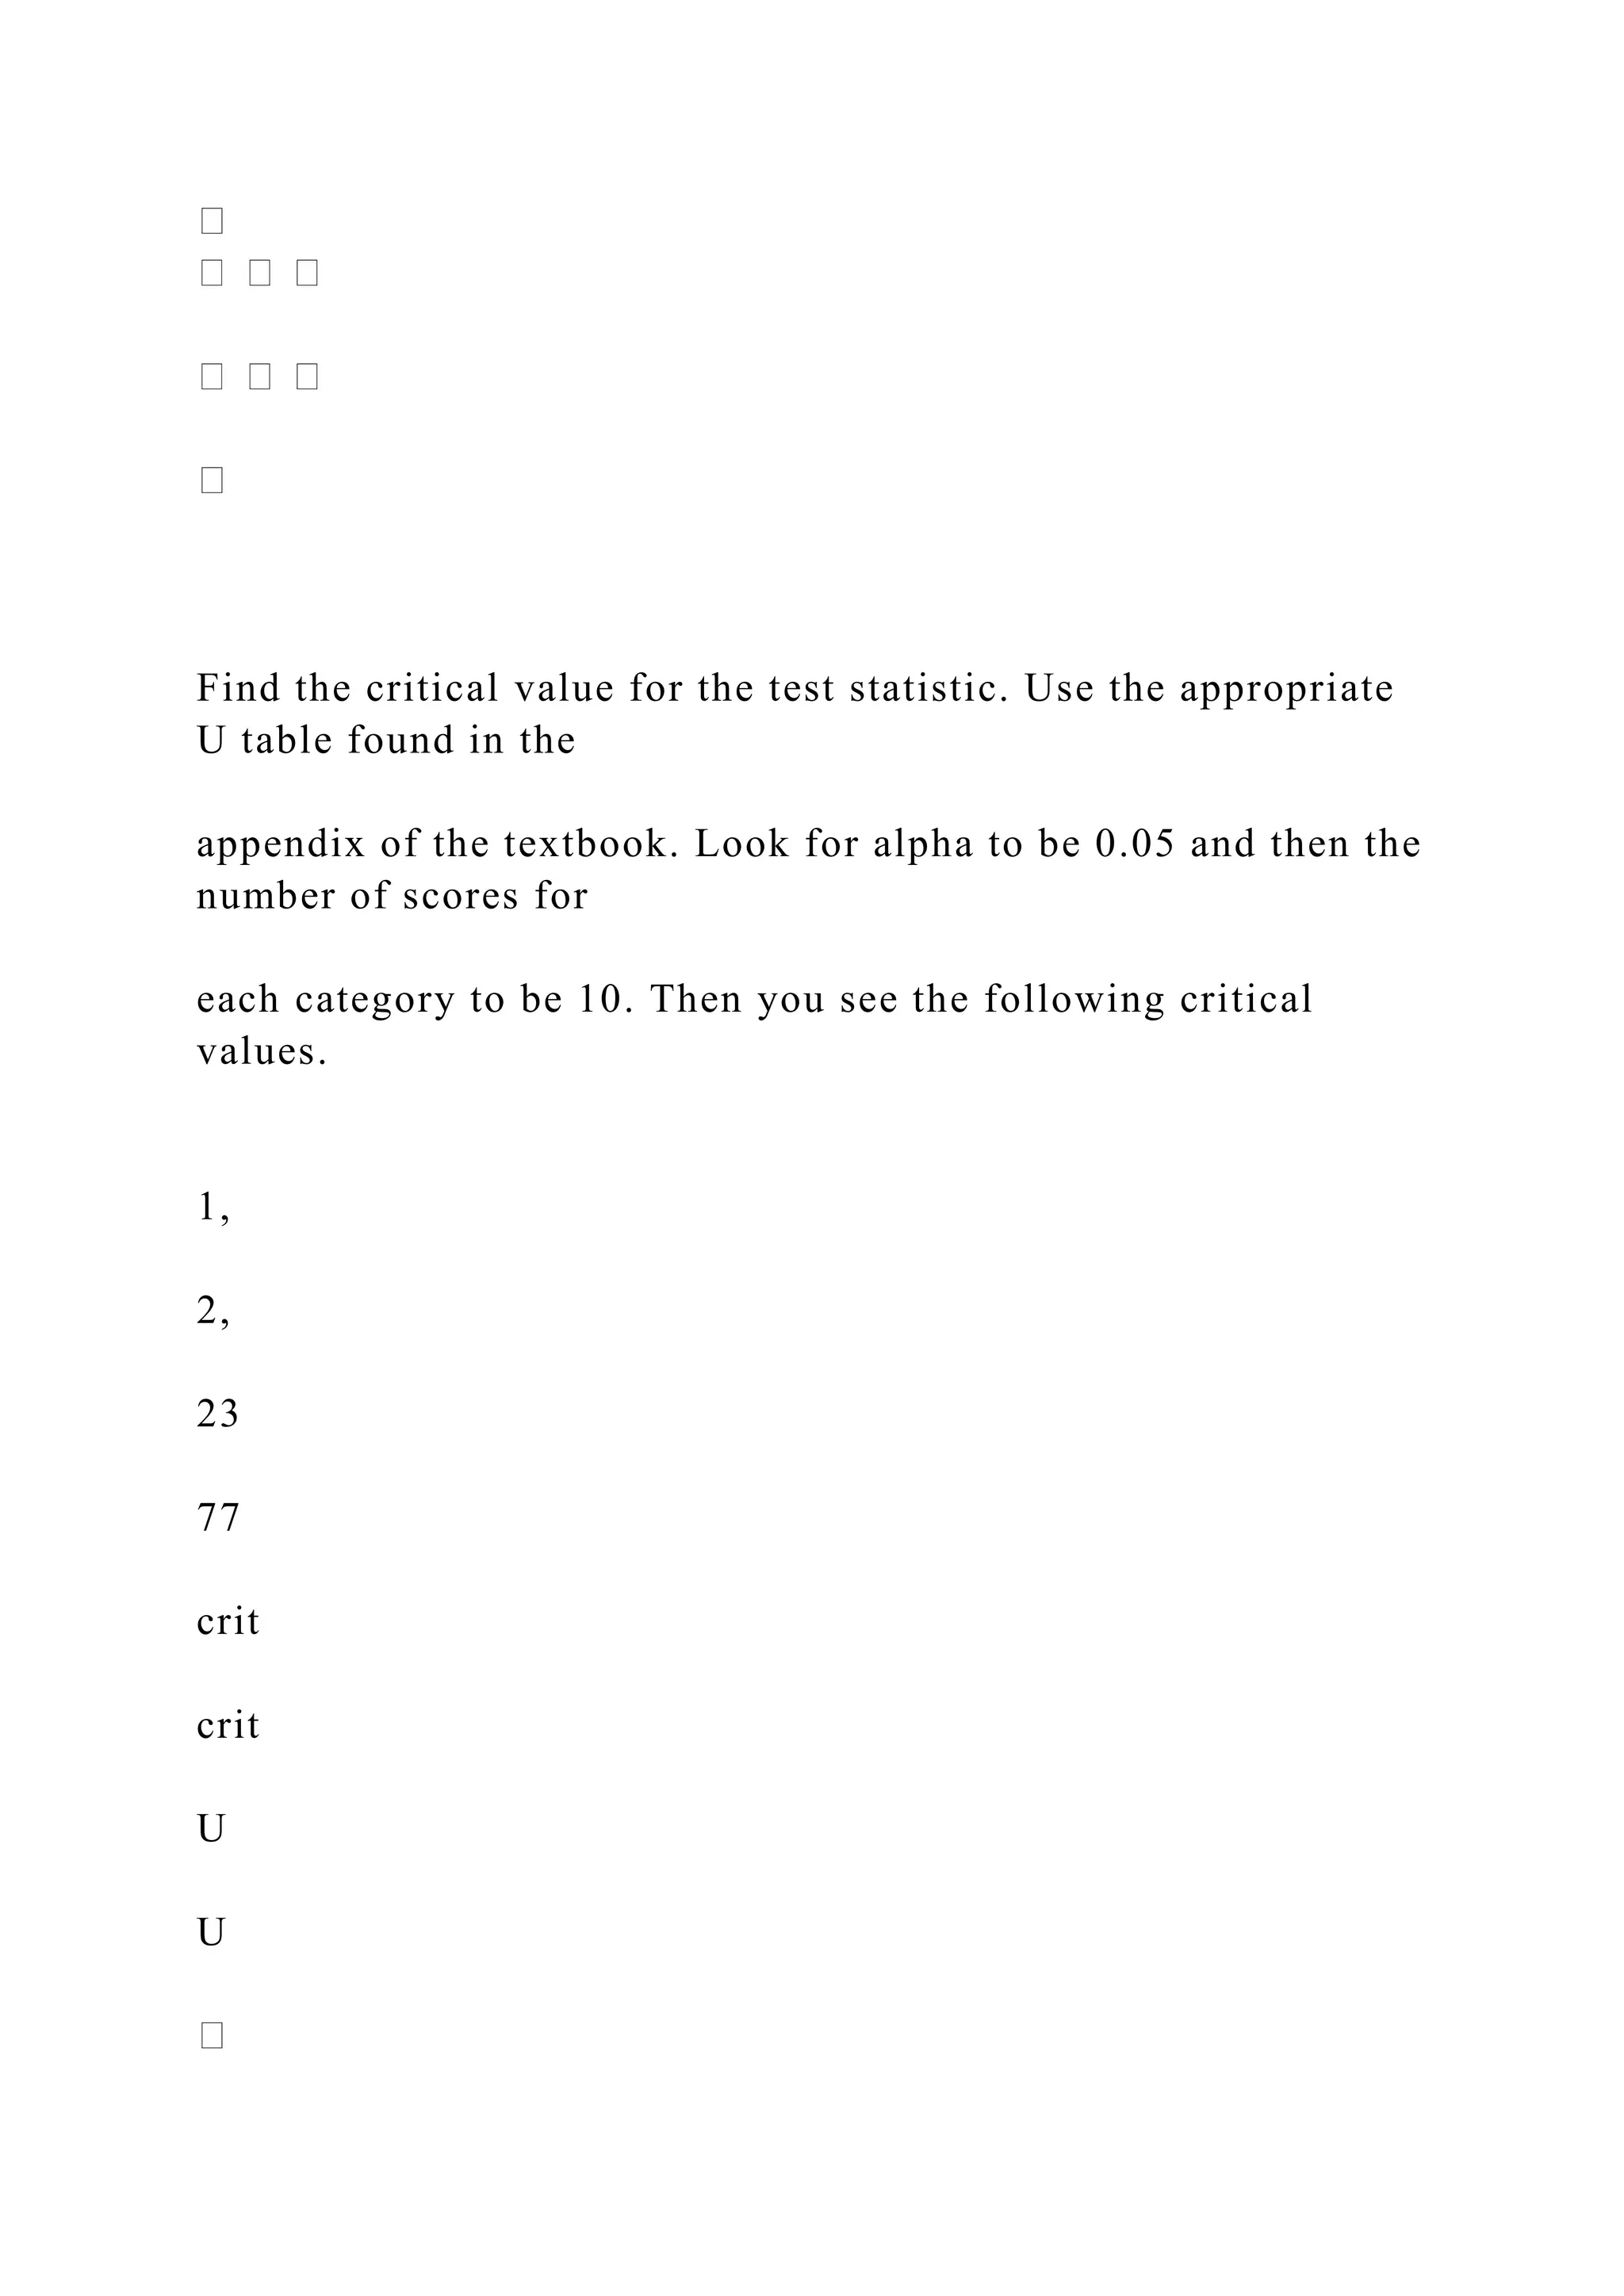
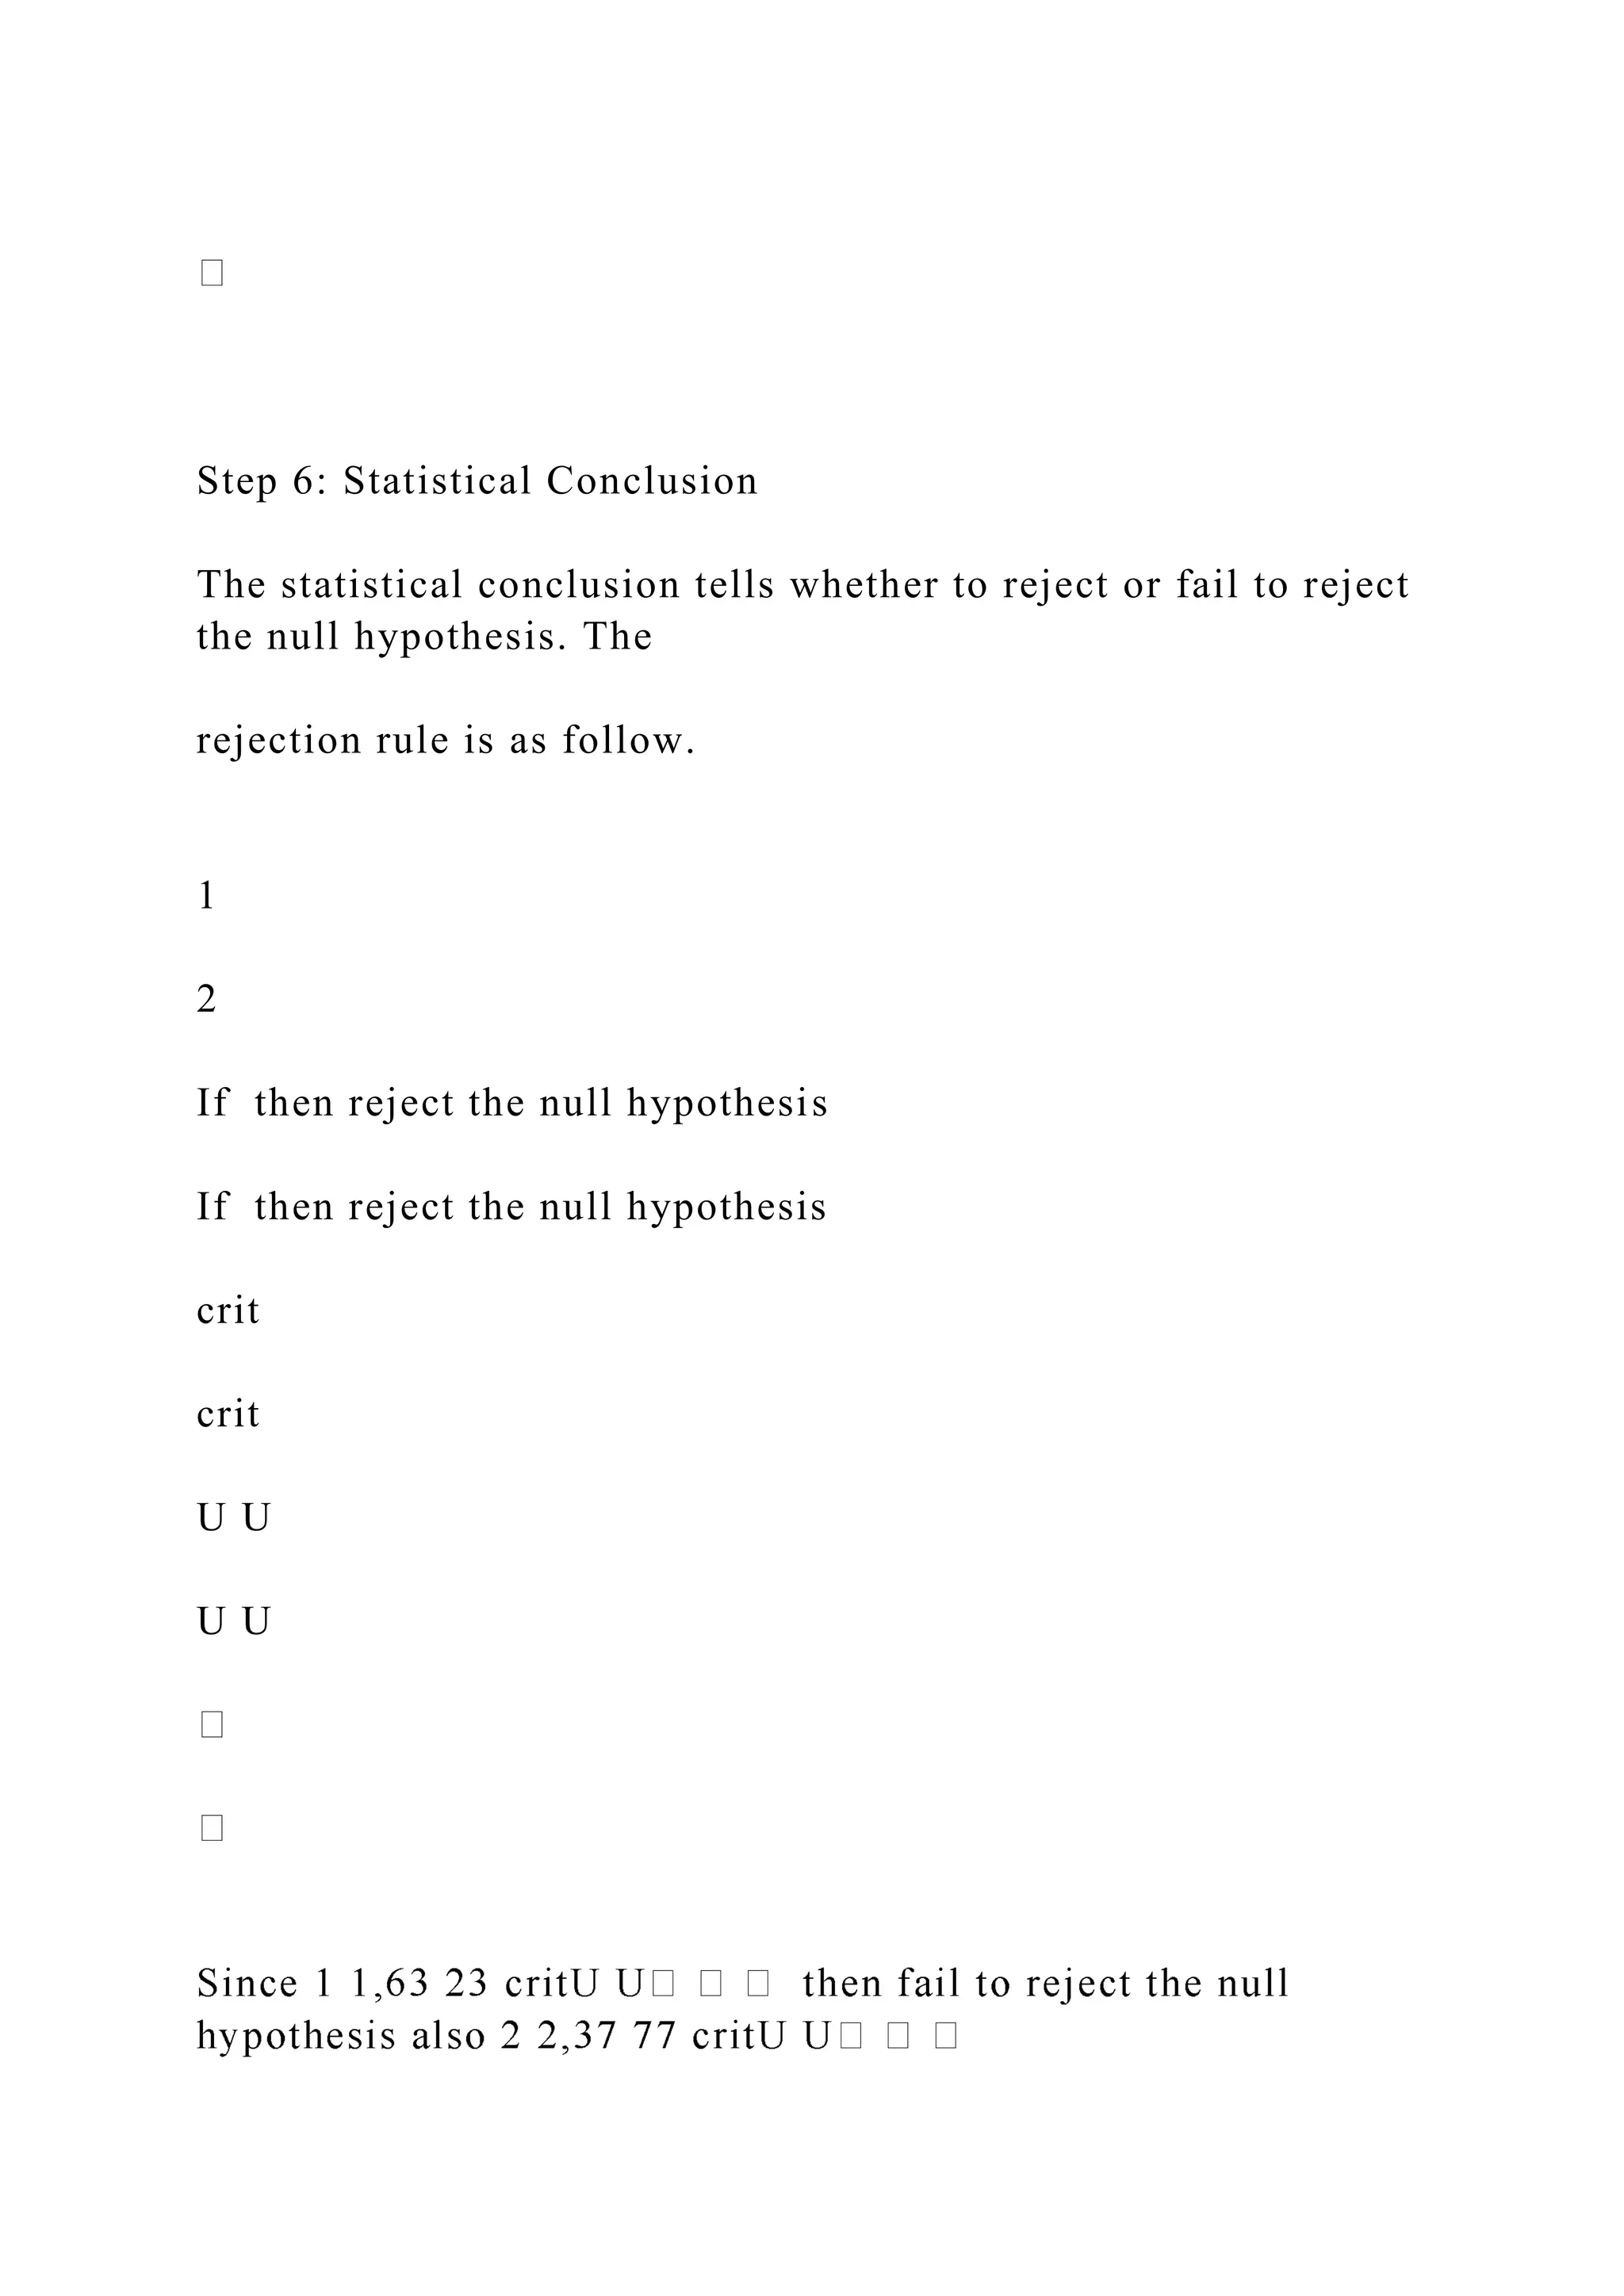
Nonparametric Test
Chi-Square Test for Independence
The test is used to determine whether two categorical variables are independent.
Notation for the Chi-Square Test for Independence (Please note that the notation varies
depending on the text)
O represents the observed frequency of an outcome
E represents the expected frequency of an outcome
r represents the number of rows in the contingency table
c represents the number of columns in the contingency table
n represents the total number of trials
Test Statistic
2
2
1 1
O E
E
df r c
The Chi-Square test is a hypothesis test. There are seven steps for a hypothesis test.
1. State the null hypothesis
2. State the alternative hypothesis
3. State the level of significance
4. State the test statistic
5. Calculate
6. Statistical Conclusion
7. Experimental Conclusion
Example
A university is interested to know if the choice of major has a relationship to gender. A
random sample of 200 incoming freshmen students was taken (100 male and 100
female). There major and gender were recorded. The results are shown in the
contingency table below.
Major Female Male
Math 5 15
Nursing 44 10
English 10 10
Pre-Med 17 20
History 4 5
Education 15 20
Undecided 5 20
To determine if there is a relationship between the gender of a freshmen student and
thei declared major perform the hypothesis test (Use level of significance 0.05 ) .
Step 1: Null Hypothesis
0 : Gender and Major of Freshmen students are independentH
Step 2: Alternative Hypothesis
: Gender and Major of Freshmen students are not independentAH
Step 3: Level of Significance
0.05
Step 4: Test Statistic
2
2
1 1
O E
E
df r c
Step 5: Calculations
There are several calculations for this test. We have to find the expected frequency for
each cell in the contingency table. The expected frequency is the probability under the
null hypothesis times the total frequency for the given row. Here the probability under
the null hypothesis is .5, as the probability of being male and female is equal.
rE pn
Major Female Male
Math 1 .5 20 10E 2 .5 20 10E
Nursing 3 .5 54 27E 4 .5 54 27E
English 5 .5 20 10E 6 .5 20 10E
Pre-Med 7 .5 37 18.5E 8 .5 37 18.5E
History 9 .5 9 4.5E 10 .5 9 4.5E
Education 11 .5 35 17.5E 12 .5 35 17.5E
Undecided 13 .5 25 12.5E 14 .5 25 12.5E
Know calculate the test statistic.
2
2
2 2 2 2
2
2 2 2 2
2 2 2 2
2 2
2
5 10 15 10 44 27 10 27
10 10 27 27
10 10 10 10 17 18.5 20 18.5
10 10 18.5 18.5
4 4.5 5 4.5 15 17.5 20 17.5
4.5 4.5 17.5 17.5
5 12.5 20 12.5
12.5 12.5
2.5 2.5 10.7 10.7 0 0 .1216
obs
ob.
Kines 260 Take Home FinalNameDue Friday December 12th at 11 A.docxDIPESH30
Kines 260 Take Home Final
Name:
Due Friday December 12th at 11 A.M. in my mailbox
152 pts total
For Questions 1-2 use the 7 step process to answer. Refer to slides if you are unsure of the 7 step process. PLEASE DON’T OMIT ANY PART OF THE PROCESS!!! (40 pts) THIS IS DONE IN SPSS USING BREAST CANCER AND OBESITY DATASET
Dataset Background – PLEASE READ:
Obesity is very common in American society and is a risk factor for breast cancer for postmenopausal women. One mechanism explaining why obesity is a risk factor is that it may raise estrogen levels in women. In particular, one type of estrogen, serum estradiol, is a strong risk factor for breast cancer. To better assess this relationship, researchers studied a group of 200 postmenopausal women. The SPSS file is entitled, Breast Cancer and Obesity.
Adiposity was measured in two different ways: (a) by body mass index (BMI) = weight (kg) / height (m2) and also (b) by waist-hip ratio (WHR) = waist circumference/hip circumference. BMI is a measure of overall adiposity, whereas WHR is a measure of abdominal adiposity. In addition, a complete hormonal profile was obtained, including serum estradiol. Finally, other breast-cancer risk factors were also assessed among these women, including ethnicity, parity, age at first birth, and age at menarche.
Codebook
Variable
Column
Code
Label
Values (if categorical)
Id
1
Identification number
ES_1
2
Serum Estradiol
ETHNIC
3
Ethnicity
1 = African-American, 0 = Caucasian
NUMCHILD
4
Parity, number of children
AGEFBO
5
Age at 1st birth
(missing a response if never had a child)
ANYKIDS
6
Gave birth to any children?
1 = Yes, 0 = No
AGEMENAR
7
Age at menarche
BMI
8
Body Mass Index
WHR
9
Waist-hip ratio
**Missing responses are left blank
ALSO THE FOLLOWING CONTINUOUS VARIABLES HAVE BEEN CATEGORIZED!!
· BMI has been categorized, bmi_cat, : normal BMI (<25) and abnormal BMI (25 or greater).
· Menarche has been categorized, menarche_cat, two categories - 9-12 and 13-16
· WHR has also been categorized, whr_category, 3 categories - 0-.69, .7-.79, and .8 and greater
1. Is there a statistically significant difference in mean estradiol between African Americans and Caucasions?
a. Provide a visual aid depicting the mean differences between the two groups.
2. Is there a statistically significant difference in mean estradiol between ethnicity status depending on BMI_CAT (using the categorized variable, so normal or abnormal groups)?
3. Please use the rock climbing performance dataset. Here is the description: This is research done by a senior at PSU-Berks. He was interested in determining the effects of imagery on rock climbing performance. He chose 20 experienced rock climbers. With randomization on the order, he had them climb with no imagery on a rock wall and then had them climb with imagery (on a different but same difficulty ...
Week 2 Assignment1. A. What is the probability of rolling a four.docxmelbruce90096
Week 2 Assignment
1. A. What is the probability of rolling a four in the gambling dice game of craps (given two six sided dice)?
B. What is the probability that a player can roll a four 3 times in a row (assume that rolling the dice each time does not affect the outcome of the next roll)?
2. Population A and Population B both have a mean height of 70.0 inches with an SD of 6.0. A random sample of 30 people is picked from population A, and random sample of 50 people is selected from Population B. Which sample mean will probably yield a more accurate estimate of its population mean? Why?
3.
Suppose we obtained data on vein size after application of a nitroglycerin ointment in a sample of 50 patients. The mean vein size is found to be 7.8mm with an SD of 2.1. Using a t distribution table, what are the confidence limits for a 95% confidence interval? For a 99% confidence interval?
4.
In a pilot study evaluating the use of a new drug to lower resting heart rates (HR) of patients, the following data was recorded:
Subject #
Resting HR
001
72
002
88
003
71
004
87
005
64
006
77
007
79
008
59
009
66
010
68
011
78
012
89
013
91
014
81
015
77
016
75
017
69
Given that the average resting HR of the general population for this study is 72, use StatCrunch to perform the appropriate t test. What is the value of t? Using an alpha of 0.05, is the t statistic significant? Why? What are the confidence limits for a 95% confidence interval here and what do they mean for this patient group? Copy and Paste your work from StatCrunch into your Word document submission.
5.
Write one or two sentences that could be used to report the results obtained for the t-test in Exercise 4.
6.
For which of the following situations is the independent groups t-test appropriate (if inappropriate, why?):
a.
The independent variable is infant birth weight at one week (normal vs high); the dependent variable is resting heart rate.
b.
The independent variable is radiation treatment on throat cancer patients (after a low dose and then a high dose treatment); the dependent variable is white blood cell count.
c.
The IV is infant birth weight (low vs normal birth weight); the DV is number of days absent from school in first grade.
d.
The IV is gender (male vs female); the DV is compliance vs noncompliance with a medication regimen.
e.
The independent variable is married status (single vs divorced vs married); the dependent variable is happiness measured on a scale from 1 to 50
7.
For which of the following situations is the dependent groups t-test appropriate (if not appropriate, why?)
a.
The IV is presence or absence of conversation directed to comatose patients (same patients with and without conversation); the DV is the patients’ intracranial pressure.
b.
The IV is birth type (home vs hospital); the DV is perceived functional ability of the patient 48 hours after surgery.
c.
The IV is time since incarceration (1 months vs 3 months vs 6 months); the DV is body .
152 pts totalFor Questions 1-2 use the 7 step process to answe.docxsandibabcock
152 pts total
For Questions 1-2 use the 7 step process to answer. Refer to slides if you are unsure of the 7 step process.
PLEASE DON’T OMIT ANY PART OF THE PROCESS!!! (40 pts) THIS IS DONE IN SPSS USING BREAST CANCER AND OBESITY DATASET
Dataset Background – PLEASE READ:
Obesity is very common in American society and is a risk factor for breast cancer for postmenopausal women.
One mechanism explaining why obesity is a risk factor is that it may raise estrogen levels in women.
In particular, one type of estrogen, serum estradiol, is a strong risk factor for breast cancer.
To better assess this relationship, researchers studied a group of 200 postmenopausal women.
The SPSS file is entitled,
Breast Cancer and Obesity
.
Adiposity was measured in two different ways:
(a) by body mass index (BMI) = weight (kg) / height(m
2
) and also (b) by waist-hip ratio (WHR) = waist circumference/hip circumference.
BMI is a measure of overall adiposity, whereas WHR is a measure of abdominal adiposity.
In addition, a complete hormonal profile was obtained, including serum estradiol.
Finally, other breast-cancer risk factors were also assessed among these women, including ethnicity, parity, age at first birth, and age at menarche.
Codebook
Variable
Column
Code
Label
Values (if categorical)
Id
1
Identification number
ES_1
2
Serum Estradiol
ETHNIC
3
Ethnicity
1 = African-American, 0 = Caucasian
NUMCHILD
4
Parity, number of children
AGEFBO
5
Age at 1
st
birth
(missing a response if never had a child)
ANYKIDS
6
Gave birth to any children?
1 = Yes, 0 = No
AGEMENAR
7
Age at menarche
BMI
8
Body Mass Index
WHR
9
Waist-hip ratio
**Missing responses are left blank
ALSO THE FOLLOWING CONTINUOUS VARIABLES HAVE BEEN CATEGORIZED!!
BMI has been categorized, bmi_cat, :
normal BMI (<25) and abnormal BMI (25 or greater).
Menarche has been categorized, menarche_cat, two categories - 9-12 and 13-16
WHR has also been categorized, whr_category, 3 categories - 0-.69, .7-.79, and .8 and greater
1.
Is there a statistically significant difference in mean estradiol between African Americans and Caucasions?
a.
Provide a visual aid depicting the mean differences between the two groups.
2.
Is there a statistically significant difference in mean estradiol between ethnicity status depending on BMI_CAT (using the categorized variable, so normal or abnormal groups)?
3.
Please use the rock climbing performance dataset.
Here is the description:
This is research done by a senior at PSU-Berks.
He was interested in determining the effects of imagery on rock climbing performance.
He chose 20 experienced rock climbers.
With randomization on the order, he had them climb with no imagery on a rock wall and then had them climb with imagery (on a different but same difficulty wall).
Ignoring issues of confounding, can we conclude that imagery decreases rock wall climb time (in seconds)?
(15pts)
a.
What statistical test should be use.
14 + 8 Answers and calculations as basic statistics student would ex.docxjeanettehully
14 + 8 Answers and calculations as basic statistics student would explain put into both an MS Excel spreadsheet and copied into MS Word doc format. Due by 7pm 2/2/14.
Week 2 Assignment
A. What is the probability of rolling a four in the gambling dice game of craps (given two six sided dice)?
B. What is the probability that a player can roll a four 3 times in a row (assume that rolling the dice each time does not affect the outcome of the next roll)?
Population A and Population B both have a mean height of 70.0 inches with an SD of 6.0. A random sample of 30 people is picked from population A, and random sample of 50 people is selected from Population B. Which sample mean will probably yield a more accurate estimate of its population mean? Why?
3. Suppose we obtained data on vein size after application of a nitroglycerin ointment in a sample of 50 patients. The mean vein size is found to be 7.8mm with an SD of 2.1. Using a
t
distribution table, what are the confidence limits for a 95% confidence interval? For a 99% confidence interval?
4. In a pilot study evaluating the use of a new drug to lower resting heart rates (HR) of patients, the following data was recorded:
Subject #
Resting HR
001
72
002
88
003
71
004
87
005
64
006
77
007
79
008
59
009
66
010
68
011
78
012
89
013
91
014
81
015
77
016
75
017
69
Given that the average resting HR of the general population for this study is 72, use StatCrunch to perform the appropriate
t
test. What is the value of
t
? Using an alpha of 0.05, is the
t
statistic significant? Why? What are the confidence limits for a 95% confidence interval here and what do they mean for this patient group? Copy and Paste your work from StatCrunch into your Word document submission.
5. Write one or two sentences that could be used to report the results obtained for the t-test in Exercise 4.
6. For which of the following situations is the
independent
groups t-test appropriate (if inappropriate, why?):
a. The independent variable is infant birth weight at one week (normal vs high); the dependent variable is resting heart rate.
b. The independent variable is radiation treatment on throat cancer patients (after a low dose and then a high dose treatment); the dependent variable is white blood cell count.
c. The IV is infant birth weight (low vs normal birth weight); the DV is number of days absent from school in first grade.
d. The IV is gender (male vs female); the DV is compliance vs noncompliance with a medication regimen.
e. The independent variable is married status (single vs divorced vs married); the dependent variable is happiness measured on a scale from 1 to 50
7. For which of the following situations is the
dependent
groups t-test appropriate (if not appropriate, why?)
a. The IV is presence or absence of conversation directed to comato.
Categorical Data and Statistical AnalysisMichael770443
In this presentation, we will introduce two tests and hypothesis testing based on it, and different non-parametric methods such as the Kolmogorov-Smirnov test, the Wilcoxon’s signed-rank test, the Mann-Whitney U test, and the Kruskal-Wallis test.
Directions The purpose of Project 8 is to prepare you for the final.docxeve2xjazwa
Directions: The purpose of Project 8 is to prepare you for the final, comprehensive exam and is set up EXACTLY the same. Questions 1 and 2 are not graded in this exercise, but are on the final. Be sure to answer them still so you can receive feedback. Once done with these, move into the calculation questions.
Be advised that you will need to decide which type of test to use in most of the problems. Please write out all pertinent information for each of the 4 steps of hypothesis testing. For the calculations, you only need to provide the values of all statistics for that test. There is no need to show work.
List the four Steps of the Hypothesis test:
Step 1 –
Step 2 –
Step 3 –
Step 4 –
This semester we have discussed the following statistical analyses.
Z-test
One-Sample
t
-test
Independent Groups
t
-test
Repeated Measures
t
-test
One-Way ANOVA
Repeated Measures ANOVA
Correlation
When do you use them? Please type your answer in the Test Used column.
ơ is given
µ is given
Groups Compared
Test Used
No
No
Looks at the same group at 2 different times or across two different conditions
Yes
Yes
Sample against population
Examines the degree to which two variables relate to one another
No
No
Looks at the same group at 2 or more times or across 2 or more conditions
No
No
Examines mean differences between two different groups
No
Yes
Sample against population
No
No
Examines mean differences between 2 or more groups
1. A researcher for a cereal company wanted to demonstrate the health benefits of eating oatmeal. A sample of 9 volunteers was obtained and each participant ate a fixed diet without any oatmeal for 30 days. At the end of the 30-day period, cholesterol was measured for each individual. Then the participants began a second 30-day period in which they repeated exactly the same diet except that they added 2 cups of oatmeal each day. After the second 30-day period, cholesterol levels were measured again and the researcher recorded the difference between the two scores for each participant. For this sample, cholesterol scores average M = 16 points lower with the oatmeal diet with SS = 538 for the difference scores.
10 points
·
Are the data sufficient to indicate a significant change in cholesterol level? Use a two-tailed test with α = .01.
·
Compute r
2
to measure the size of the treatment effect.
2. One possible explanation for why some birds migrate and others maintain year round residency in a single location is intelligence. Specifically, birds with smaller brain, relative to their body size, are not simply smart enough to find food during the winter and must migrate to warmer climates where food is easily available. Birds with bigger brains, on the other hand, are more creative and can find food even when the weather turns harsh. Following are hypothetical data similar to the actual results. The numbers represent relative brain size for the individual birds in each sample.
10 points
Non-Migrating
S.
WEEK 7 – EXERCISES Enter your answers in the spaces pr.docxwendolynhalbert
WEEK 7 – EXERCISES
Enter your answers in the spaces provided. Save the file using your last name as the beginning of the file name (e.g., ruf_week6_exercises) and submit via “Assignments.” When appropriate,
show your work
. You can do the work by hand, scan/take a digital picture, and attach that file with your work.
A sports researcher gave a standard written test of eating habits to 12 randomly selected professionals, four each from baseball, football, and basketball. The results were as follows:
Eating Habits Scores
Baseball Players
Football Players
Basketball Players
34
27
35
18
28
44
21
67
47
65
42
61
Is there a difference in eating habits among professionals in the three sports? (Use the .05 significance level.)
a.
Use the five steps of hypothesis testing.
b.
Sketch the distribution involved.
c.
Determine effect size.
2.
To study the effectiveness of treatments for insomnia, a sleep researcher conducted a study with 12 participants.
Four participants were instructed to count sheep (Sheep Condition), four were told to concentrate on their breathing (Breathing Condition), and four were not given any special instructions. Over the next few days, measures were taken of how many minutes it took each participant to fall asleep. The average times for the participants in the Sheep Condition were 14, 28, 27, and 31; for those in the Breathing Condition, 25, 22, 17, and 14; and for those in the control condition, 45, 33, 30, and 41.
Do these results suggest that the different techniques have different effects?
(Use the .05 significance level.)
a.
Use the five steps of hypothesis testing.
b.
Sketch the distribution involved.
c.
Figure the effect size of the study.
d.
Explain your findings (including the logic of comparing within-group to between-group population variance estimates, how each of these is figured, and the
F
distribution).
High school juniors planning to attend college were randomly assigned to view one of four videos about a particular college, each differing according to what aspect of college life was emphasized: athletics, social life, scholarship, or artistic/cultural opportunities. After viewing the videos, the students took a test measuring their desire to attend this college. The results were as follows:
Desire to Attend this College
Athletics
Social Life
Scholarship
Art/Cultural
68
89
74
76
56
78
82
71
69
81
79
69
70
77
80
65
Do these results suggest that the type of activity emphasized in a college film affects desire to attend that college? (Use the .01 significance level.)
a.
Use the five steps of hypothesis testing.
b.
Sketch the distribution involved.
c.
Figure the effect size of the study.
d.
Explain the logic of what you have done to a person who is unfamiliar with the analysis of variance.
A team of psychologists designed a study in which 12 psychiatric patients diagnosed as having generalized anxiety disorder were randomly assigned to one of three new types of th.
Objectives:
Generate of t-test.
Learn about the assumptions of t-test.
Calculate t-test.
Construct the confidence interval for the population mean.
Recall steps for z test:
1. State null and alternative hypothesis.
2. Determine the level of significance
3. Apply test statistics.
4. Identify critical region/ p-value.
5. Interpret the result.
Need of t test:
When population standard deviation is known or sample is large enough that sample population deviation will represent population’s standard deviation. We can used z-test or standard normal distribution.
What do we do if population standard deviation is not known and the sample size is less than 30?
T distribution:
Also known as student’s test.
Identified by William Goset.
Similarities between z and t distribution:
Bell Shaped
It is symmetric around the mean.
Mean, median, and the mode are plot at zero which is at the center of bell shape curve.
The curve does not touch the x-axis.
Differences between z and t distribution:
T- distribution is associated with degrees of freedom.
Degree of freedom is (n-1) and is associated with sample size.
Degree of freedom are the number of values that are free to vary after a sample statistics has been computed.
It tells the research which t curve to use.
With the increase in sample size, the t distribution approaches the standard normal distribution.
When to use t test:
Standard deviation of population is unknown. Use the s (standard deviation).
if sample size less than 30 so normal distribution should be ensured.
Steps for hypothesis testing for t test:
State null and alternative hypothesis.
Determine the level of significance
Apply test statistics.
Identify critical region/ p-value.
Interpret the result.
Chapter 11 Chi-Square Tests and ANOVA 359 Chapter .docxbartholomeocoombs
Chapter 11: Chi-Square Tests and ANOVA
359
Chapter 11: Chi-Square and ANOVA Tests
This chapter presents material on three more hypothesis tests. One is used to determine
significant relationship between two qualitative variables, the second is used to determine
if the sample data has a particular distribution, and the last is used to determine
significant relationships between means of 3 or more samples.
Section 11.1: Chi-Square Test for Independence
Remember, qualitative data is where you collect data on individuals that are categories or
names. Then you would count how many of the individuals had particular qualities. An
example is that there is a theory that there is a relationship between breastfeeding and
autism. To determine if there is a relationship, researchers could collect the time period
that a mother breastfed her child and if that child was diagnosed with autism. Then you
would have a table containing this information. Now you want to know if each cell is
independent of each other cell. Remember, independence says that one event does not
affect another event. Here it means that having autism is independent of being breastfed.
What you really want is to see if they are not independent. In other words, does one
affect the other? If you were to do a hypothesis test, this is your alternative hypothesis
and the null hypothesis is that they are independent. There is a hypothesis test for this
and it is called the Chi-Square Test for Independence. Technically it should be called
the Chi-Square Test for Dependence, but for historical reasons it is known as the test for
independence. Just as with previous hypothesis tests, all the steps are the same except for
the assumptions and the test statistic.
Hypothesis Test for Chi-Square Test
1. State the null and alternative hypotheses and the level of significance
Ho : the two variables are independent (this means that the one variable is not
affected by the other)
HA : the two variables are dependent (this means that the one variable is affected
by the other)
Also, state your α level here.
2. State and check the assumptions for the hypothesis test
a. A random sample is taken.
b. Expected frequencies for each cell are greater than or equal to 5 (The expected
frequencies, E, will be calculated later, and this assumption means E ≥ 5 ).
3. Find the test statistic and p-value
Finding the test statistic involves several steps. First the data is collected and
counted, and then it is organized into a table (in a table each entry is called a cell).
These values are known as the observed frequencies, which the symbol for an
observed frequency is O. Each table is made up of rows and columns. Then each
row is totaled to give a row total and each column is totaled to give a column
total.
Chapter 11: Chi-Squared Tests and ANOVA
360
The null hypothesis is that the variables are independent. Using the multiplication.
Use the 5-step procedure for all problemsEach of the 5 steps.docxdickonsondorris
Use the 5-step procedure for all problems
Each of the 5 steps is worth the following point values: Step 1 (8 points), Step 2 (2 points), Step 3 (5 points), Step 4 (5 points), and Step 5 (5 points).
1. The warden of a state correctional institution is concerned about the stress levels of the correctional officers. Specifically, he wants to see if work related stress decreases based upon years of experience on the job. Random samples of officers who have worked at the institution for more than ten years and officers who have worked 10 years or less were administered a scale designed specifically to measure stress among correctional workers. The scale is scored on a 1 to 4 scale (the higher the number, the greater the stress). The results are contained in the data file, “CO Stress.” Test the hypothesis that the officers that there is no difference in stress between those who have been there more than 10 years and the officers who have been there 10 years or less.
Step 1.
H0: µ1 = µ2
H1: µ1 ≠ µ2
Step 2.
α = .05
Step 3.
Independent Samples T-test, Non-directional
Step 4.
Group Statistics
CO's Years on the Job
N
Mean
Std. Deviation
Std. Error Mean
Stress Level Score
10 years or less
21
2.1429
.79282
.17301
More than 10 years
21
2.4762
.92839
.20259
Independent Samples Test
Levene's Test for Equality of Variances
t-test for Equality of Means
F
Sig.
t
df
Sig. (2-tailed)
Mean Difference
Std. Error Difference
95% Confidence Interval of the Difference
Lower
Upper
Stress Level Score
Equal variances assumed
1.725
.197
-1.251
40
.218
-.33333
.26641
-.87177
.20510
Equal variances not assumed
-1.251
39.043
.218
-.33333
.26641
-.87218
.20552
Step 5.
This is not statistically significant because p=.218. T (40) = -1.251, p > .05.
Therefore we fail to reject H0
2.
A study is being done on the change in anxiety that occurs throughout a graduate statistics class. A group of 20 students were administered an anxiety score before the first lesson of their class and right after the last unit. Higher scores indicate greater anxiety. Using the data below, test the hypothesis that there is no difference in anxiety scores.
Student
First Lesson
Last Lesson
1
1
2
2
2
4
3
1
6
4
3
2
5
4
5
6
7
9
7
6
6
8
4
3
9
4
7
10
1
1
11
2
1
12
3
4
13
4
9
14
6
7
15
7
8
16
2
2
17
2
7
18
3
3
19
1
4
20
6
4
Step 1.
H0: µ1 = µ2
H1: µ1 ≠ µ2
Step 2.
α = .05
Step 3.
Dependent or Paired Samples T-test, Non Directional
Step 4.
Paired Samples Statistics
Mean
N
Std. Deviation
Std. Error Mean
Pair 1
FirstLesson
3.4500
20
2.03845
.45581
LastLesson
4.7000
20
2.55672
.57170
Paired Samples Test
Paired Differences
t
df
Sig. (2-tailed)
Mean
Std. Deviation
Std. Error Mean
95% Confidence Interval of the Difference
Lower
Upper
Pair 1
FirstLesson – LastLesson
-1.25000
2.07428
.46382
-2.22079
-.27921
-2.695
19
.014
Step 5.
t(19) = -2.695, p = .014, p < .05. We reject H0. There was a difference in anxiety between the first lesson and th ...
I am Samson H. I am a Multiple Linear Regression Homework Expert at statisticshomeworkhelper.com. I hold a Master's in Statistics, from Michigan, USA. I have been helping students with their homework for the past 12 years. I solved homework related to Multiple Linear Regression.
Visit statisticshomeworkhelper.com or email info@statisticshomeworkhelper.com.You can also call on +1 678 648 4277 for any assistance with Multiple Linear Regression Homework Help.
Part 1 of 16 - Question 1 of 231.0 PointsThe data pres.docxherbertwilson5999
Part 1 of 16 -
Question 1 of 23
1.0 Points
The data presented in the table below resulted from an experiment in which seeds of 5 different types were planted and the number of seeds that germinated within 5 weeks after planting was recorded for each seed type. At the .01 level of significance, is the proportion of seeds that germinate dependent on the seed type?
Seed Type
Observed Frequencies
Germinated
Failed to Germinate
1
31
7
2
57
33
3
87
60
4
52
44
5
10
19
A.Yes, because the test value 16.86 is greater than the critical value of 13.28
B.Yes, because the test value 16.86 is less than the critical value of 14.86
C.No, because the test value 16.86 is greater than the critical value of 13.28
D.No, because the test value 13.28 is less than the critical value of 16.86
Reset Selection
Question 2 of 23
1.0 Points
The chi-square goodness-of-fit test can be used to test for:
A.significance of sample statistics
B.normality
C.difference between population variances
D.difference between population means
Reset Selection
Part 2 of 16 -
Question 3 of 23
1.0 Points
The marketing manager of a large supermarket chain would like to use shelf space to predict the sales of pet food. For a random sample of 12 similar stores, she gathered the following information regarding the shelf space, in feet, devoted to pet food and the weekly sales in hundreds of dollars.
Store
1
2
3
4
5
6
Shelf Space
5
5
5
10
10
10
Weekly Sales
1.6
2.2
1.4
1.9
2.4
2.6
Store
7
8
9
10
11
12
Shelf Space
15
15
15
20
20
20
Weekly Sales
2.3
2.7
2.8
2.6
2.9
3.1
What is the estimated regression equation?
A. = 1.45 + 0.074x
B. = 2.63 - 0.174x
C. = 2.63 + 0.724x
D. = 1.45 + 0.724x
Reset Selection
Question 4 of 23
1.0 Points
A single variable X can explain a large percentage of the variation in some other variable Y when the two variables are:
A.highly correlated
B.directly related
C.inversely related
D.mutually exclusive
Reset Selection
Question 5 of 23
1.0 Points
Data for a sample of 25 apartments in a particular neighborhood are provided in the worksheet Apartments in the Excel workbook Apartments.xlsx. Using that data, find the estimated regression equation which can be used to estimate the monthly rent for apartments in this neighborhood using size as the predictor variable.
Apartments.xlsx
A. 177.12 + 1.065(size)
B.177.12 + 0.8500(size)
C.1.065 + 177.12(size)
D.197.12 + 2.065(size)
Reset Selection
Part 3 of 16 -
Question 6 of 23
1.0 Points
A pharmaceutical company is testing the effectiveness of a new drug for lowering cholesterol. As part of this trial, they wish to determine whether there is a difference between the effectiveness for women and for men. Assume α = 0.05. What is the test value?
Women
Men
Sample size
50
80
Mean effect
7
6.95
Sample variance
3
4
A.t = 3.252
B.t = 0.151
C.z = 0.081
D.z = 0.455
Reset Selection
Question 7 of 23
.
Dear students get fully solved assignments
Send your semester & Specialization name to our mail id :
help.mbaassignments@gmail.com
or
call us at : 08263069601
This quiz consists of 20 questions most appear to be similar but now.docxamit657720
This quiz consists of 20 questions most appear to be similar but now really. I ned someone who is familiar with bio-statistics and math. The due date is tomorrow 4 pm PST. or (16:00). Please if you accept handshake you must do the work not get from previous papers or tell me you had emergency an hour before its due. This is important to me.
attached is the file just in case you need it in word format. Thank you in advance.
1.
The standard deviation of the diameter at breast height, or DBH, of the slash pine tree is less than one inch. Identify the Type I error. (Points : 1)
[removed] Fail to support the claim σ < 1 when σ < 1 is true.
[removed] Support the claim μ < 1 when μ = 1 is true.
[removed]
Support the claim σ < 1 when σ = 1 is true.
[removed] Fail to support the claim μ < 1 when μ < 1 is true.
1a. The EPA claims that fluoride in children's drinking water should be at a mean level of less than 1.2 ppm, or parts per million, to reduce the number of dental cavities. Identify the Type I error. (Points : 1)
[removed] Fail to support the claim σ < 1.2 when σ < 1.2 is true.
[removed] Support the claim μ < 1.2 when μ = 1.2 is true.
[removed] Support the claim σ < 1.2 when σ = 1.2 is true.
[removed] Fail to support the claim μ < 1.2 when μ < 1.2 is true.
2.
Biologists are investigating if their efforts to prevent erosion on the bank of a stream have been statistically significant. For this stream, a narrow channel width is a good indicator that erosion is not occurring. Test the claim that the mean width of ten locations within the stream is greater than 3.7 meters. Assume that a simple random sample has been taken, the population standard deviation is not known, and the population is normally distributed. Use the following sample data:
3.3 3.3 3.5 4.9 3.5 4.1 4.1 5 7.3 6.2
What is the P-value associated with your test statistic? Report your answer with three decimals, e.g., .987 (Points : 1)
2a. Medical researchers studying two therapies for treating patients infected with Hepatitis C found the following data. Assume a .05 significance level for testing the claim that the proportions are not equal. Also, assume the two simple random samples are independent and that the conditions np ≥ 5 and nq ≥ 5 are satisfied.
Therapy 1
Therapy 2
Number of patients
39
47
Eliminated Hepatitis
20
13
C infection
Construct a 95% confidence interval estimate of the odds ratio of the odds for having Hepatitis C after Therapy 1 to the odds for having Hepatitis C after Therapy 2. Give your answer with two decimals, e.g., (12.34,56.78) (Points : 0.5)
[removed]
3. Researchers studying sleep loss followed the length of sleep, in hours, of 10 individuals with insomnia before and after cognitive behavioral therapy (CBT). Assume a .05 significance level to test the claim that there is a difference between the length of sleep of individuals before and after CBT. Also, assume the data consist of matched pair ...
WEEK 5 – EXERCISES Enter your answers in the spaces pr.docxpaynetawnya
WEEK 5 – EXERCISES
Enter your answers in the spaces provided. Save the file using your last name as the beginning of the file name (e.g., ruf_week5_exercises) and submit via “Assignments.” When appropriate,
show your work
. You can do the work by hand, scan/take a digital picture, and attach that file with your work.
For the following question(s): A school counselor tests the level of depression in fourth graders in a particular class of 20 students. The counselor wants to know whether the kind of students in this class differs from that of fourth graders in general at her school. On the test, a score of 10 indicates severe depression, while a score of 0 indicates no depression. From reports, she is able to find out about past testing. Fourth graders at her school usually score 5 on the scale, but the variation is not known. Her sample of 20 fifth graders has a mean depression score of 4.4. Use the .01 level of significance.
1.
The counselor calculates the unbiased estimate of the population’s variance to be 15. What is the variance of the distribution of means?
A)
15/20 = 0.75
B)
15/19 = 0.79
C)
15
2
/20 = 11.25
D)
15
2
/19 = 11.84
2.
Suppose the counselor tested the null hypothesis that fourth graders in this class were
less
depressed than those at the school generally. She figures her
t
score to be
-
.20. What decision should she make regarding the null hypothesis?
A)
Reject it
B)
Fail to reject it
C)
Postpone any decisions until a more conclusive study could be conducted
D)
There is not enough information given to make a decision
3.
Suppose the standard deviation she figures (the square root of the unbiased estimate of the population variance) is .85. What is the effect size?
A)
5/.85 = 5.88
B)
.85/5 = .17
C)
(5
-
4.4)/.85 = .71
D)
.85/(5
-
4.4) = 1.42
For the following question(s): Professor Juarez thinks the students in her statistics class this term are more creative than most students at this university. A previous study found that students at this university had a mean score of 35 on a standard creativity test. Professor Juarez finds that her class scores an average of 40 on this scale, with an estimated population standard deviation of 7. The standard deviation of the distribution of means comes out to 1.63.
4.
What is the
t
score?
A)
(40
-
35)/7 = .71
B)
(40
-
35)/1.63 = 3.07
C)
(40
-
35)/7
2
= 5/49 = .10
D)
(40
-
35)/1.63
2
= 5/2.66 = 1.88
5.
What effect size did Professor Juarez find?
A)
(40
-
35)/7 = .71
B)
(40
-
35)/1.63 = 3.07
C)
(40
-
35)/7
2
= 5/49 = .10
D)
(40
-
35)/1.63
2
= 5/2.66 = 1.88
6.
If Professor Juarez had 30 students in her class, and she wanted to test her hypothesis using the 5% level of significance, what cutoff
t
score would she use? (You should be able to figure this out without a table because only one answer is in the correct region.)
A)
304.11
B)
1.699.
About CORE:
The Culture of Research and Education (C.O.R.E.) webinar series is spearheaded by Dr. Bernice B. Rumala, CORE Chair & Program Director of the Ph.D. in Health Sciences program in collaboration with leaders and faculty across all academic programs.
This innovative and wide-ranging series is designed to provide continuing education, skills-building techniques, and tools for academic and professional development. These sessions will provide a unique chance to build your professional development toolkit through presentations, discussions, and workshops with Trident’s world-class faculty.
For further information about CORE or to present, you may contact Dr. Bernice B. Rumala at Bernice.rumala@trident.edu
PSY520 – Module 6Answer SheetSubmit your answers in the boxe.docxwoodruffeloisa
PSY520 – Module 6
Answer Sheet
Submit your answers in the boxes provided. No credit will be given for responses not found in the correct answer area.
Chapter 16:
16.9 Given the aggression scores below for Outcome A of the sleep deprivation experiment, verify that, as suggested earlier, these mean differences shouldn’t be taken seriously by testing the null hypothesis at the .05 level of significance. Use the computation formulas for the various sums of squares and summarize results with an ANOVA table.
Hours of Sleep Deprivation
Zero
Twenty-Four
Forty-Eight
3
4
2
5
8
4
7
6
6
Group Mean:
5
6
4
Grand Mean: 5
Question:
Steps:
Calculations or Logic:
Answer:
Use the computation formulas for the various sums of squares and summarize results with an ANOVA table.
What is the research hypothesis?
What is the null hypothesis?
What are the degrees of freedom?
What is the calculated ?
What is the F?
Complete the ANOVA table:
Source
SS
df
MS
F Ratio
Treatment (between)
Error (within)
Total
16.10 Another psychologist conducts a sleep deprivation experiment. For reasons beyond his control, unequal numbers of subjects occupy the different groups. (Therefore, when calculating in SS between and SS within , you must adjust the denominator term, n , to reflect the unequal numbers of subjects in the group totals.)
Hours of Sleep Deprivation
Zero
Twenty-Four
Forty-Eight
1
4
7
3
7
12
6
5
10
2
9
1
Summarize the results with an ANOVA table. You need not do a step-by-step hypothesis test procedure:
Source
SS
df
MS
F
Treatment (between)
Error (within)
Total
If hand calculating, include formulas and calculations below. If using SPSS, include a picture, screenshot, or cut/paste of the output below.
Question:
Calculations or Logic:
Answer:
Are the results statistically significant? Yes or no?
If appropriate, estimate the effect size with η2
If appropriate, use Tukey’s HSD test (with for the sample size, n) to identify pairs of means that contribute to the significant F, given that , and
What is the HSD?
Which pairs are significant at the .05 level?
If appropriate, estimate effect sizes with Cohen’s d.
Indicate how all of the above results would be reported in the literature, given sample standard deviations of s0= 2.07, s24 =1.53, and s48=2.08.
16.12 For some experiment, imagine four possible outcomes, as described in the following ANOVA table.
A.
Source
SS
df
MS
F
Between
900
3
300
3
Within
8000
80
100
Total
8900
83
B.
Source
SS
df
MS
F
Between
1500
3
500
5
Within
8000
80
100
Total
9500
83
C.
Source
SS
df
MS
F
Between
300
3
100
1
Within
8000
80
100
Total
8300
83
D.
Source
SS
df
MS
F
Between
300
3
100
1
Within
400
4
100
Total
700
7
Question:
Calculations or Logic:
Answer:
How many groups are in Outcome D?
Assuming groups of equal size, what’s t ...
TitleABC123 Version X1Week 4 Practice Worksheet.docxedwardmarivel
Title
ABC/123 Version X
1
Week 4 Practice Worksheet
PSY/315 Version 6
1
University of Phoenix MaterialWeek 4 Practice Worksheet
Prepare a written response to the following questions.
Chapters 9 &11
1. Two boats, the Prada (Italy) and the Oracle (USA), are competing for a spot in the upcoming America’s Cup race. They race over a part of the course several times. The sample times in minutes for the Prada were: 12.9, 12.5, 11.0, 13.3, 11.2, 11.4, 11.6, 12.3, 14.2, and 11.3. The sample times in minutes for the Oracle were: 14.1, 14.1, 14.2, 17.4, 15.8, 16.7, 16.1, 13.3, 13.4, 13.6, 10.8, and 19.0. For data analysis, the appropriate test is the t-Test: Two-Sample Assuming Unequal Variances.
The next table shows the results of this independent t-test. At the .05 significance level, can we conclude that there is a difference in their mean times? Explain these results to a person who knows about the t test for a single sample but is unfamiliar with the t test for independent means.
Hypothesis Test: Independent Groups (t-test, unequal variance)
Prada
Oracle
12.170
14.875
mean
1.056
2.208
std. dev.
10
12
n
16
df
-2.7050
difference (Prada - Oracle)
0.7196
standard error of difference
0
hypothesized difference
-3.76
t
.0017
p-value (two-tailed)
-4.2304
confidence interval 95.% lower
-1.1796
confidence interval 95.% upper
1.5254
margin of error
2. The Willow Run Outlet Mall has two Haggar Outlet Stores, one located on Peach Street and the other on Plum Street. The two stores are laid out differently, but both store managers claim their layout maximizes the amounts customers will purchase on impulse. A sample of ten customers at the Peach Street store revealed they spent the following amounts more than planned: $17.58, $19.73, $12.61, $17.79, $16.22, $15.82, $15.40, $15.86, $11.82, $15.85. A sample of fourteen customers at the Plum Street store revealed they spent the following amounts more than they planned when they entered the store: $18.19, $20.22, $17.38, $17.96, $23.92, $15.87, $16.47, $15.96, $16.79, $16.74, $21.40, $20.57, $19.79, $14.83. For Data Analysis, a t-Test: Two-Sample Assuming Unequal Variances was used.
At the .01 significance level is there a difference in the mean amount purchased on an impulse at the two stores? Explain these results to a person who knows about the t test for a single sample but is unfamiliar with the t test for independent means.
Hypothesis Test: Independent Groups (t-test, unequal variance)
Peach Street
Plum Street
15.8680
18.2921
mean
2.3306
2.5527
std. dev.
10
14
n
20
df
-2.42414
difference (Peach Street - Plum Street)
1.00431
standard error of difference
0
hypothesized difference
-2.41
t
.0255
p-value (two-tailed)
-5.28173
confidence interval 99.% lower
0.43345
confidence interval 99.% upper
2.85759
margin o ...
My significant event was losing my father at an early age. So if y.docxrosemarybdodson23141
My significant event was losing my father at an early age. So if you are good at psychology describe how that can affect a young woman without a dad at an early age.
Assignment 1.1: Significant Event Draft
Due Week 4 Note: Students will turn in this assignment twice: first as a draft (Week 4 Assignment) and then as a final paper (Week 8 Assignment). Students will submit first draft of the assignment and then submit the final draft after receiving feedback from the professor and making the recommended changes. They will be graded separately for each submission of the assignment.
Select a significant event (either positive or negative) that occurred before you reached adulthood and that has had a life-shaping effect on your life. In this assignment, you will use what you’ve learned in Weeks 1 thru 4 of this course and base your paper on your readings, along with information from library research, to discuss psychological aspects of your event.
Write a two to three (2-3) page paper in which you:
1.Briefly describe your significant event (one to two [1-2] sentences).
2.Describe your event in terms of at least two (2) different perspectives in psychology (e.g., behavioral, cognitive, psychodynamic, cultural/social, etc.)
3.Determine what learning (e.g., classical, operant, etc.) may have resulted from your event, or arisen because of your event.
4.Discuss why the memory of the event you described may or may not be completely accurate.
5.Use at least two (2) quality academic resources in this assignment. Note: One of these resources may be your textbook. Articles from professional journals are certainly a high quality resource. Magazine and newspaper articles are also accepted for this assignment. Articles published on the Internet may also be suitable, if they originate with credible persons or organizations. Please note that articles from Wikipedia, ask.com, and the like are not suitable.
Your assignment must follow these formatting requirements:
•Be typed, double spaced, using Times New Roman font (size 12), with one-inch margins on all sides; references must follow APA format. Check with your professor for any additional instructions.
•Include a cover page containing the title of the assignment, the student’s name, the professor’s name, the course title, and the date. The cover page and the reference page are not included in the required page length.
The specific course learning outcomes associated with this assignment are:
•Relate psychological concepts to real-world situations.
•Describe the major theories of learning, memory, cognition, consciousness, development, and social psychology.
•Use technology and information resources to research issues in psychology.
Part 1 of 16 -
Question 1 of 23
1.0 Points
A company operates four machines during three shifts each day. From production records, the data in the table below were collected. At the .05 level of significance test to determine if the number of breakdowns is independent of the sh.
Assignment 2 Tests of SignificanceThroughout this assignment yo.docxrock73
Assignment 2: Tests of Significance
Throughout this assignment you will review mock studies. You will needs to follow the directions outlined in the section using SPSS and decide whether there is significance between the variables. You will need to list the five steps of hypothesis testing (as covered in the lesson for Week 6) to see how every question should be formatted. You will complete all of the problems. Be sure to cut and past the appropriate test result boxes from SPSS under each problem and explain what you will do with your research hypotheses. All calculations should be coming from your SPSS. You will need to submit the SPSS output file to get credit for this assignment. This file will save as a .spv file and will need to be in a single file. In other words, you are not allowed to submit more than one output file for this assignment.
The five steps of hypothesis testing when using SPSS are as follows:
1. State your research hypothesis (H1) and null hypothesis (H0).
2. Identify your confidence interval (.05 or .01)
3. Conduct your analysis using SPSS.
4. Look for the valid score for comparison. This score is usually under ‘Sig 2-tail’ or ‘Sig. 2’. We will call this “p”.
5. Compare the two and apply the following rule:
a. If “p” is < or = confidence interval, than you reject the null.
Be sure to explain to the reader what this means in regards to your study. (Ex: will you recommend counseling services?)
* Be sure that your answers are clearly distinguishable. Perhaps you bold your font or use a different color.
ASSIGNMENT 2(200) WORD MINIUM
1. They allow us to see if our relationship is "statistically significant". (Remember that this only shows us that there is or is not a relationship but does NOT show us if it is big, small, or in-between.)
2. It let's us know if our findings can be generalized to the population which our sample was selected from and represents.
This week you will decide which test of significance you will use for your project. For this class your choices for tests will include one of the following:
· Chi-square
· t Test
· ANOVA
We will be using a process for hypothesis testing which outlines five steps researchers can follow to complete this process:
1. Write your research hypothesis (H1) and your null hypothesis (H0).
2. Identify and record your confidence interval. These are usually .05 (95%) or .01 (99%).
3. Complete the test using SPSS.
4. Identify the number under Sig. (2-tail). This will be represented by "p".
5. Compare the numbers in steps 2 and 4 and apply the following rule:
1. If p < or = confidence interval, than you reject the null hypothesis
Determine what to do with your null and explain this to your reader. Be sure to go beyond the phrase "reject or fail to reject the null" and explain how that impacts your research and best describes the relationship between variables.
TEST QUESTIONS-NEED FULL ANSWERS
Q1
Make up and discuss research examples corresponding to the various ...
JW House FundraiserJourney Through the Enchanted Forest Ga.docxpauline234567
JW House Fundraiser
Journey Through the Enchanted Forest Gala
Silent Auction
Table Decor
Specialized cocktails for Event
Three Screens will be Placed for Optimum Viewing by all Attendees
New House Announcement
Happy 30th Birthday, JW!
Auction
Isle down Center Allows Fundraising Auctioneer to Engage Audience
Balloon
Drop
S’mores Sponsored by Largest Corporate Donor
Finish the Evening with Dancing & Beverages
Image Sources
http://springfields.net.au/media/catalog/category/_2_43.png
https://s-media-cache-ak0.pinimg.com/originals/36/fa/fe/36fafee1408521530bfa23368e604d55.jpg
https://www.thegirlcreative.com
http://ballooncity.com/wp-content/uploads/2013/09/danceFloorFlipPNG.png
https://t3.rbxcdn.com/ea203ae8bb1787569f5e375cde0a93b2
http://jwhouse.org/wp-content/uploads/2017/07/jwPortraitStory.jpg
http://royalcandycompany.com/wp/wp-content/uploads/2016/04/Smores-Buffet.jpg
https://lhueagleeye.files.wordpress.com/2015/11/crowd_20080505124150.jpg
www.socialtables.com
https://media-cdn.tripadvisor.com/media/photo-s/03/0d/c8/a7/santa-clara-convention.jpg
https://s3.amazonaws.com/assets.winspireme.com/LPP/Buy-it-Now-Logo.png
http://www.tastefultreats.com/media/catalog/product/cache/1/image/9df78eab33525d08d6e5fb8d27136e95/g/o/gourmet-kosher-sweets-gift-basket.png
https://vignette.wikia.nocookie.net/piratesonline/images/b/b3/Chest.png/revision/latest?cb=20090707201032
http://pngimg.com/uploads/question_mark/question_mark_PNG126.png
image1.tiff
image2.png
image3.tiff
image4.tiff
image5.tiff
image6.tiff
image7.tiff
image8.tiff
image9.tiff
image10.tiff
image11.tiff
image12.png
image13.tiff
image14.tiff
image15.tiff
image16.png
image17.tiff
image18.tiff
image19.tiff
image20.tiff
image21.tiff
image22.png
image23.tiff
image24.tiff
image25.tiff
image26.tiff
image27.tiff
image28.tiff
image29.tiff
1. INTRODUCTION. Begin by stating what you will discuss and explain why is important.
2. CRITICAL SUMMARY. Summarize the relevant views and the arguments that you believe are important.
Usually in a critical discussion it is not sufficient to merely summarize the author’s view. Your attention should be
focused on the author's development of the view--that is, on his arguments, in the broadest sense of the word.
3. CARE IN CITATIONS. Make sure you accurately state the position of the author and always include page
references for each quotation or attribution to her/him if applicable.
4. CRITICAL EVALUATION FROM A CHRISTIAN PERSPECTIVE. At least half of your paper must be devoted
to a critical evaluation of the views of the author you are discussing from the perspective of the Christian thesis that
a Christian call in business may prop-up the role of the markets.
5. CONSIDER POSSIBLE RESPONSES TO YOUR OBJECTIONS. Whenever you offer an objection to an
author's position, explicitly consider whether the author has said anythin.
More Related Content
Similar to Nonparametric Test Chi-Square Test for Independence Th.docx
Chapter 11 Chi-Square Tests and ANOVA 359 Chapter .docxbartholomeocoombs
Chapter 11: Chi-Square Tests and ANOVA
359
Chapter 11: Chi-Square and ANOVA Tests
This chapter presents material on three more hypothesis tests. One is used to determine
significant relationship between two qualitative variables, the second is used to determine
if the sample data has a particular distribution, and the last is used to determine
significant relationships between means of 3 or more samples.
Section 11.1: Chi-Square Test for Independence
Remember, qualitative data is where you collect data on individuals that are categories or
names. Then you would count how many of the individuals had particular qualities. An
example is that there is a theory that there is a relationship between breastfeeding and
autism. To determine if there is a relationship, researchers could collect the time period
that a mother breastfed her child and if that child was diagnosed with autism. Then you
would have a table containing this information. Now you want to know if each cell is
independent of each other cell. Remember, independence says that one event does not
affect another event. Here it means that having autism is independent of being breastfed.
What you really want is to see if they are not independent. In other words, does one
affect the other? If you were to do a hypothesis test, this is your alternative hypothesis
and the null hypothesis is that they are independent. There is a hypothesis test for this
and it is called the Chi-Square Test for Independence. Technically it should be called
the Chi-Square Test for Dependence, but for historical reasons it is known as the test for
independence. Just as with previous hypothesis tests, all the steps are the same except for
the assumptions and the test statistic.
Hypothesis Test for Chi-Square Test
1. State the null and alternative hypotheses and the level of significance
Ho : the two variables are independent (this means that the one variable is not
affected by the other)
HA : the two variables are dependent (this means that the one variable is affected
by the other)
Also, state your α level here.
2. State and check the assumptions for the hypothesis test
a. A random sample is taken.
b. Expected frequencies for each cell are greater than or equal to 5 (The expected
frequencies, E, will be calculated later, and this assumption means E ≥ 5 ).
3. Find the test statistic and p-value
Finding the test statistic involves several steps. First the data is collected and
counted, and then it is organized into a table (in a table each entry is called a cell).
These values are known as the observed frequencies, which the symbol for an
observed frequency is O. Each table is made up of rows and columns. Then each
row is totaled to give a row total and each column is totaled to give a column
total.
Chapter 11: Chi-Squared Tests and ANOVA
360
The null hypothesis is that the variables are independent. Using the multiplication.
Use the 5-step procedure for all problemsEach of the 5 steps.docxdickonsondorris
Use the 5-step procedure for all problems
Each of the 5 steps is worth the following point values: Step 1 (8 points), Step 2 (2 points), Step 3 (5 points), Step 4 (5 points), and Step 5 (5 points).
1. The warden of a state correctional institution is concerned about the stress levels of the correctional officers. Specifically, he wants to see if work related stress decreases based upon years of experience on the job. Random samples of officers who have worked at the institution for more than ten years and officers who have worked 10 years or less were administered a scale designed specifically to measure stress among correctional workers. The scale is scored on a 1 to 4 scale (the higher the number, the greater the stress). The results are contained in the data file, “CO Stress.” Test the hypothesis that the officers that there is no difference in stress between those who have been there more than 10 years and the officers who have been there 10 years or less.
Step 1.
H0: µ1 = µ2
H1: µ1 ≠ µ2
Step 2.
α = .05
Step 3.
Independent Samples T-test, Non-directional
Step 4.
Group Statistics
CO's Years on the Job
N
Mean
Std. Deviation
Std. Error Mean
Stress Level Score
10 years or less
21
2.1429
.79282
.17301
More than 10 years
21
2.4762
.92839
.20259
Independent Samples Test
Levene's Test for Equality of Variances
t-test for Equality of Means
F
Sig.
t
df
Sig. (2-tailed)
Mean Difference
Std. Error Difference
95% Confidence Interval of the Difference
Lower
Upper
Stress Level Score
Equal variances assumed
1.725
.197
-1.251
40
.218
-.33333
.26641
-.87177
.20510
Equal variances not assumed
-1.251
39.043
.218
-.33333
.26641
-.87218
.20552
Step 5.
This is not statistically significant because p=.218. T (40) = -1.251, p > .05.
Therefore we fail to reject H0
2.
A study is being done on the change in anxiety that occurs throughout a graduate statistics class. A group of 20 students were administered an anxiety score before the first lesson of their class and right after the last unit. Higher scores indicate greater anxiety. Using the data below, test the hypothesis that there is no difference in anxiety scores.
Student
First Lesson
Last Lesson
1
1
2
2
2
4
3
1
6
4
3
2
5
4
5
6
7
9
7
6
6
8
4
3
9
4
7
10
1
1
11
2
1
12
3
4
13
4
9
14
6
7
15
7
8
16
2
2
17
2
7
18
3
3
19
1
4
20
6
4
Step 1.
H0: µ1 = µ2
H1: µ1 ≠ µ2
Step 2.
α = .05
Step 3.
Dependent or Paired Samples T-test, Non Directional
Step 4.
Paired Samples Statistics
Mean
N
Std. Deviation
Std. Error Mean
Pair 1
FirstLesson
3.4500
20
2.03845
.45581
LastLesson
4.7000
20
2.55672
.57170
Paired Samples Test
Paired Differences
t
df
Sig. (2-tailed)
Mean
Std. Deviation
Std. Error Mean
95% Confidence Interval of the Difference
Lower
Upper
Pair 1
FirstLesson – LastLesson
-1.25000
2.07428
.46382
-2.22079
-.27921
-2.695
19
.014
Step 5.
t(19) = -2.695, p = .014, p < .05. We reject H0. There was a difference in anxiety between the first lesson and th ...
I am Samson H. I am a Multiple Linear Regression Homework Expert at statisticshomeworkhelper.com. I hold a Master's in Statistics, from Michigan, USA. I have been helping students with their homework for the past 12 years. I solved homework related to Multiple Linear Regression.
Visit statisticshomeworkhelper.com or email info@statisticshomeworkhelper.com.You can also call on +1 678 648 4277 for any assistance with Multiple Linear Regression Homework Help.
Part 1 of 16 - Question 1 of 231.0 PointsThe data pres.docxherbertwilson5999
Part 1 of 16 -
Question 1 of 23
1.0 Points
The data presented in the table below resulted from an experiment in which seeds of 5 different types were planted and the number of seeds that germinated within 5 weeks after planting was recorded for each seed type. At the .01 level of significance, is the proportion of seeds that germinate dependent on the seed type?
Seed Type
Observed Frequencies
Germinated
Failed to Germinate
1
31
7
2
57
33
3
87
60
4
52
44
5
10
19
A.Yes, because the test value 16.86 is greater than the critical value of 13.28
B.Yes, because the test value 16.86 is less than the critical value of 14.86
C.No, because the test value 16.86 is greater than the critical value of 13.28
D.No, because the test value 13.28 is less than the critical value of 16.86
Reset Selection
Question 2 of 23
1.0 Points
The chi-square goodness-of-fit test can be used to test for:
A.significance of sample statistics
B.normality
C.difference between population variances
D.difference between population means
Reset Selection
Part 2 of 16 -
Question 3 of 23
1.0 Points
The marketing manager of a large supermarket chain would like to use shelf space to predict the sales of pet food. For a random sample of 12 similar stores, she gathered the following information regarding the shelf space, in feet, devoted to pet food and the weekly sales in hundreds of dollars.
Store
1
2
3
4
5
6
Shelf Space
5
5
5
10
10
10
Weekly Sales
1.6
2.2
1.4
1.9
2.4
2.6
Store
7
8
9
10
11
12
Shelf Space
15
15
15
20
20
20
Weekly Sales
2.3
2.7
2.8
2.6
2.9
3.1
What is the estimated regression equation?
A. = 1.45 + 0.074x
B. = 2.63 - 0.174x
C. = 2.63 + 0.724x
D. = 1.45 + 0.724x
Reset Selection
Question 4 of 23
1.0 Points
A single variable X can explain a large percentage of the variation in some other variable Y when the two variables are:
A.highly correlated
B.directly related
C.inversely related
D.mutually exclusive
Reset Selection
Question 5 of 23
1.0 Points
Data for a sample of 25 apartments in a particular neighborhood are provided in the worksheet Apartments in the Excel workbook Apartments.xlsx. Using that data, find the estimated regression equation which can be used to estimate the monthly rent for apartments in this neighborhood using size as the predictor variable.
Apartments.xlsx
A. 177.12 + 1.065(size)
B.177.12 + 0.8500(size)
C.1.065 + 177.12(size)
D.197.12 + 2.065(size)
Reset Selection
Part 3 of 16 -
Question 6 of 23
1.0 Points
A pharmaceutical company is testing the effectiveness of a new drug for lowering cholesterol. As part of this trial, they wish to determine whether there is a difference between the effectiveness for women and for men. Assume α = 0.05. What is the test value?
Women
Men
Sample size
50
80
Mean effect
7
6.95
Sample variance
3
4
A.t = 3.252
B.t = 0.151
C.z = 0.081
D.z = 0.455
Reset Selection
Question 7 of 23
.
Dear students get fully solved assignments
Send your semester & Specialization name to our mail id :
help.mbaassignments@gmail.com
or
call us at : 08263069601
This quiz consists of 20 questions most appear to be similar but now.docxamit657720
This quiz consists of 20 questions most appear to be similar but now really. I ned someone who is familiar with bio-statistics and math. The due date is tomorrow 4 pm PST. or (16:00). Please if you accept handshake you must do the work not get from previous papers or tell me you had emergency an hour before its due. This is important to me.
attached is the file just in case you need it in word format. Thank you in advance.
1.
The standard deviation of the diameter at breast height, or DBH, of the slash pine tree is less than one inch. Identify the Type I error. (Points : 1)
[removed] Fail to support the claim σ < 1 when σ < 1 is true.
[removed] Support the claim μ < 1 when μ = 1 is true.
[removed]
Support the claim σ < 1 when σ = 1 is true.
[removed] Fail to support the claim μ < 1 when μ < 1 is true.
1a. The EPA claims that fluoride in children's drinking water should be at a mean level of less than 1.2 ppm, or parts per million, to reduce the number of dental cavities. Identify the Type I error. (Points : 1)
[removed] Fail to support the claim σ < 1.2 when σ < 1.2 is true.
[removed] Support the claim μ < 1.2 when μ = 1.2 is true.
[removed] Support the claim σ < 1.2 when σ = 1.2 is true.
[removed] Fail to support the claim μ < 1.2 when μ < 1.2 is true.
2.
Biologists are investigating if their efforts to prevent erosion on the bank of a stream have been statistically significant. For this stream, a narrow channel width is a good indicator that erosion is not occurring. Test the claim that the mean width of ten locations within the stream is greater than 3.7 meters. Assume that a simple random sample has been taken, the population standard deviation is not known, and the population is normally distributed. Use the following sample data:
3.3 3.3 3.5 4.9 3.5 4.1 4.1 5 7.3 6.2
What is the P-value associated with your test statistic? Report your answer with three decimals, e.g., .987 (Points : 1)
2a. Medical researchers studying two therapies for treating patients infected with Hepatitis C found the following data. Assume a .05 significance level for testing the claim that the proportions are not equal. Also, assume the two simple random samples are independent and that the conditions np ≥ 5 and nq ≥ 5 are satisfied.
Therapy 1
Therapy 2
Number of patients
39
47
Eliminated Hepatitis
20
13
C infection
Construct a 95% confidence interval estimate of the odds ratio of the odds for having Hepatitis C after Therapy 1 to the odds for having Hepatitis C after Therapy 2. Give your answer with two decimals, e.g., (12.34,56.78) (Points : 0.5)
[removed]
3. Researchers studying sleep loss followed the length of sleep, in hours, of 10 individuals with insomnia before and after cognitive behavioral therapy (CBT). Assume a .05 significance level to test the claim that there is a difference between the length of sleep of individuals before and after CBT. Also, assume the data consist of matched pair ...
WEEK 5 – EXERCISES Enter your answers in the spaces pr.docxpaynetawnya
WEEK 5 – EXERCISES
Enter your answers in the spaces provided. Save the file using your last name as the beginning of the file name (e.g., ruf_week5_exercises) and submit via “Assignments.” When appropriate,
show your work
. You can do the work by hand, scan/take a digital picture, and attach that file with your work.
For the following question(s): A school counselor tests the level of depression in fourth graders in a particular class of 20 students. The counselor wants to know whether the kind of students in this class differs from that of fourth graders in general at her school. On the test, a score of 10 indicates severe depression, while a score of 0 indicates no depression. From reports, she is able to find out about past testing. Fourth graders at her school usually score 5 on the scale, but the variation is not known. Her sample of 20 fifth graders has a mean depression score of 4.4. Use the .01 level of significance.
1.
The counselor calculates the unbiased estimate of the population’s variance to be 15. What is the variance of the distribution of means?
A)
15/20 = 0.75
B)
15/19 = 0.79
C)
15
2
/20 = 11.25
D)
15
2
/19 = 11.84
2.
Suppose the counselor tested the null hypothesis that fourth graders in this class were
less
depressed than those at the school generally. She figures her
t
score to be
-
.20. What decision should she make regarding the null hypothesis?
A)
Reject it
B)
Fail to reject it
C)
Postpone any decisions until a more conclusive study could be conducted
D)
There is not enough information given to make a decision
3.
Suppose the standard deviation she figures (the square root of the unbiased estimate of the population variance) is .85. What is the effect size?
A)
5/.85 = 5.88
B)
.85/5 = .17
C)
(5
-
4.4)/.85 = .71
D)
.85/(5
-
4.4) = 1.42
For the following question(s): Professor Juarez thinks the students in her statistics class this term are more creative than most students at this university. A previous study found that students at this university had a mean score of 35 on a standard creativity test. Professor Juarez finds that her class scores an average of 40 on this scale, with an estimated population standard deviation of 7. The standard deviation of the distribution of means comes out to 1.63.
4.
What is the
t
score?
A)
(40
-
35)/7 = .71
B)
(40
-
35)/1.63 = 3.07
C)
(40
-
35)/7
2
= 5/49 = .10
D)
(40
-
35)/1.63
2
= 5/2.66 = 1.88
5.
What effect size did Professor Juarez find?
A)
(40
-
35)/7 = .71
B)
(40
-
35)/1.63 = 3.07
C)
(40
-
35)/7
2
= 5/49 = .10
D)
(40
-
35)/1.63
2
= 5/2.66 = 1.88
6.
If Professor Juarez had 30 students in her class, and she wanted to test her hypothesis using the 5% level of significance, what cutoff
t
score would she use? (You should be able to figure this out without a table because only one answer is in the correct region.)
A)
304.11
B)
1.699.
About CORE:
The Culture of Research and Education (C.O.R.E.) webinar series is spearheaded by Dr. Bernice B. Rumala, CORE Chair & Program Director of the Ph.D. in Health Sciences program in collaboration with leaders and faculty across all academic programs.
This innovative and wide-ranging series is designed to provide continuing education, skills-building techniques, and tools for academic and professional development. These sessions will provide a unique chance to build your professional development toolkit through presentations, discussions, and workshops with Trident’s world-class faculty.
For further information about CORE or to present, you may contact Dr. Bernice B. Rumala at Bernice.rumala@trident.edu
PSY520 – Module 6Answer SheetSubmit your answers in the boxe.docxwoodruffeloisa
PSY520 – Module 6
Answer Sheet
Submit your answers in the boxes provided. No credit will be given for responses not found in the correct answer area.
Chapter 16:
16.9 Given the aggression scores below for Outcome A of the sleep deprivation experiment, verify that, as suggested earlier, these mean differences shouldn’t be taken seriously by testing the null hypothesis at the .05 level of significance. Use the computation formulas for the various sums of squares and summarize results with an ANOVA table.
Hours of Sleep Deprivation
Zero
Twenty-Four
Forty-Eight
3
4
2
5
8
4
7
6
6
Group Mean:
5
6
4
Grand Mean: 5
Question:
Steps:
Calculations or Logic:
Answer:
Use the computation formulas for the various sums of squares and summarize results with an ANOVA table.
What is the research hypothesis?
What is the null hypothesis?
What are the degrees of freedom?
What is the calculated ?
What is the F?
Complete the ANOVA table:
Source
SS
df
MS
F Ratio
Treatment (between)
Error (within)
Total
16.10 Another psychologist conducts a sleep deprivation experiment. For reasons beyond his control, unequal numbers of subjects occupy the different groups. (Therefore, when calculating in SS between and SS within , you must adjust the denominator term, n , to reflect the unequal numbers of subjects in the group totals.)
Hours of Sleep Deprivation
Zero
Twenty-Four
Forty-Eight
1
4
7
3
7
12
6
5
10
2
9
1
Summarize the results with an ANOVA table. You need not do a step-by-step hypothesis test procedure:
Source
SS
df
MS
F
Treatment (between)
Error (within)
Total
If hand calculating, include formulas and calculations below. If using SPSS, include a picture, screenshot, or cut/paste of the output below.
Question:
Calculations or Logic:
Answer:
Are the results statistically significant? Yes or no?
If appropriate, estimate the effect size with η2
If appropriate, use Tukey’s HSD test (with for the sample size, n) to identify pairs of means that contribute to the significant F, given that , and
What is the HSD?
Which pairs are significant at the .05 level?
If appropriate, estimate effect sizes with Cohen’s d.
Indicate how all of the above results would be reported in the literature, given sample standard deviations of s0= 2.07, s24 =1.53, and s48=2.08.
16.12 For some experiment, imagine four possible outcomes, as described in the following ANOVA table.
A.
Source
SS
df
MS
F
Between
900
3
300
3
Within
8000
80
100
Total
8900
83
B.
Source
SS
df
MS
F
Between
1500
3
500
5
Within
8000
80
100
Total
9500
83
C.
Source
SS
df
MS
F
Between
300
3
100
1
Within
8000
80
100
Total
8300
83
D.
Source
SS
df
MS
F
Between
300
3
100
1
Within
400
4
100
Total
700
7
Question:
Calculations or Logic:
Answer:
How many groups are in Outcome D?
Assuming groups of equal size, what’s t ...
TitleABC123 Version X1Week 4 Practice Worksheet.docxedwardmarivel
Title
ABC/123 Version X
1
Week 4 Practice Worksheet
PSY/315 Version 6
1
University of Phoenix MaterialWeek 4 Practice Worksheet
Prepare a written response to the following questions.
Chapters 9 &11
1. Two boats, the Prada (Italy) and the Oracle (USA), are competing for a spot in the upcoming America’s Cup race. They race over a part of the course several times. The sample times in minutes for the Prada were: 12.9, 12.5, 11.0, 13.3, 11.2, 11.4, 11.6, 12.3, 14.2, and 11.3. The sample times in minutes for the Oracle were: 14.1, 14.1, 14.2, 17.4, 15.8, 16.7, 16.1, 13.3, 13.4, 13.6, 10.8, and 19.0. For data analysis, the appropriate test is the t-Test: Two-Sample Assuming Unequal Variances.
The next table shows the results of this independent t-test. At the .05 significance level, can we conclude that there is a difference in their mean times? Explain these results to a person who knows about the t test for a single sample but is unfamiliar with the t test for independent means.
Hypothesis Test: Independent Groups (t-test, unequal variance)
Prada
Oracle
12.170
14.875
mean
1.056
2.208
std. dev.
10
12
n
16
df
-2.7050
difference (Prada - Oracle)
0.7196
standard error of difference
0
hypothesized difference
-3.76
t
.0017
p-value (two-tailed)
-4.2304
confidence interval 95.% lower
-1.1796
confidence interval 95.% upper
1.5254
margin of error
2. The Willow Run Outlet Mall has two Haggar Outlet Stores, one located on Peach Street and the other on Plum Street. The two stores are laid out differently, but both store managers claim their layout maximizes the amounts customers will purchase on impulse. A sample of ten customers at the Peach Street store revealed they spent the following amounts more than planned: $17.58, $19.73, $12.61, $17.79, $16.22, $15.82, $15.40, $15.86, $11.82, $15.85. A sample of fourteen customers at the Plum Street store revealed they spent the following amounts more than they planned when they entered the store: $18.19, $20.22, $17.38, $17.96, $23.92, $15.87, $16.47, $15.96, $16.79, $16.74, $21.40, $20.57, $19.79, $14.83. For Data Analysis, a t-Test: Two-Sample Assuming Unequal Variances was used.
At the .01 significance level is there a difference in the mean amount purchased on an impulse at the two stores? Explain these results to a person who knows about the t test for a single sample but is unfamiliar with the t test for independent means.
Hypothesis Test: Independent Groups (t-test, unequal variance)
Peach Street
Plum Street
15.8680
18.2921
mean
2.3306
2.5527
std. dev.
10
14
n
20
df
-2.42414
difference (Peach Street - Plum Street)
1.00431
standard error of difference
0
hypothesized difference
-2.41
t
.0255
p-value (two-tailed)
-5.28173
confidence interval 99.% lower
0.43345
confidence interval 99.% upper
2.85759
margin o ...
My significant event was losing my father at an early age. So if y.docxrosemarybdodson23141
My significant event was losing my father at an early age. So if you are good at psychology describe how that can affect a young woman without a dad at an early age.
Assignment 1.1: Significant Event Draft
Due Week 4 Note: Students will turn in this assignment twice: first as a draft (Week 4 Assignment) and then as a final paper (Week 8 Assignment). Students will submit first draft of the assignment and then submit the final draft after receiving feedback from the professor and making the recommended changes. They will be graded separately for each submission of the assignment.
Select a significant event (either positive or negative) that occurred before you reached adulthood and that has had a life-shaping effect on your life. In this assignment, you will use what you’ve learned in Weeks 1 thru 4 of this course and base your paper on your readings, along with information from library research, to discuss psychological aspects of your event.
Write a two to three (2-3) page paper in which you:
1.Briefly describe your significant event (one to two [1-2] sentences).
2.Describe your event in terms of at least two (2) different perspectives in psychology (e.g., behavioral, cognitive, psychodynamic, cultural/social, etc.)
3.Determine what learning (e.g., classical, operant, etc.) may have resulted from your event, or arisen because of your event.
4.Discuss why the memory of the event you described may or may not be completely accurate.
5.Use at least two (2) quality academic resources in this assignment. Note: One of these resources may be your textbook. Articles from professional journals are certainly a high quality resource. Magazine and newspaper articles are also accepted for this assignment. Articles published on the Internet may also be suitable, if they originate with credible persons or organizations. Please note that articles from Wikipedia, ask.com, and the like are not suitable.
Your assignment must follow these formatting requirements:
•Be typed, double spaced, using Times New Roman font (size 12), with one-inch margins on all sides; references must follow APA format. Check with your professor for any additional instructions.
•Include a cover page containing the title of the assignment, the student’s name, the professor’s name, the course title, and the date. The cover page and the reference page are not included in the required page length.
The specific course learning outcomes associated with this assignment are:
•Relate psychological concepts to real-world situations.
•Describe the major theories of learning, memory, cognition, consciousness, development, and social psychology.
•Use technology and information resources to research issues in psychology.
Part 1 of 16 -
Question 1 of 23
1.0 Points
A company operates four machines during three shifts each day. From production records, the data in the table below were collected. At the .05 level of significance test to determine if the number of breakdowns is independent of the sh.
Assignment 2 Tests of SignificanceThroughout this assignment yo.docxrock73
Assignment 2: Tests of Significance
Throughout this assignment you will review mock studies. You will needs to follow the directions outlined in the section using SPSS and decide whether there is significance between the variables. You will need to list the five steps of hypothesis testing (as covered in the lesson for Week 6) to see how every question should be formatted. You will complete all of the problems. Be sure to cut and past the appropriate test result boxes from SPSS under each problem and explain what you will do with your research hypotheses. All calculations should be coming from your SPSS. You will need to submit the SPSS output file to get credit for this assignment. This file will save as a .spv file and will need to be in a single file. In other words, you are not allowed to submit more than one output file for this assignment.
The five steps of hypothesis testing when using SPSS are as follows:
1. State your research hypothesis (H1) and null hypothesis (H0).
2. Identify your confidence interval (.05 or .01)
3. Conduct your analysis using SPSS.
4. Look for the valid score for comparison. This score is usually under ‘Sig 2-tail’ or ‘Sig. 2’. We will call this “p”.
5. Compare the two and apply the following rule:
a. If “p” is < or = confidence interval, than you reject the null.
Be sure to explain to the reader what this means in regards to your study. (Ex: will you recommend counseling services?)
* Be sure that your answers are clearly distinguishable. Perhaps you bold your font or use a different color.
ASSIGNMENT 2(200) WORD MINIUM
1. They allow us to see if our relationship is "statistically significant". (Remember that this only shows us that there is or is not a relationship but does NOT show us if it is big, small, or in-between.)
2. It let's us know if our findings can be generalized to the population which our sample was selected from and represents.
This week you will decide which test of significance you will use for your project. For this class your choices for tests will include one of the following:
· Chi-square
· t Test
· ANOVA
We will be using a process for hypothesis testing which outlines five steps researchers can follow to complete this process:
1. Write your research hypothesis (H1) and your null hypothesis (H0).
2. Identify and record your confidence interval. These are usually .05 (95%) or .01 (99%).
3. Complete the test using SPSS.
4. Identify the number under Sig. (2-tail). This will be represented by "p".
5. Compare the numbers in steps 2 and 4 and apply the following rule:
1. If p < or = confidence interval, than you reject the null hypothesis
Determine what to do with your null and explain this to your reader. Be sure to go beyond the phrase "reject or fail to reject the null" and explain how that impacts your research and best describes the relationship between variables.
TEST QUESTIONS-NEED FULL ANSWERS
Q1
Make up and discuss research examples corresponding to the various ...
JW House FundraiserJourney Through the Enchanted Forest Ga.docxpauline234567
JW House Fundraiser
Journey Through the Enchanted Forest Gala
Silent Auction
Table Decor
Specialized cocktails for Event
Three Screens will be Placed for Optimum Viewing by all Attendees
New House Announcement
Happy 30th Birthday, JW!
Auction
Isle down Center Allows Fundraising Auctioneer to Engage Audience
Balloon
Drop
S’mores Sponsored by Largest Corporate Donor
Finish the Evening with Dancing & Beverages
Image Sources
http://springfields.net.au/media/catalog/category/_2_43.png
https://s-media-cache-ak0.pinimg.com/originals/36/fa/fe/36fafee1408521530bfa23368e604d55.jpg
https://www.thegirlcreative.com
http://ballooncity.com/wp-content/uploads/2013/09/danceFloorFlipPNG.png
https://t3.rbxcdn.com/ea203ae8bb1787569f5e375cde0a93b2
http://jwhouse.org/wp-content/uploads/2017/07/jwPortraitStory.jpg
http://royalcandycompany.com/wp/wp-content/uploads/2016/04/Smores-Buffet.jpg
https://lhueagleeye.files.wordpress.com/2015/11/crowd_20080505124150.jpg
www.socialtables.com
https://media-cdn.tripadvisor.com/media/photo-s/03/0d/c8/a7/santa-clara-convention.jpg
https://s3.amazonaws.com/assets.winspireme.com/LPP/Buy-it-Now-Logo.png
http://www.tastefultreats.com/media/catalog/product/cache/1/image/9df78eab33525d08d6e5fb8d27136e95/g/o/gourmet-kosher-sweets-gift-basket.png
https://vignette.wikia.nocookie.net/piratesonline/images/b/b3/Chest.png/revision/latest?cb=20090707201032
http://pngimg.com/uploads/question_mark/question_mark_PNG126.png
image1.tiff
image2.png
image3.tiff
image4.tiff
image5.tiff
image6.tiff
image7.tiff
image8.tiff
image9.tiff
image10.tiff
image11.tiff
image12.png
image13.tiff
image14.tiff
image15.tiff
image16.png
image17.tiff
image18.tiff
image19.tiff
image20.tiff
image21.tiff
image22.png
image23.tiff
image24.tiff
image25.tiff
image26.tiff
image27.tiff
image28.tiff
image29.tiff
1. INTRODUCTION. Begin by stating what you will discuss and explain why is important.
2. CRITICAL SUMMARY. Summarize the relevant views and the arguments that you believe are important.
Usually in a critical discussion it is not sufficient to merely summarize the author’s view. Your attention should be
focused on the author's development of the view--that is, on his arguments, in the broadest sense of the word.
3. CARE IN CITATIONS. Make sure you accurately state the position of the author and always include page
references for each quotation or attribution to her/him if applicable.
4. CRITICAL EVALUATION FROM A CHRISTIAN PERSPECTIVE. At least half of your paper must be devoted
to a critical evaluation of the views of the author you are discussing from the perspective of the Christian thesis that
a Christian call in business may prop-up the role of the markets.
5. CONSIDER POSSIBLE RESPONSES TO YOUR OBJECTIONS. Whenever you offer an objection to an
author's position, explicitly consider whether the author has said anythin.
JP Morgan Chase The Balance Between Serving Customers and Maxim.docxpauline234567
JP Morgan Chase: The Balance Between Serving Customers and Maximizing Shareholder Wealth
Penelope Bender
William Woods University
BUS 585: Integrated Studies in Business Administration
Dr. Leathers
Abstract
This paper investigates why JP Morgan Chase and other financial institutions struggle to balance client interests over maximizing wealth.
It is an exploratory study done through literature review.
Often financial institutions, like JP Morgan, put profits ahead of the interests of those they serve.
The paper contributes to better understanding of corporate culture.
This paper investigates why JP Morgan Chase and other financial institutions struggle to balance client interests over maximizing shareholder wealth. This exploratory study is done through a literature review to answer why financial institutions, specifically JP Morgan, often put profits ahead of those they serve. The study will provide evidence of the complex nature of balancing client interests over maximizing shareholder and individual wealth and the need for tighter internal and external oversight. This paper contributes to a better understanding of why corporate culture encourages profit over stakeholders’ interests.
2
Research Question
Why does JP Morgan Chase and other financial institutions struggle to balance client interests over maximizing shareholder wealth?
Employees of JP Morgan Chase and other large banks work in their best interests to increase wealth and succeed by meeting management goals. However, because of the complex nature of large banks, an individual(s), unethical behavior can go unchecked.
3
Problem Statement
JP Morgan Chase competes globally and faces competition from other large banks in the US and abroad.
JP Morgan Chase is part of a complex system of regulation, self-interests, and wealth creation.
The interests of shareholders and investors is sometimes overshadowed by agents working in their own best interests.
Financial markets are a complex web of interests, and because of opportunities for individual profits, regulating individual’s actions without stricter regulations and internal oversight is impossible.
The study is not meant to be a moral or ethical analysis but merely why the complex relationship exists and will continue to exist in capitalist society. This paper contributes to a better understanding of why capitalism or financialism’s (Clarke, 2014) fundamentals encourage wealth creation. Financial markets are a complex web of interests, and because of opportunities for individual profits, regulating individual’s actions without stricter regulations and internal oversight is impossible.
4
Literature Review
The literature review showed a connection between self-interests, regulators, competition, and risk, which all lead to a complex system of conflicting agendas.
5
How Self-Interests Influence Behavior
Ross (1973) explains that all employment relationships are agency relationships and moral hazards are generally .
Interpret a Current Policy of Three CountriesInstructionsAs .docxpauline234567
Interpret a Current Policy of Three Countries
Instructions
As a scholar in public administration, you are asked to present options based on three different countries' information for the next congressional meeting in your state. Be sure to include the following information:
• Perform a SWOT analysis of each immigration system presenting the strengths, weaknesses, opportunities, and threats of each system. You are required to evaluate the United States' system but may choose two other countries besides Costa Rica and Ghana as these were already covered in your weekly resources. Topics such as ethics, history, actors, budgeting can be incorporated into your SWOT analysis.
• Facilitate an immigration benefit analysis for each system to determine the best fit for your state (be sure to identify your state to provide context for your presentation).
• Prepare a plan for the implementation of your chosen immigration program.
Compare how the immigration system is treated in three countries (the U.S. and two other countries).
Length: 12 to 15 pages, not including title and reference pages
References: Include a minimum of seven scholarly references.
The completed assignment should address all the assignment requirements, exhibit evidence of concept knowledge, and demonstrate thoughtful consideration of the content presented in the course. The writing should integrate scholarly resources, reflect academic expectations, and current APA standards.
Respond to
two or more of your colleagues’ posts in one or more of the following ways:
(100 words each Colleague)
· Ask a question about or provide an additional suggestion for the risks that your colleague’s organization might face if it engaged in the capital investment project.
· Provide an additional perspective on the level of risk associated with the project your colleague identified for their selected organization or on how willing/capable the organization might be in taking on and managing the risks your colleague identified.
· Offer an insight you gained from your colleague’s summary of the trade-offs between risks and returns and/or their recommendation for their selected organization to move or not move forward with the project.
Return to this Discussion in a few days to read the responses to your initial posting. Note what you have learned or any insights you have gained as a result of the comments your colleagues made.
1st Colleague to respond to:
The risks associated with a capital investment project for medical equipment for healthcare organizations such as hospitals, as discussed in Week 7, are listed below.
· An inadequate system of budget management caused by unethical conduct.
· The lack of a clearly defined internal process management framework
· Insufficient communication channels within the organization.
The information provided by the managerial accountant assists in making crucial business decisions. Thus, if such information is fabricat.
INTRODUCTIONWhen you think of surveillance, you may picture tw.docxpauline234567
INTRODUCTION
When you think of surveillance, you may picture two police officers camped out in an unmarked car, watching the comings and goings at a suspect’s apartment building. Or you may imagine an investigator trailing a car on the highway or tapping a suspect’s phone to listen in on potentially incriminating conversations. Surveillance is all these activities, but in the 21st century, it is also much more.
Consider video surveillance of local businesses, streets, and highways; cell phone data; and the reams and reams of digital information gathered on everyday activities—from social media and computer use to credit card transactions.
This week, you analyze concerns related to this new era of surveillance, such as privacy and legal requirements.
LEARNING OBJECTIVES
Students will:
Analyze issues related to privacy and surveillance
Describe surveillance
Differentiate between legal and illegal surveillance
Analyze legal requirements for conducting surveillance
PRIVACY VERSUS PUBLIC SAFETY
The average citizen today may feel as though they are constantly being watched and their actions recorded. And perhaps rightly so. After all, social media sites market personalized products based on how you use the Internet, cell phones pinpoint your location, and fitness trackers transmit your health and fitness activities to the cloud. This sense of being “spied on,” however, does not negate the important use of surveillance techniques in solving and preventing crime.
For this Discussion, you analyze how to balance two sometimes opposing sides in surveillance work: the expectation of privacy and the goal of public safety.
RESOURCES
Be sure to review the Learning Resources before completing this activity.
YOU WILL FIND THE READING FOR THIS ASSIGNMENT IN THE ATTACHED READING MATERIALS PLEASE GO THERE AND READ BEFORE TRYING TO COMPLETE THIS ASSIGNMENT SO YOU WILL UNDERSTAND WHAT IS NEEDED TO COMPLETE THE WORK….
Post a response to the following:
When conducting surveillance, explain how to balance an expectation of citizen privacy with legitimate investigative procedure that has public safety as its goal.
Explain whether citizens should differentiate between government intrusion and private companies who use citizens’ online data to surveil their movements and activity.
.
Interviews and Eyewitness Identifications AP PhotoMat.docxpauline234567
Interviews and
Eyewitness
Identifications
AP Photo/Matthew Apgar
OBJECTIVES
After reading this chapter you will be able to:
• Identify the evidence collected
by investigators in the BP
gas station robbery and
discuss its role in the
identification and apprehension
of the perpetrator.
• Discuss the advantages and
disadvantages of using facial
identification software and
forensic sketches to create
composite pictures of
suspects.
• Identify and discuss the
rationale of the recommended
lineup procedures.
• Discuss the research that
has been conducted on the
accuracy of hypnotically elicited
testimony. • Identify the difference between
primary and secondary
witnesses and give an example
of each.
• Discuss the value of eyewitness
identifications in establishing
proof. • Compare and contrast the
cognitive interviewing approach
with standard police interviews.
• Identify and discuss the
methods of eyewitness
identifications.
• Identify the three phases of
human memory and discuss
how factors at each phase
may affect the retrieval of
information from witnesses.
• Discuss the contributions
of cognitive interviewing in
enhancing memory recall.
From the CASE FILE
BP Gas Station Robbery
The introduction to this chapter consists of a police
report (edited for length) of the investigation of an
armed robbery of a British Petroleum (BP) gas station
that occurred on August 22, 2011, in Germantown,
Wisconsin (a suburb of Milwaukee). The report serves
as an example of a criminal investigation case report
and also highlights issues discussed in this chapter,
such as the value of eyewitness identification. Issues
discussed in other chapters, including the important
role of patrol officers in investigations, crime scene
photographs, investigation of robbery and auto theft,
and the value of DNA, are also present in this report.
Incident Report Number: 11-014277,
Report of Officer Toni Olson
On Monday, August 22, 2011, I, Officer Olson, was
assigned to investigate and respond to a robbery, which
had just occurred at the County Line BP, located at 21962
County Line Road. Officers were advised that the c I erk at
the BP gas station had called the non-emergency number
reporting that a younger wh ite male came into the store and
hit him over the head with an unknown object before taking
money out of his cash drawer and leaving in a red SUV or
truck, northbound on Bell Road. A possible registration
of 583RIB was given out for the suspect vehicle. I, along
with Lt. Huesemann, Officer Brian Ball, and Officer Daniel
Moschea of the Germantown Police Department responded.
Upon arriving on scene, officers were advised that witnesses
reported the suspect veh icle leaving the scene of the
robbery northbound on Bell Road into a subdivision. The
witnesses also stated that they had not seen the suspect
vehicle leave the subdivision, which only has two ways to get
in and.
Interview Presentation: Questions
To prepare:
· Identify an interview subject with a different cultural background than you.
· Ask your interview subject the questions below. Be sure to record the interview and/or take good notes.
During the interview, ask the individual the following interview questions:
· Have you ever lived or visited outside of the United States? If so, where? Describe the experience.
· What do you identify as your culture?
· What are the most important values and beliefs of your family and community?
· What are the important events, traditions, celebrations, and practices in your family or community?
· How does your family or community define gender roles?
· How do you identify your:
· Race
· Ethnicity
· National origin
· Color
· Sex
· Sexual orientation
· Gender identity or expression
· Age
· Marital status
· Political belief
· Religion
· Immigration status
· Disability status
· How well do you fit within your family or community based on these other identities you hold?
· How do you think others outside your community view your culture?
· Have you experienced prejudice or discrimination? Please describe.
Social Media and Ethical Considerations
Walden’s MSW Social Media Policy
A student’s presence on and use of social media reflects on the MSW program and the social
work profession; therefore, behavior on social media will be held to the same professional
standards and student code of conduct expectations. Social Work professionals, including
students, are expected to adhere to the NASW Code of Ethics related to virtual communications.
Students should use social work values and principles, as well as specific agency policy, to guide
their social media interactions.
Students need to consider the ethical consequences of their own social media use, as well as use
of social media in practice. Be aware of and follow agency policies regarding the use of social
media. Before using social media communication tools on behalf of a field agency, students
must seek agency approval of any messages or posts.
Walden MSW students are expected to adhere to the ethical standards outlined in the NASW
Code of Ethics. Common ethical issues that social workers need to understand and manage when
utilizing social media include, but are not limited to, privacy and confidentiality (Section 1.07),
conflicts of interest and dual relationships (Section 1.06), and informed consent (Section 1.03).
There is significant risk of unintentionally sharing protected information when using social
media. Be cautious when posting information about an agency. Never post confidential or
private information about clients or colleagues, even using pseudonyms.
Students need to remain aware of professional boundaries even when participating in social
media in their personal time. Managing “friend” requests and maintaining privacy settings is
critical regardless of whether a student uses social me.
INT 220 Business Brief Template Course Project.docxpauline234567
INT 220 Business Brief Template
Course Project
Section One: Drivers for Global Entry
Going global would afford the company many benefits including increased sales and revenues. Japan is a developed market and thus the purchasing power of the consumers is high, which implies that many consumers will be able to purchase our products. Expanding to Japan will enable increased profits that can be reinvested in research and development of new technology and innovation that will create a competitive advantage for both domestic and international market. In addition, entering the foreign market will help the business to tap into new market segment. According to International Data Corporation (IDC), Apple was the largest smartphone brand in 2020 in Japan with a 47.3 percent market share (Sudarshan, 2021). The data shows that Japan would be an ideal market for quality phone cell cases due to high purchase of smartphones. Therefore, the company will benefit from increased sales and profits.
Section Two: Market Profile
Cultural Profile
CategoryUnited StatesJapan
Commonly Spoken Languages
English
Japanese
Commonly Practiced Religions
Christianity
Shinto
Power Distance Index (PDI)
40
54
Individualism Versus Collectivism (IDV)
91
46
Masculinity Versus Femininity (MAS)
95
62
Uncertainty Avoidance Index (UAI)
92
46
Long-Term Orientation Versus Short-Term Normative Orientation (LTO)
88
26
Indulgence Versus Restraint (IVR)
42
68
Political and Economic Profile
CategoryUnited StatesJapan
Political System
Representative democracy
Constitutional monarchy
Current Leaders
Joseph Biden president
Fumio Kishida prime minister
Economic Classification
Developed
Developed
Economic Blocs Impacting Trade
World trade organization
Gross Domestic Product
23 trillion USD
4.9 trillion USD
Purchasing Power Parity
22,996.08
100.412
Gross Domestic Product Per Capita
69,287.54 USD
39,285.16 USD
Human Development Index
Very high 0.921
0.919
Human Poverty Index
$26,246 for a family of four
Poverty headcount ratio at $5.50 a day
In terms of economic development, both countries have developed economy, thus making them ideal for business. Consumers have high purchasing power which means that they are able to purchase new products. US has a higher GPD compared to Japan, however, this can be attributed to the size and population of U.S. compared to that of Japan. Furthermore, both countries are members of World Trade Organization, which means that their trade operations with other nations are regulated and subject to WTO regulations. The culture in Japan is hugely different then the culture in America. Americans are self-motivated while the Japanese culture embraces more of a group mentality and looks for approval from their superiors before making big decision. Both cultures work long hours and take very little breaks. For the most part Japanese culture is more formal in the work place then in the U.S.
Section Three: Market Consideratio.
Instructor Name Point Value 30Student NameCATEGORY .docxpauline234567
Instructor Name: Point Value: 30
Student Name:
CATEGORY Excellent (12–11 points) Good (10–9 points) Fair (8–7 points) Poor (6–1 points) Did Not Complete (0 points) # of points
Content Quality
40% of total Discussion
grade
Student participated in the
Discussion about the presented
topic with detailed, relevant,
supported initial posts and
responses. Student enhanced
points with examples and
questions that helped further
discussion. Discussion is well
organized, uses scholarly tone,
follows APA style, uses original
writing and proper paraphrasing,
contains very few or no writing
and/or spelling errors, and is fully
consistent with graduate-level
writing style. Discussion contains
multiple, appropriate and
exemplary sources
expected/required for the
assignment.
Student participated in the
Discussion about the presented
topic with detailed, relevant,
supported initial posts and
responses. Discussion is mostly
consistent with graduate level
writing style. Discussion may have
some small or infrequent
organization, scholarly tone, or
APA style issues, and/or may
contain a few writing and spelling
errors, and/or somewhat less than
the expected number of or type of
sources.
Student participated in the
Discussion about the presented
topic with adequate content but
the content lacked either detail,
relevancy, or support. Discussion
is somewhat below graduate level
writing style, with multiple smaller
or a few major problems.
Discussion may be lacking in
organization, scholarly tone, APA
style, and/or contain many writing
and/or spelling errors, or shows
moderate reliance on quoting vs.
original writing and paraphrasing.
Discussion may contain inferior
resources (number or quality).
Content of student's post and
responses was not clear, relevant,
or supported. Discussion is well
below graduate level writing style
expectations for organization,
scholarly tone, APA style, and
writing, or relies excessively on
quoting. Discussion may contain
few or no quality resources.
Student did not submit a post or
response.
CATEGORY Excellent (12–11 points) Good (10–9 points) Fair (8–7 points) Poor (6–1 points) Did Not Complete (0 points) # of points
Engagement
40% of total Discussion
grade
Student participated actively as
evidenced by strong reflective
thought in both the initial post and
in responses to classmates' posts.
Student response participation
exceeded the stated minimum
requirements.
Student participated actively as
evidenced by strong reflective
thought in both the initial post and
in responses to classmates'
posts.Student responses
contributed to classmates'
experience.
Student participated somewhat
actively as evidenced by posts
and responses that were adequate
but lacking strong reflective
thought.
Student did not participate actively
as evidenced by little reflective
thought in i.
InstructionsThere are two high-level types of distribution cha.docxpauline234567
Instructions
There are two high-level types of distribution channels, direct and indirect. In the direct distribution channel, goods are moved directly from the Producer to the Consumer. In the indirect distribution channel, the producer will meet consumer demand through third -party wholesalers and/or retailers. Direct channels produce short supply chains, indirect channels produce long chains.
Research and report on two large producers, Costco and Apple, and describe in detail which distribution approach each company uses -- direct, indirect, or mixed – for at least two products in each company.
Your APA paper should be at least 1,000 words in length.
.
InstructionsNOTE If you have already reviewed this presentation.docxpauline234567
Instructions
NOTE: If you have already reviewed this presentation in a different class please enter class number and instructor’s name in the submission text box below.
____________________________________________________________________
If you have not reviewed this presentation in a previous class, please proceed.
Please review the curated presentations below. These presentations will prepare you for writing deliverables that meet the expectations of this course. We want you to be successful in all your courses so please refer back to this tool often. This presentation is located in the library and the Student Center. To view an presentation, please click on the button below. Be sure to review all five presentations for this week!
Presentation Four: The Research Process & Choosing a Topic
Presentation Five: Types of Sources
Presentation Six: Search Strategies & Techniques
Presentation Seven: Evaluating Information
Presentation Eight: Ready to Shine!
When you have finished reviewing all five presentations, please copy and paste the following statement into the submission box below:
STATEMENT: I HAVE REVIEWED WEEK TWO INFORMATIONAL PRESENTATION. I UNDERSTAND THIS PRESENTATION IS ALSO LOCATED IN THE LIBRARY AND STUDENT CENTER FOR FUTURE REFERENCE.
.
InstructionsRead two of your colleagues’ postings from the Di.docxpauline234567
Instructions:
Read two of your colleagues’ postings from the Discussion question.
Respond with a comment that asks for clarification, provides support for, or contributes additional information to two of your colleagues.
Timia Brown (
She/Her)
In healthcare, whether long-term or acute care, interdisciplinary communication is necessary to provide patient-centered care. The two scenarios provided both effective and ineffective communication.
Scenario 1
Assuming the leader for the interdisciplinary rounds was the case manager, she introduced the nursing student, who was not paying attention. The case manager did not present other team members, so the student was left guessing. The pharmacist and the physical therapist were laughing and talking during the discussion. There was no engagement; the MD was on her phone, and everyone was preoccupied. Each team member individually knew the patient and his shortcomings, yet there was no preparation for the actual engagement with each other. Each team member projected issues onto the next member, using terms such as "somebody" or "someone" needed to do this. There was no responsibility for care. The team spoke unprofessionally to each other, using words like "yep" and "umm." In the end, the case manager assigned responsibility; however, the disciplines accepted the responsibility grudgingly. The team's disrespect for each other was portrayed to the student, who was disengaged throughout the meeting. The patient was not ready to be discharged from the sound of this scenario. The patient's pain was not controlled, nor was his anxiety; no equipment had been ordered for discharge. The patient's safety was not a priority in this meeting, which could lead to readmission or fall risk at home.
In scenario two, the team all appeared happy to be there, with smiling faces and excellent eye contact. The leader engaged the nursing student immediately by having the team introduce themself. The team was much more prepared and engaged. Each member respected the other's role in providing care and a safe, patient-centered discharge. The team took responsibility for what was needed from each of them now and at the time of release. The communication was more two-way communication. They did a recap of what was discussed, and everyone willingly took part in making sure the patient went home safely and confidently.
Effective communication between interdisciplinary teams must be present to provide the care needed for each patient. It starts with respecting each other's role in the patient's care and remembering the patient is the priority. The
Journal of Communication in Healthcare stated the leading cause of all sentinel events from 1995 to 2004 was ineffective communication. (2019, Altabba) Therefore effective communication could decrease the number of incidents, and lead to proper care.
References
Altabbaa G, Kaba A, Beran TN. Moving from structure.
InstructionsRespond to your colleagues. Respond with a comment .docxpauline234567
Instructions:
Respond to your colleagues. Respond with a comment that asks for clarification, supports, or contributes additional information to two or more of your colleagues.
Reynaldo Guerra
As influencers in our society, that bring about social change in healthcare as all those we contact, the type of agent I would align with is a Purposeful Participant. Where "School or work are the primary motivations for involvement in positive social change." (
What kind of social change agent are you? n.d.) are what defines greatly the type of agent I am. Due to my desire to expand my education and grow, I have been allowed to not just see but know that I can contribute to various aspects of healthcare. At the hospital I currently am employed, many principles are introduced to us and help us with making a difference for our patients as all professionals alike by the way we interact and the relationship we create with everyone. Even if driven by these two motivators, they have opened my eyes and expanded my limitations in the change we can bring about.
This eye-opening experience has changed my perspective on how I can make a social change with all those around me. I now feel that a cascade effect comes from my changes as little as it might seem, it gets passed down and impact larger changes in the long run. How I speak with my patients and show the advocate I am for them in addressing their healthcare issues with importance, to the trust and relationship I have created with the primary care providers, goes to show these small social changes can in the end bring a great change for all. This has shown me that social change has a larger purpose in the end and even as small of a change we bring about, if we all come together and do the same, the results would be even more significant than what we perceived as a small change in the beginning. From our professional interactions with one another to our desire to help and better our care with all patients alike, these changes have a great purpose and impact on our future as everyone else.
Apart from that, social change has influenced my education by motivating me to seek ways to make a difference in a community project presented by my university. It has ignited a flame in me, so to speak, and piqued my interest in seeing what my university has to offer in making a social change. Whether this is by being part of projects, joining a committee, or being part of future alumni programs to help others. Also, being able to refine my nursing practice in our community as in the hospital has been a change for me. This, in turn, will be put forth in the interactions and relationships I create with my patients, colleagues, peers, and others I come in contact with, hopefully, bringing a social change in the end. This is what the principles of social change will bring about for me.
References
Walden University. (n.d.).
What kind of social change agent are you? Lin.
Instructions
Procurement Outsourcing (PO) Strategies:
PO strategies at the highest level involve either materials or traditional business processes such as HR, IT, Finance, Accounting, Travel/Entertainment services, Marketing/Print/Advertising, or Customer Relationship Management (CRM). Your task here is to choose a public business organization and report on what direct materials are being outsourced. Direct materials are categorized as strategic (high-impact), bottleneck items (low-profit impact and high-supply risk), leverage items (high-profit items and low-supply risk), or non-critical (low-profit impact and low-supply risk). Describe the outsource process in detail, who provided the outsourced services, and what direct materials were involved.
You are to prepare a PowerPoint presentation, with a minimum of twelve (12) slides, to include inline citations, a cover slide, and a slide of references. Your citations and references should be APA-compliant.
Level of writing: Exemplary
.
InstructionsPart Four of Applied Final Project,Playing with Ge.docxpauline234567
Instructions
Part Four of Applied Final Project,Playing with Gender: Understanding Our Gendered Selves:
"Understanding My Playing-with-Gender Act" (20% of course grade; due end of Week 7) Five (5) pages (1200-1500 words)
All parts of this project should be formatted in APA style (follow for both essay and citation styles):https://libguides.umgc.edu/c.php?g=1003870
Purpose: Act Analysis
In this part of the assignment, you will perform, describe, and analyze your act. After you perform your act, compose a 5-page (1200-1500 words) task specifying your experiences. The first section (one-third to one-half of your paper) should describe your act and your responses to it, and the second section should analyze your act in terms of the scholarship on gender:
Section One (minimum 500 words):
1. Describe your act:
2. What did you do?
3. Where did you do it?
4. How did you prepare for it?
5. What responses did you get while performing your act?
6. How did you feel while performing your act?
7. What would you do differently if you had to perform this same act again? Would you perform the act in the same location and at same time? Would you change your appearance during the act? Would you do anything else differently?
8. Please refer directly to the required reading on Participant Observation (Mack et al., 2005) in this section of the paper (Mack et al., 2005) (
PLEASE see attached for document):
Mack et al. (2005). "Module Two: Participant Observation," from
Qualitative Research Methods: A Data Collector's Field Guide, Family Health International. Read Module 2, pages 13-27. Retrieved from
https://www.fhi360.org/sites/default/files/media/documents/Qualitative%20Research%20Methods%20-%20A%20Data%20Collector's%20Field%20Guide.pdf
Section Two: (minimum 700 words):
(Please see attached for document listing the sources)
Referring directly to at least three academic sources for support (these may be pulled from the sources you identified and discussed in your Annotated Bibliography for Part 3
and/or the readings for this class), consider the potential impact of your act. Here are some questions to consider (you do not have to answer all of these questions; they are provided to help you to think about ways your act may have impact on society):
· Can you explain the range of reactions to your act? Did those reactions reflect any of the sociological scholarship found in the course readings or in your research? Did any of the reactions challenge that research?
· How do you think class, race, age, and sexuality came into play during the conception and performance of the act?
· Was performing this act an act of feminism? Why? and, if so, what type(s) of feminism?
· Was your act an act of activism? That is, could it help to create social change? If so, how?
Please see attached for Project 1, 2 & 3 for information and assistance.
Qualitative
Research
Methods:
A DATA CO L L E.
InstructionsClients come to MFTs because they want to change, .docxpauline234567
Instructions
Clients come to MFTs because they want to change, whether the change is in cognitions, structure, insight, or something else. Therefore, it is important for you to understanding why, when, and how people change. This week, you will continue the exploration of core concepts related to systems theory and its application to MFT field concepts. You will review several concepts associated with change including homeostasis, first-order change, second-order change, continuous change, and discontinuous change.
Complete the provided worksheet template located in this week’s resources. Note: You will use the worksheet you complete this week as part of your work in Week 4.
For each item, be sure to address the following:
· Record a direct quotation that defines the concept or describes the assumption.
· Paraphrase the definition or description by explaining the information in your own words. As you are paraphrasing, keep in mind that concepts often involve several interrelated ideas. When you are paraphrasing, be sure to not oversimplify the concept.
· Provide an original example (not one you read about in the course resources) of the concept or assumption.
· Explain how your example reflects the definition. Refer to your paraphrased definition in order to compare the example to the concept.
Should you have questions or need clarification on any items, please contact your professor to discuss it.
Length: 1-2 pages (completed template). Additional resources/reference page is not required.
Your cheat sheet should demonstrate thoughtful consideration of the ideas and concepts presented in the course by providing new thoughts and insights relating directly to this topic. Be sure to adhere to Northcentral University's Academic Integrity Policy.
Upload your document, and then click the
Submit to Dropbox button.
Building Blocks to Conceptualizing Family: A Family System’s Perspective Valerie Q. Glass, PhD, LMFT
Background of Systemic Thinking
Systemic thinking, for some, means trying on a new and unique lens when considering “presenting problems” that arise in therapeutic settings. Most mental and emotional health backgrounds study individual cognitive and emotional processes, systemic thinking means a shift in looking at one person to looking at a whole system. Keeney (1983) calls this change in professional theory an epistemological shift. Epistemology, most basically, is the way one understands what is in front of them, and the root with which decisions are made. Helping fields all develop from different epistemologies. Psychiatry views medicine and biology as their epistemological construct of how or why people act the way they do. Much of the epistemological focus of social work fields embraces the necessity or connecting to resources and social support as a catalyst for change. Psychology explores the make-up of the individual’s mind and develops steps for change. Family systems, and.
INST560, Internet of Things (IoT)UNIVERSITY OF NORTH AMERICA.docxpauline234567
INST560, Internet of Things (IoT)
UNIVERSITY OF NORTH AMERICA
Lecture 3: Fall 2022
Professor Aliakbar Jalali
[email protected]
1
Internet of Things Enabling Technologies
/59
UoNA-ST560-FALL-2022, Internet of Things (IoT)
Overview
Introduction
Evolution of the Technology
Some significant statistics
IoT Technology
Risks of IoT Technologies
Use Cases of IoT Technology!
What are IoT Enabling Technology
Conclusion
References
2
/59
UoNA-ST560-FALL-2022, Internet of Things (IoT)
Introduction
Because of technological changes taking place in the world, IoT is gradually taking over all the fields, and the future of the IoT applications are increasing day by day.
Technological advances are fueling the growth of IoT.
Technology improved communications and network, new sensors of various kinds; cheaper, denser, more reliable, and power efficient storage both in the cloud and locally are converging to enable new types of IoT based products that were not possible a few years ago.
IoT technology will further develop to make our day-to-day operations much easier and more remotely controlled in the days to come.
3
/59
UoNA-ST560-FALL-2022, Internet of Things (IoT)
Introduction
Businesses need to constantly explore IoT applications within their domain to stay ahead in competitiveness and implementation.
The competition will primarily define in the coming decade as how companies take advantage of innovative technology.
However, it is the dominant technology that determines the future of many businesses attached to the future of the internet of things (IoT).
4
/59
UoNA-ST560-FALL-2022, Internet of Things (IoT)
Introduction
The emerging trends in IoT are majorly driven by technologies like artificial intelligence, blockchain, 5G and edge computing.
We need to know more in detail about the elements that make up broad spectrum of technologies, we know as the Internet of Things.
Technological advances lies in the business value of IoT applications like smart wearables, smart homes and buildings, smart cities, autonomous cars, smart factories, location trackers, wireless sensors and much more.
5
/59
UoNA-ST560-FALL-2022, Internet of Things (IoT)
Introduction: Technology is changing the world!
Technology is changing the world.
It is changing the way we communicate, shop, learn, travel, play and of course the way we work.
http://www.telegraph.co.uk/technology/2017/05/06/internet-things-could-really-change-way-live/
6
/59
UoNA-ST560-FALL-2022, Internet of Things (IoT)
6
Introduction: Technology is changing the world!
7
Global gigabit subscriptions are expected to jump to 50 million in 2022, more than doubling from 24 million at the end of 2020, according to a new report from analyst firm Omdia.
High Speed Internet!
/59
UoNA-ST560-FALL-2022, Internet of Things (IoT)
Introduction: Social Media is Changing societies!
8
Are you on social media a lot? When is the last time you checked Twitter, Facebook, or Instagram? Last n.
Insert Prename, Surname of all studentsWinter Term 202223Theo.docxpauline234567
Insert Prename, Surname of all students
Winter Term 2022/23
Theory Factsheet: Insert name of theory
Level of analysis
Insert levels of analysis, e.g., organisation, individual, social
Dependent construct(s)
Please insert the dependent construct(s) of the theory
Independent construct(s)
Please insert the independent construct(s) of the theory
Short description of the theory
Please describe the theory in full sentences.
Cause-Effect Model
Please insert a visual diagram of the cause-effect relationships or factor model of the theory (if available).
Applications of the theory
Please describe for which purposes / in which fields the theory has been applied.
Which relevance does the theory have for digitalization in organizations?
Criticism
Describe alternative views, potential critique, and open discussion on the theory.
References
Insert sources and references used in this factsheet in APA 7th style.
Students will write a 2-3 pages essay analyzing one of the topics addressed during the semester under the section of Contemporary Issues: Human Rights. The student will be free to choose any of the topics discussed during class as well as his/her opinion about it.
1. Choose a topic (death penalty, assisted suicide, abortion, death by euthanasia, bioethics… etc.)
2. First page: description of the problem (is is here Fl, or national or worlwide, statistics, etc)
Second page: YOUR ETHICAL POSITION ABOUT IT (why is this an ethical issue, where your argument os coming from, etc)
3. REFERENCES (could be ppt, movie, article, web, book)
The writing will be evaluated for clarity and proper handling of terms, phrases, and concepts addressed up to this date. APA or MLA style will be required
https://owl.english.purdue.edu/owl/section/2/10/.
Reading listWinter semester 2022/23
Version 24.09.2022
Reading
Package
No.
Theories Papers
Information Systems Foundational Theories
Structuration Theory Orlikowski, W.J. (1992). The Duality of Technology: Rethinking the Concept of Technology in Organizations. Organization Science, 3 (3), 398-
427.
Structuration Theory Orlikowski, W.J. and Robey, D. (1991). Information Technology and the Structuring of Organizations. Information Systems Research, 2 (2),
143-169.
Structuration Theory Walsham, G. and Han, C.K. (1991) Structuration theory and information systems research. Journal of Applied Systems Analysis 17: 77-85.
Institutional Theory Barley, S.R and Tolbert, P.S. (1997). Institutionalization and structuration: studying the links between action and institution. Organization
Studies 18 (1): 93-118.
Institutional Theory Orlikowski, W. J., & Barley, S. R. (2001). Technology and institutions: What can research on information technology and research on
organizations learn from each other? MIS Quarterly, 25(2), 145.
Design Science Hevner, A. R., March, S. T., Park, J., & Ram, S. (2004). Design science in information systems research. MIS Quarterly, 28 (1), 75.
Informative SpeechCourse COM103 Public SpeakingCriteria.docxpauline234567
Informative Speech
Course: COM103 Public Speaking
Criteria Level 4 Level 3 Level 2 Level 1 Criterion Score
Introduction / 10
Material / 8
Transitions / 10
10 points
Introduction
contained a
strong
attention
getter,
introduction of
the topic,
credibility
statement, and
previewed the
speech.
7 points
Introduction
contained 3 of
the following:
a strong
attention
getter,
introduction of
the topic,
credibility
statement, and
previewed the
speech.
4 points
Introduction
contained 2 of
the following:
a strong
attention
getter,
introduction of
the topic,
credibility
statement, and
previewed the
speech.
0 points
Introduction
contained 1 of
the following:
a strong
attention
getter,
introduction of
the topic,
credibility
statement, and
previewed the
speech.
8 points
Material was
clear AND
well organized
5.6 points
Material was
either clear
OR well
organized
3.2 points
NA
0 points
Material was
neither clear
and well
organized
10 points
Transitions
were clear and
used after the
intro, between
each main idea
and before the
conclusion
7 points
Transitions
were clear, but
were not used
in all areas:
after the intro,
between each
main idea and
before the
conclusion
4 points
Transitions
used after the
intro, between
each main idea
and before the
conclusion,
but were not
effective
0 points
Transitions
were not used.
Rubric Assessment - COM103 Public Speaking - National University https://nationalu.brightspace.com/d2l/lms/competencies/rubric/rubrics_a...
1 of 4 12/6/22, 5:38 PM
Criteria Level 4 Level 3 Level 2 Level 1 Criterion Score
Conclusion / 8
Time limit / 8
Preparation
outline
uploaded
/ 8
8 points
The
conclusion
contained a
strong closing
AND the
speaker
signaled the
end of the
speech
5.6 points
The
conclusion
contained a
strong closing
OR the
speaker
signaled the
end of the
speech
3.2 points
The speaker
needs
improvement
signalling the
end of the
speech and a
stronger
closing.
0 points
The
conclusion
neither
contained a
strong closing
and the
speaker did
not signal the
end of the
speech
8 points
The length of
the speech
was between
5 and 6
minutes
5.6 points
NA
3.2 points
The length of
the speech
was shorter
than 5 minutes
or longer than
6 minutes
0 points
NA
8 points
The
preparation
outline was
uploaded with
the speech
5.6 points
The
preparation
outline was
uploaded after
delivering the
speech
3.2 points
The
preparation
outline was
not in a
preparation
outline format
0 points
The
preparation
outline was
not uploaded.
Rubric Assessment - COM103 Public Speaking - National University https://nationalu.brightspace.com/d2l/lms/competencies/rubric/rubrics_a...
2 of 4 12/6/22, 5:38 PM
Criteria Level 4 Level 3 Level 2 Level 1 Criterion Score
Eye Contact / 10
Delivery / 10
Non verbals / 10
Overall
preparation
/ 8
10 points
The speaker
had strong eye
contac.
How to Split Bills in the Odoo 17 POS ModuleCeline George
Bills have a main role in point of sale procedure. It will help to track sales, handling payments and giving receipts to customers. Bill splitting also has an important role in POS. For example, If some friends come together for dinner and if they want to divide the bill then it is possible by POS bill splitting. This slide will show how to split bills in odoo 17 POS.
How to Create Map Views in the Odoo 17 ERPCeline George
The map views are useful for providing a geographical representation of data. They allow users to visualize and analyze the data in a more intuitive manner.
Synthetic Fiber Construction in lab .pptxPavel ( NSTU)
Synthetic fiber production is a fascinating and complex field that blends chemistry, engineering, and environmental science. By understanding these aspects, students can gain a comprehensive view of synthetic fiber production, its impact on society and the environment, and the potential for future innovations. Synthetic fibers play a crucial role in modern society, impacting various aspects of daily life, industry, and the environment. ynthetic fibers are integral to modern life, offering a range of benefits from cost-effectiveness and versatility to innovative applications and performance characteristics. While they pose environmental challenges, ongoing research and development aim to create more sustainable and eco-friendly alternatives. Understanding the importance of synthetic fibers helps in appreciating their role in the economy, industry, and daily life, while also emphasizing the need for sustainable practices and innovation.
The Roman Empire A Historical Colossus.pdfkaushalkr1407
The Roman Empire, a vast and enduring power, stands as one of history's most remarkable civilizations, leaving an indelible imprint on the world. It emerged from the Roman Republic, transitioning into an imperial powerhouse under the leadership of Augustus Caesar in 27 BCE. This transformation marked the beginning of an era defined by unprecedented territorial expansion, architectural marvels, and profound cultural influence.
The empire's roots lie in the city of Rome, founded, according to legend, by Romulus in 753 BCE. Over centuries, Rome evolved from a small settlement to a formidable republic, characterized by a complex political system with elected officials and checks on power. However, internal strife, class conflicts, and military ambitions paved the way for the end of the Republic. Julius Caesar’s dictatorship and subsequent assassination in 44 BCE created a power vacuum, leading to a civil war. Octavian, later Augustus, emerged victorious, heralding the Roman Empire’s birth.
Under Augustus, the empire experienced the Pax Romana, a 200-year period of relative peace and stability. Augustus reformed the military, established efficient administrative systems, and initiated grand construction projects. The empire's borders expanded, encompassing territories from Britain to Egypt and from Spain to the Euphrates. Roman legions, renowned for their discipline and engineering prowess, secured and maintained these vast territories, building roads, fortifications, and cities that facilitated control and integration.
The Roman Empire’s society was hierarchical, with a rigid class system. At the top were the patricians, wealthy elites who held significant political power. Below them were the plebeians, free citizens with limited political influence, and the vast numbers of slaves who formed the backbone of the economy. The family unit was central, governed by the paterfamilias, the male head who held absolute authority.
Culturally, the Romans were eclectic, absorbing and adapting elements from the civilizations they encountered, particularly the Greeks. Roman art, literature, and philosophy reflected this synthesis, creating a rich cultural tapestry. Latin, the Roman language, became the lingua franca of the Western world, influencing numerous modern languages.
Roman architecture and engineering achievements were monumental. They perfected the arch, vault, and dome, constructing enduring structures like the Colosseum, Pantheon, and aqueducts. These engineering marvels not only showcased Roman ingenuity but also served practical purposes, from public entertainment to water supply.
Ethnobotany and Ethnopharmacology:
Ethnobotany in herbal drug evaluation,
Impact of Ethnobotany in traditional medicine,
New development in herbals,
Bio-prospecting tools for drug discovery,
Role of Ethnopharmacology in drug evaluation,
Reverse Pharmacology.
The Indian economy is classified into different sectors to simplify the analysis and understanding of economic activities. For Class 10, it's essential to grasp the sectors of the Indian economy, understand their characteristics, and recognize their importance. This guide will provide detailed notes on the Sectors of the Indian Economy Class 10, using specific long-tail keywords to enhance comprehension.
For more information, visit-www.vavaclasses.com
The Art Pastor's Guide to Sabbath | Steve ThomasonSteve Thomason
What is the purpose of the Sabbath Law in the Torah. It is interesting to compare how the context of the law shifts from Exodus to Deuteronomy. Who gets to rest, and why?
We all have good and bad thoughts from time to time and situation to situation. We are bombarded daily with spiraling thoughts(both negative and positive) creating all-consuming feel , making us difficult to manage with associated suffering. Good thoughts are like our Mob Signal (Positive thought) amidst noise(negative thought) in the atmosphere. Negative thoughts like noise outweigh positive thoughts. These thoughts often create unwanted confusion, trouble, stress and frustration in our mind as well as chaos in our physical world. Negative thoughts are also known as “distorted thinking”.
Nonparametric Test Chi-Square Test for Independence Th.docx
1. Nonparametric Test
Chi-Square Test for Independence
The test is used to determine whether two categorical variables
are independent.
Notation for the Chi-Square Test for Independence (Please note
that the notation varies
depending on the text)
O represents the observed frequency of an outcome
E represents the expected frequency of an outcome
r represents the number of rows in the contingency table
c represents the number of columns in the contingency table
n represents the total number of trials
Test Statistic
2
2
2. 1 1
O E
E
df r c
The Chi-Square test is a hypothesis test. There are seven steps
for a hypothesis test.
1. State the null hypothesis
2. State the alternative hypothesis
3. State the level of significance
4. State the test statistic
5. Calculate
6. Statistical Conclusion
7. Experimental Conclusion
Example
3. A university is interested to know if the choice of major has a
relationship to gender. A
random sample of 200 incoming freshmen students was taken
(100 male and 100
female). There major and gender were recorded. The results are
shown in the
contingency table below.
Major Female Male
Math 5 15
Nursing 44 10
English 10 10
Pre-Med 17 20
History 4 5
Education 15 20
Undecided 5 20
To determine if there is a relationship between the gender of a
freshmen student and
thei declared major perform the hypothesis test (Use level of
4. Step 1: Null Hypothesis
0 : Gender and Major of Freshmen students are independentH
Step 2: Alternative Hypothesis
: Gender and Major of Freshmen students are not
independentAH
Step 3: Level of Significance
Step 4: Test Statistic
2
2
1 1
O E
E
df r c
5. Step 5: Calculations
There are several calculations for this test. We have to find the
expected frequency for
each cell in the contingency table. The expected frequency is
the probability under the
null hypothesis times the total frequency for the given row.
Here the probability under
the null hypothesis is .5, as the probability of being male and
female is equal.
Major Female Male
Pre-
8. 2
.1216 .0556 .0556 .357 .357 4.5 4.5
The calculation for degrees of freedom is as follows:
9. 1 1 7 1 2 1
6 1 6
df r c
df
The critical value for the Chi-Square with 6 degrees of freedom
at a level of significance
Step 6: Statistical Conclusion
Since 2 2
then reject the
null hypothesis.
Step 7: Experimental Conclusion
There is sufficient evidence to indicate that gender has an effect
on choice of major for
the incoming freshmen.
10. Mann-Whitney
The Mann-Whitney test is a nonparametric version of the
independent sample t-test.
This study is used when there are two independent samples of
ordinal scores.
Test Statistic
1 1
1 1 2 1
2 2
2 1 2 2
1
2
1
2
n n
U n n R
n n
11. U n n R
Notation:
1
2
1
2
number of scores in group 1
n number of score in group 2
R sum of ranks for score in group 1
R sum of ranks for score in group 2
12. The Mann-Whitney test is a hypothesis test. There are seven
steps for a hypothesis
test.
1. State the null hypothesis
2. State the alternative hypothesis
3. State the level of significance
4. State the test statistic
5. Calculate
6. Statistical Conclusion
7. Experimental Conclusion
Example:
Suppose there was race between an Antelope and a mountain
lion. The Antelope won
but you want to know if this could be extended to a general
statement that Antelope will
win in a race against a mountain lion. A random sample of 10
Antelopes and 10
mountain lions are put in a race. The order in which they finish
is recorded. ( A for
antelope and L for mountain lion)
13. AALALLLAAALAALLAALLL
Step 1: Null Hypothesis
0 : Probability of the Antelope winning is no different than the
probalility of the
mountain lion wining the race.
H
Step 2: Alternative Hypothesis
: Probability of the Antelope winning is different than the
probalility of the
mountain lion wining the race.
AH
Step 3: Level of Significance
Step 4: Test Statistic
14. 1 1
1 1 2 1
2 2
2 1 2 2
1
2
1
2
n n
U n n R
n n
U n n R
Step 5: Calculations
The results are ranked according to the in order in which they
finished the race.
Rank
15. A 1
A 2
L 3
A 4
L 5
L 6
L 7
A 8
A 9
A 10
L 11
A 12
A 13
L 14
L 15
A 16
A 17
L 18
16. L 19
L 20
Let the Antelope be sample one and the mountain lion be
sample 2.
1
2
1
2
number of scores for the Antelopes
n number of score for the mountain lions
R sum of ranks for score for the Antelopes
R sum of ranks for score for the mountain lions
17. Find the sum of the ranks for each group.
Antelope
Mountain
Lion
1 3
2 5
4 6
8 7
9 11
10 14
12 15
13 18
16 19
17 20
Sum 92 118
The number of for each animal is 10 because 10 antelopes and
10 mountain lions
raced.
Now plug the information into the test statistic
19. 10 10 1
10 10 92
2
100 55 92
63
1
2
10 10 1
10 10 118
2
100 55 118
37
n n
U n n R
U
U
U
n n
U n n R
U
20. U
U
Find the critical value for the test statistic. Use the appropriate
U table found in the
appendix of the textbook. Look for alpha to be 0.05 and then the
number of scores for
each category to be 10. Then you see the following critical
values.
21. 1,
2,
23
77
crit
crit
U
U
Step 6: Statistical Conclusion
The statistical conclusion tells whether to reject or fail to reject
the null hypothesis. The
rejection rule is as follow.
1
2
If then reject the null hypothesis
22. If then reject the null hypothesis
crit
crit
U U
U U
he null
then fail to reject the null hypothesis.
Step 7: Experimental Conclusion
Since we failed to reject the null hypothesis we can say that
there is not significant
evidence to support the claim that the probability of the
antelope winning is any different
than the probability of the mountain lion winning the race.
Kruskal-Wallis Test
23. The Kruskal-Wallis Test is a nonparametric version of the one-
way ANOVA. This test
however does not assume normality or homogeneity of variance.
The test requires
ordinal scaling of the dependent variable and must have at least
5 data values in each
sample.
Notation
k number of sample or groups
n number of data values in each group
N number of data values in all samples combined
R sum of the ranks for each sample
Test Statistic
2
2 12
3 1
1
24. 1
R
N
N N n
df k
The Kruskal-Wallis test is a hypothesis test. There are seven
steps for a hypothesis
test.
1. State the null hypothesis
2. State the alternative hypothesis
3. State the level of significance
4. State the test statistic
5. Calculate
6. Statistical Conclusion
25. 7. Experimental Conclusion
Example
A gym has decided to recommend a diet to their clients. They
have narrowed down the
choice to three and they want to test which diet is best. They
have randomly selected 21
volunteers from the gym to participate in the diet. All the
participants have similar health
and body type as well as general exercise routine. The amount
of weight loss was
recorded.
Diet A Diet B Diet C
10 11 1
12 4 8
13 2 17
7 6 0
3 16 16
15 9 18
5 14 19
26. Step 1: Null Hypothesis
0 : There is no difference amoung the dietsH
Step 2: Alternative Hypothesis
: There is a difference between the dietsAH
Step 3: Level of Significance
Step 4: Test Statistic
2
2 12
3 1
1
1
R
N
N N n
df k
27. Step 5: Calculations
To perform the calculation, start by ranking the results.
Diet A Rank Diet B Rank Diet C Rank
10 11 11 12 1 2
12 13 4 5 8 9
13 14 2 3 17 19
7 8 6 7 0 1
3 4 16 17 16 17
15 16 9 10 18 20
5 6 14 15 19 21
Notice that some data values have the same ranks. This is how
you account for data
28. values that are the same.
k = 3
n = 7
N = 21
Plug these values into the test statistic
2
2
2 2 2
2
31. The critical value can be found using the Chi-Square table for
freedom.
2
Step 6: Statistical Conclusion
Since 2 2
0.05, 20.2931 5.9
reject the null hypothesis.
Step 7: Experimental Conclusion
The evidence does not support the claim that the there is a
significant difference
32. between the three diets at a level of significance of 0.05.
1
Walton-Fisette/Wuest: Foundations of Physical Education,
Exercise, Science, And Sport, 20e
Chapter 15
Future Professionals as Leaders and Advocates
Chapter Overview
Professionals in physical education, exercise science, and sport
need to be leaders in their disciplines and advocates for change.
Professionals are in a unique position to take an active role in
responding to society’s needs and engaging its members in
physical activity so that they can realize the powerful health
benefits. Professionals have the responsibility to educate the
public about the benefits of physical activity and fitness, and
they must make a greater effort to disseminate a national
message about the relationship between physical activity and
health. Collaborative, committed leadership is essential in
reducing physical inactivity and promoting a physically active
lifestyle.
Advocacy is an important responsibility of physical education,
exercise science, and sport professionals. Advocates need a
strong voice to clearly articulate the benefits of participation in
quality physical education, exercise science, and sport
programs. Professionals also need to work as agents for social
change in reducing the health disparities and inequities
experienced by individuals based on their gender, race,
ethnicity, (dis)ability, sexual orientation, and socioeconomic
33. status within the physical education, exercise science, and
sporting communities.
Learning Objectives
After reading this chapter, students should be able to
accomplish the following:
1. Discuss the importance of leadership relative to lifespan
participation in physical activity, fitness, physical education,
and sport.
2. Describe how professionals can be leaders of physical
activity, fitness, physical education, and sport.
3. Explain the importance of advocacy in a variety of physical
activity settings.
4. Describe how professionals can be advocates of physical
activity, fitness, physical education, and sport.
5. Identify current and future trends that professionals will
encounter in relation to physical activity, fitness, physical
education, and sport.
Chapter Outline
I. Leadership in Physical Activity
A. Leadership in Physical Education and Youth Sport
B. Advocacy
II. Current and Future Trends
Discussion Questions
1. How can professionals demonstrate leadership in promoting
lifespan participation in physical activity and fitness?
2. How can physical educators, exercise scientists, and sport
leaders advocate for their profession at the local, state, and
national levels?
35. Chapter Overview
Sport has developed into a big business, creating a myriad of
career opportunities for qualified individuals. Individuals
interested in sport management may pursue careers as athletic
directors, directors of intramurals and campus recreation,
directors of corporate recreation, and sport facilities managers.
Sports sales and sports marketing may be attractive careers to
some individuals. Managerial opportunities are also available in
professional organizations.
The intensity of interest in sport in the American society,
coupled with the growth of the communication media, has
resulted in the expansion of career opportunities in the field of
sport media. Individuals interested in this area can pursue
careers in sport broadcasting, sportswriting, sport journalism,
sport photography, sports information, and web
development/social media.
Talented individuals may elect to pursue careers as performers.
Other sport-related careers that may be attractive to qualified
individuals are sport officiating and sport law. Sport analytics is
a growing career. Some professionals choose to use their skills
to develop their own businesses.
Individuals interested in these careers can use many strategies
to enhance their professional marketability. Taking course work
in supporting areas and gaining practical experience help
individuals attain the position that they desire after graduation.
Learning Objectives
After reading this chapter, students should be able to
accomplish the following:
36. 1. Identify opportunities for professionals in sport management
and entry-level positions in these careers.
2. Describe expanding career opportunities in sport media.
3. Describe career opportunities in performance and other sport-
related careers.
4. Discuss how professionals can increase their professional
marketability.
Chapter Outline
I. Sport Management
II. Careers in Sport Management
A. Athletic Administration
B. Collegiate Recreation
C. Corporate Recreation
D. Sport Facilities Management
E. Sport Retailing
F. Sports Marketing
G. Career Opportunities in Professional and Sport Organizations
H. Sport Analytics
III. Careers in Sport Media
A. Sport Broadcasting
B. Sportswriting and Journalism
C. Sport Photography
D. Sports Information
E. Web Development and Social Media
IV. Performance and Other Sport Careers
A. Dance
B. Professional Athletics
C. Officiating
D. Sport Law and Agency
E. Entrepreneurship
37. V. Increasing Your Professional Marketability
Discussion Questions
1. How have new technologies contributed to the development
of sport and opportunities for viewing and promoting sport
events?
2. Discuss the administration of athletic programs and collegiate
recreation programs on your campus. What titles do the
directors of these programs hold? How many participants are
involved in these programs and what activities are offered? Do
you have any suggestions for additional activities?
3. Within your institution, discuss opportunities for recreational
sports—intramurals, clubs, and competitions. Who manages
these programs? What are the guidelines governing
participation?
4. Access the Institute for Diversity and Ethics in Sport (
https://www.tidesport.org/). Review the latest Race and
Gender Report Cards. Discuss your findings relative to hiring
practices and representation in different sport organizations.
5. Are eSports really sport?
6. Discuss each of the talking points identified in the social
justice box in the text. In addition, what other issues related to
social justice need to be addressed as they relate to careers in
sport? What specific steps could you take to address issues
related to social justice?
7. Discuss each of the trends identified in the current trends box
in the text. What is one trend you see today in related to careers
in sport that will impact you and/or your career path in the
38. future?
Self-Assessment Activities
These activities are designed to help students determine if they
have mastered the materials and competencies presented in this
chapter.
1. Blogging is a popular way for professionals and fans to share
news on what is happening in sports. Using one of the free
blogging sites, create a blog on a specific theme or sport,
adding at least four posts on your topic. Share your blog with
other people in your class and invite them to comment.
2. If possible, interview individuals working in sport
management positions. Ask each person to define his or her
responsibilities and the skills that are the most helpful in the
performance of the job. Determine the entry-level positions in
this area. Ask each individual for suggestions about advancing
to top-level managerial positions in the field.
3. Discuss the positive and negative aspects of pursuing a
performance career. Since performance careers may be of short
duration, how can individuals prepare for another career after
the culmination of their performance career? Select one
professional athlete in any sport and research his or her
background. Trace the athlete’s career path, starting from their
beginning interest in the sport to the current time. Be sure to
include information about the athlete’s education.
4. Using the information provided in the Get Connected box,
locate an article on a topic of interest related to sport
management, sport media, dance, officiating, or athletics. Write
a brief summary of the article, identifying five key points and
what you have learned.
40. The recognition that participation in movement and physical
activities has therapeutic and psychological benefits as well as
physical benefits has stimulated the growth of therapy-related
careers. These include careers as dance therapists, recreational
therapists, and physical therapists. Kinesiotherapy and
chiropractic are also potential careers for professionals willing
to continue their studies.
If one is seeking employment in fitness- and health-related
careers, one can increase one’s marketability by becoming
certified and taking additional course work in health, business,
and psychology. Gaining as much practical experience as
possible will also be an asset in securing employment.
It appears that opportunities for qualified individuals in fitness-
and health-related careers will continue to increase in the
future.
Learning Objectives
After reading this chapter, students should be able to
accomplish the following:
1. Discuss the responsibilities, opportunities, and preparation
for professionals interested in working in a fitness- or health-
related career.
2. Describe the opportunities available and preparation needed
by professionals desiring to pursue a therapy-related career.
3. Discuss the various strategies that can be used to enhance
one’s professional marketability in fitness-, health-, and
therapy-related careers.
Chapter Outline
I. Fitness- and Exercise-Related Careers
A. Worksite Wellness Programs
41. B. Commercial and Community Fitness Programs
C. Personal Trainers
D. Health and Wellness Coaches
E. Strength and Conditioning Professionals
F. Rehabilitation Programs
G. Career Preparation
Preparation
Certification
Professional Organizations
II. Health-Related Careers
A. Athletic Training
B. Health and Weight Management Clubs and Spas
III. Therapy-Related Careers
A. Dance/Movement Therapy
B. Therapeutic Recreation/Recreation Therapy
C. Kinesiotherapy
D. Physical Therapy
E. Chiropractic Care
IV. Increasing Your Professional Marketability
Discussion Questions
1. Fitness and health clubs have gained in popularity. However,
more than one-third of health club members have a household
income of more than $100,000 a year and the average income is
over $80,000 a year. What can professionals do to reach more
individuals whose income is less than the average and provide
opportunities for them to be physically active?
2. Should health clubs be mandated to hire only certified fitness
professionals? Explain your reasoning. If you believe that
health clubs should hire only certified fitness professionals,
from what organizations would you accept certifications and
42. why?
3. Worksite wellness programs continue to grow, stimulated in
part by the Affordable Care Act. Should employees be mandated
to participate in these programs to reduce the burden of health
care costs? Why or why not?
4. Discuss each of the talking points identified in the social
justice box in the text. In addition, what other issues related to
social justice need to be addressed as they relate to health and
fitness-related careers? What specific steps could you take to
address issues related to social justice?
5. Discuss each of the trends identified in the current trends box
in the text. What is one trend you see today regarding health-
and fitness-related careers that will impact you and/or your
career path in the future?
Self-Assessment Activities
These activities are designed to help students determine if they
have mastered the materials and competencies presented in this
chapter.
1. Describe the responsibilities of a fitness or exercise
specialist. If possible, interview a professional in this career
regarding his or her responsibilities and qualifications.
2. Describe the various employment opportunities for a fitness
or exercise professional. Search for jobs online; describe the
positions that you found available and qualifications required
for employment.
3. Using the information provided in the Get Connected box,
read about one of the certification programs available through
the American College of Sports Medicine, American Council on
44. c represents the number of columns in the contingency table
n represents the total number of trials
Test Statistic
2
2
1 1
O E
E
df r c
The Chi-Square test is a hypothesis test. There are seven steps
for a hypothesis test.
1. State the null hypothesis
45. 2. State the alternative hypothesis
3. State the level of significance
4. State the test statistic
5. Calculate
6. Statistical Conclusion
7. Experimental Conclusion
Example
A university is interested to know if the choice of major has a
relationship to gender. A
random sample of 200 incoming freshmen students was taken
(100 male and 100
female). There major and gender were recorded. The results are
shown in the
contingency table below.
Major Female Male
Math 5 15
Nursing 44 10
English 10 10
46. Pre-Med 17 20
History 4 5
Education 15 20
Undecided 5 20
To determine if there is a relationship between the gender of a
freshmen student and
thei declared major perform the hypothesis test (Use level of
Step 1: Null Hypothesis
0 : Gender and Major of Freshmen students are independentH
Step 2: Alternative Hypothesis
: Gender and Major of Freshmen students are not
independentAH
Step 3: Level of Significance
Step 4: Test Statistic
47. 2
2
1 1
O E
E
df r c
Step 5: Calculations
There are several calculations for this test. We have to find the
expected frequency for
each cell in the contingency table. The expected frequency is
the probability under the
null hypothesis times the total frequency for the given row.
Here the probability under
the null hypothesis is .5, as the probability of being male and
female is equal.
51. The calculation for degrees of freedom is as follows:
1 1 7 1 2 1
6 1 6
df r c
df
The critical value for the Chi-Square with 6 degrees of freedom
at a level of significance
s 12.592. This is found by using the Chi Square table.
Step 6: Statistical Conclusion
Since 2 2
52. null hypothesis.
Step 7: Experimental Conclusion
There is sufficient evidence to indicate that gender has an effect
on choice of major for
the incoming freshmen.
Mann-Whitney
The Mann-Whitney test is a nonparametric version of the
independent sample t-test.
This study is used when there are two independent samples of
ordinal scores.
Test Statistic
1 1
1 1 2 1
2 2
53. 2 1 2 2
1
2
1
2
n n
U n n R
n n
U n n R
Notation:
1
2
1
2
number of scores in group 1
54. n number of score in group 2
R sum of ranks for score in group 1
R sum of ranks for score in group 2
The Mann-Whitney test is a hypothesis test. There are seven
steps for a hypothesis
test.
1. State the null hypothesis
2. State the alternative hypothesis
3. State the level of significance
4. State the test statistic
5. Calculate
6. Statistical Conclusion
7. Experimental Conclusion
Example:
55. Suppose there was race between an Antelope and a mountain
lion. The Antelope won
but you want to know if this could be extended to a general
statement that Antelope will
win in a race against a mountain lion. A random sample of 10
Antelopes and 10
mountain lions are put in a race. The order in which they finish
is recorded. ( A for
antelope and L for mountain lion)
AALALLLAAALAALLAALLL
Step 1: Null Hypothesis
0 : Probability of the Antelope winning is no different than the
probalility of the
mountain lion wining the race.
H
Step 2: Alternative Hypothesis
: Probability of the Antelope winning is different than the
probalility of the
mountain lion wining the race.
56. AH
Step 3: Level of Significance
Step 4: Test Statistic
1 1
1 1 2 1
2 2
2 1 2 2
1
2
1
2
n n
U n n R
n n
U n n R
57. Step 5: Calculations
The results are ranked according to the in order in which they
finished the race.
Rank
A 1
A 2
L 3
A 4
L 5
L 6
L 7
A 8
A 9
A 10
L 11
58. A 12
A 13
L 14
L 15
A 16
A 17
L 18
L 19
L 20
Let the Antelope be sample one and the mountain lion be
sample 2.
1
2
1
2
number of scores for the Antelopes
n number of score for the mountain lions
59. R sum of ranks for score for the Antelopes
R sum of ranks for score for the mountain lions
Find the sum of the ranks for each group.
Antelope
Mountain
Lion
1 3
2 5
4 6
8 7
9 11
10 14
12 15
13 18
60. 16 19
17 20
Sum 92 118
The number of for each animal is 10 because 10 antelopes and
10 mountain lions
raced.
Now plug the information into the test statistic
1 1
1 1 2 1
1
1
1
63. Find the critical value for the test statistic. Use the appropriate
U table found in the
appendix of the textbook. Look for alpha to be 0.05 and then the
number of scores for
each category to be 10. Then you see the following critical
values.
1,
2,
23
77
crit
crit
U
U
64. Step 6: Statistical Conclusion
The statistical conclusion tells whether to reject or fail to reject
the null hypothesis. The
rejection rule is as follow.
1
2
If then reject the null hypothesis
crit
crit
U U
U U
then fail to reject the null hypothesis.
Step 7: Experimental Conclusion
65. Since we failed to reject the null hypothesis we can say that
there is not significant
evidence to support the claim that the probability of the
antelope winning is any different
than the probability of the mountain lion winning the race.
Kruskal-Wallis Test
The Kruskal-Wallis Test is a nonparametric version of the one-
way ANOVA. This test
however does not assume normality or homogeneity of variance.
The test requires
ordinal scaling of the dependent variable and must have at least
5 data values in each
sample.
Notation
k number of sample or groups
n number of data values in each group
N number of data values in all samples combined
R sum of the ranks for each sample
66. Test Statistic
2
2 12
3 1
1
1
R
N
N N n
df k
The Kruskal-Wallis test is a hypothesis test. There are seven
steps for a hypothesis
67. test.
1. State the null hypothesis
2. State the alternative hypothesis
3. State the level of significance
4. State the test statistic
5. Calculate
6. Statistical Conclusion
7. Experimental Conclusion
Example
A gym has decided to recommend a diet to their clients. They
have narrowed down the
choice to three and they want to test which diet is best. They
have randomly selected 21
volunteers from the gym to participate in the diet. All the
participants have similar health
and body type as well as general exercise routine. The amount
of weight loss was
recorded.
Diet A Diet B Diet C
10 11 1
68. 12 4 8
13 2 17
7 6 0
3 16 16
15 9 18
5 14 19
Step 1: Null Hypothesis
0 : There is no difference amoung the dietsH
Step 2: Alternative Hypothesis
: There is a difference between the dietsAH
Step 3: Level of Significance
Step 4: Test Statistic
2
69. 2 12
3 1
1
1
R
N
N N n
df k
Step 5: Calculations
To perform the calculation, start by ranking the results.
Diet A Rank Diet B Rank Diet C Rank
10 11 11 12 1 2
12 13 4 5 8 9
70. 13 14 2 3 17 19
7 8 6 7 0 1
3 4 16 17 16 17
15 16 9 10 18 20
5 6 14 15 19 21
Notice that some data values have the same ranks. This is how
you account for data
values that are the same.
k = 3
n = 7
N = 21
Plug these values into the test statistic
73. The critical value can be found using the Chi-Square table for
freedom.
2
74. Step 6: Statistical Conclusion
Since 2 2
reject the null hypothesis.
Step 7: Experimental Conclusion
The evidence does not support the claim that the there is a
significant difference
between the three diets at a level of significance of 0.05.
Nonparametric Test
Chi-Square Test for Independence
The test is used to determine whether two categorical variables
are independent.
Notation for the Chi-Square Test for Independence (Please note
that the notation varies
depending on the text)
O represents the observed frequency of an outcome
75. E represents the expected frequency of an outcome
r represents the number of rows in the contingency table
c represents the number of columns in the contingency table
n represents the total number of trials
Test Statistic
2
2
1 1
O E
E
df r c
76. The Chi-Square test is a hypothesis test. There are seven steps
for a hypothesis test.
1. State the null hypothesis
2. State the alternative hypothesis
3. State the level of significance
4. State the test statistic
5. Calculate
6. Statistical Conclusion
7. Experimental Conclusion
Example
A university is interested to know if the choice of major has a
relationship to gender. A
random sample of 200 incoming freshmen students was taken
(100 male and 100
female). There major and gender were recorded. The results are
shown in the
contingency table below.
Major Female Male
Math 5 15
77. Nursing 44 10
English 10 10
Pre-Med 17 20
History 4 5
Education 15 20
Undecided 5 20
To determine if there is a relationship between the gender of a
freshmen student and
thei declared major perform the hypothesis test (Use level of
Step 1: Null Hypothesis
0 : Gender and Major of Freshmen students are independentH
Step 2: Alternative Hypothesis
: Gender and Major of Freshmen students are not
independentAH
Step 3: Level of Significance
Step 4: Test Statistic
78. 2
2
1 1
O E
E
df r c
Step 5: Calculations
There are several calculations for this test. We have to find the
expected frequency for
each cell in the contingency table. The expected frequency is
the probability under the
null hypothesis times the total frequency for the given row.
Here the probability under
79. the null hypothesis is .5, as the probability of being male and
female is equal.
Major Female Male
Pre-
Know calculate the test statistic.
82. 2
.1216 .0556 .0556 .357 .357 4.5 4.5
The calculation for degrees of freedom is as follows:
1 1 7 1 2 1
6 1 6
df r c
df
The critical value for the Chi-Square with 6 degrees of freedom
at a level of significance
by using the Chi Square table.
83. Step 6: Statistical Conclusion
Since 2 2
null hypothesis.
Step 7: Experimental Conclusion
There is sufficient evidence to indicate that gender has an effect
on choice of major for
the incoming freshmen.
Mann-Whitney
The Mann-Whitney test is a nonparametric version of the
independent sample t-test.
This study is used when there are two independent samples of
ordinal scores.
Test Statistic
1 1
84. 1 1 2 1
2 2
2 1 2 2
1
2
1
2
n n
U n n R
n n
U n n R
Notation:
1
2
1
85. 2
number of scores in group 1
n number of score in group 2
R sum of ranks for score in group 1
R sum of ranks for score in group 2
The Mann-Whitney test is a hypothesis test. There are seven
steps for a hypothesis
test.
1. State the null hypothesis
2. State the alternative hypothesis
3. State the level of significance
4. State the test statistic
5. Calculate
6. Statistical Conclusion
86. 7. Experimental Conclusion
Example:
Suppose there was race between an Antelope and a mountain
lion. The Antelope won
but you want to know if this could be extended to a general
statement that Antelope will
win in a race against a mountain lion. A random sample of 10
Antelopes and 10
mountain lions are put in a race. The order in which they finish
is recorded. ( A for
antelope and L for mountain lion)
AALALLLAAALAALLAALLL
Step 1: Null Hypothesis
0 : Probability of the Antelope winning is no different than the
probalility of the
mountain lion wining the race.
H
Step 2: Alternative Hypothesis
: Probability of the Antelope winning is different than the
87. probalility of the
mountain lion wining the race.
AH
Step 3: Level of Significance
Step 4: Test Statistic
1 1
1 1 2 1
2 2
2 1 2 2
1
2
1
2
n n
U n n R
88. n n
U n n R
Step 5: Calculations
The results are ranked according to the in order in which they
finished the race.
Rank
A 1
A 2
L 3
A 4
L 5
L 6
L 7
A 8
A 9
89. A 10
L 11
A 12
A 13
L 14
L 15
A 16
A 17
L 18
L 19
L 20
Let the Antelope be sample one and the mountain lion be
sample 2.
1
2
1
2
90. number of scores for the Antelopes
n number of score for the mountain lions
R sum of ranks for score for the Antelopes
R sum of ranks for score for the mountain lions
Find the sum of the ranks for each group.
Antelope
Mountain
Lion
1 3
2 5
4 6
8 7
9 11
10 14
91. 12 15
13 18
16 19
17 20
Sum 92 118
The number of for each animal is 10 because 10 antelopes and
10 mountain lions
raced.
Now plug the information into the test statistic
1 1
1 1 2 1
1
94. Find the critical value for the test statistic. Use the appropriate
U table found in the
appendix of the textbook. Look for alpha to be 0.05 and then the
number of scores for
each category to be 10. Then you see the following critical
values.
1,
2,
23
77
crit
crit
U
U
95. Step 6: Statistical Conclusion
The statistical conclusion tells whether to reject or fail to reject
the null hypothesis. The
rejection rule is as follow.
1
2
If then reject the null hypothesis
crit
crit
U U
U U
96. then fail to reject the null hypothesis.
Step 7: Experimental Conclusion
Since we failed to reject the null hypothesis we can say that
there is not significant
evidence to support the claim that the probability of the
antelope winning is any different
than the probability of the mountain lion winning the race.
Kruskal-Wallis Test
The Kruskal-Wallis Test is a nonparametric version of the one-
way ANOVA. This test
however does not assume normality or homogeneity of variance.
The test requires
ordinal scaling of the dependent variable and must have at least
5 data values in each
sample.
Notation
k number of sample or groups
n number of data values in each group
97. N number of data values in all samples combined
R sum of the ranks for each sample
Test Statistic
2
2 12
3 1
1
1
R
N
N N n
df k
98. The Kruskal-Wallis test is a hypothesis test. There are seven
steps for a hypothesis
test.
1. State the null hypothesis
2. State the alternative hypothesis
3. State the level of significance
4. State the test statistic
5. Calculate
6. Statistical Conclusion
7. Experimental Conclusion
Example
A gym has decided to recommend a diet to their clients. They
have narrowed down the
choice to three and they want to test which diet is best. They
have randomly selected 21
volunteers from the gym to participate in the diet. All the
participants have similar health
and body type as well as general exercise routine. The amount
of weight loss was
recorded.
99. Diet A Diet B Diet C
10 11 1
12 4 8
13 2 17
7 6 0
3 16 16
15 9 18
5 14 19
Step 1: Null Hypothesis
0 : There is no difference amoung the dietsH
Step 2: Alternative Hypothesis
: There is a difference between the dietsAH
Step 3: Level of Significance
Step 4: Test Statistic
100. 2
2 12
3 1
1
1
R
N
N N n
df k
Step 5: Calculations
To perform the calculation, start by ranking the results.
Diet A Rank Diet B Rank Diet C Rank
101. 10 11 11 12 1 2
12 13 4 5 8 9
13 14 2 3 17 19
7 8 6 7 0 1
3 4 16 17 16 17
15 16 9 10 18 20
5 6 14 15 19 21
Notice that some data values have the same ranks. This is how
you account for data
values that are the same.
k = 3
n = 7
N = 21
Plug these values into the test statistic
103. 12
740.571 680.143 1131.571 66
462
.025974 2552.285 66
66.293 66
0.2931
1 3 1 2
obs
obs
obs
obs
obs
obs
R
N
N N n
df k
104. The critical value can be found using the Chi-Square table for
d 2 degrees of
105. freedom.
2
Step 6: Statistical Conclusion
Since 2 2
reject the null hypothesis.
Step 7: Experimental Conclusion
The evidence does not support the claim that the there is a
significant difference
between the three diets at a level of significance of 0.05.