
Recommended
Recommended
More Related Content
Similar to Use the 5-step procedure for all problemsEach of the 5 steps.docx
Similar to Use the 5-step procedure for all problemsEach of the 5 steps.docx (20)
More from dickonsondorris
More from dickonsondorris (20)
Recently uploaded
Recently uploaded (20)
Use the 5-step procedure for all problemsEach of the 5 steps.docx
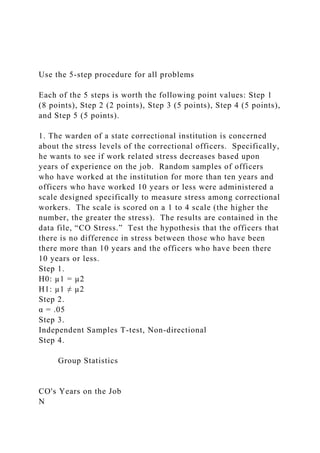
- 1. Use the 5-step procedure for all problems Each of the 5 steps is worth the following point values: Step 1 (8 points), Step 2 (2 points), Step 3 (5 points), Step 4 (5 points), and Step 5 (5 points). 1. The warden of a state correctional institution is concerned about the stress levels of the correctional officers. Specifically, he wants to see if work related stress decreases based upon years of experience on the job. Random samples of officers who have worked at the institution for more than ten years and officers who have worked 10 years or less were administered a scale designed specifically to measure stress among correctional workers. The scale is scored on a 1 to 4 scale (the higher the number, the greater the stress). The results are contained in the data file, “CO Stress.” Test the hypothesis that the officers that there is no difference in stress between those who have been there more than 10 years and the officers who have been there 10 years or less. Step 1. H0: µ1 = µ2 H1: µ1 ≠ µ2 Step 2. α = .05 Step 3. Independent Samples T-test, Non-directional Step 4. Group Statistics CO's Years on the Job N
- 2. Mean Std. Deviation Std. Error Mean Stress Level Score 10 years or less 21 2.1429 .79282 .17301 More than 10 years 21 2.4762 .92839 .20259 Independent Samples Test Levene's Test for Equality of Variances t-test for Equality of Means F Sig. t df Sig. (2-tailed) Mean Difference Std. Error Difference 95% Confidence Interval of the Difference
- 3. Lower Upper Stress Level Score Equal variances assumed 1.725 .197 -1.251 40 .218 -.33333 .26641 -.87177 .20510 Equal variances not assumed -1.251 39.043 .218 -.33333 .26641 -.87218 .20552 Step 5. This is not statistically significant because p=.218. T (40) = - 1.251, p > .05. Therefore we fail to reject H0
- 4. 2. A study is being done on the change in anxiety that occurs throughout a graduate statistics class. A group of 20 students were administered an anxiety score before the first lesson of their class and right after the last unit. Higher scores indicate greater anxiety. Using the data below, test the hypothesis that there is no difference in anxiety scores. Student First Lesson Last Lesson 1 1 2 2 2 4 3 1 6 4 3 2 5 4 5 6 7 9 7 6 6 8 4 3 9
- 6. Step 1. H0: µ1 = µ2 H1: µ1 ≠ µ2 Step 2. α = .05 Step 3. Dependent or Paired Samples T-test, Non Directional Step 4. Paired Samples Statistics Mean N Std. Deviation Std. Error Mean Pair 1 FirstLesson 3.4500 20 2.03845 .45581 LastLesson 4.7000 20 2.55672 .57170 Paired Samples Test Paired Differences t df Sig. (2-tailed) Mean
- 7. Std. Deviation Std. Error Mean 95% Confidence Interval of the Difference Lower Upper Pair 1 FirstLesson – LastLesson -1.25000 2.07428 .46382 -2.22079 -.27921 -2.695 19 .014 Step 5. t(19) = -2.695, p = .014, p < .05. We reject H0. There was a difference in anxiety between the first lesson and the second lesson. 3. A research project was conducted on the relationships between stereotypes and sentencing of offenders convicted of a terrorist act. Subjects in this study read a scenario describing the arrest and conviction of a man who was found to have bomb
- 8. making materials and was planning a suicide bombing in a large, suburban shopping mall. Subjects one of three versions of the case in which the perpetrator was described as either: African American, Caucasian or Middle Eastern. (a) Test the hypothesis that there is no difference in the sentence administered to all three types of offenders and display the means in a bar graph. (b) If there is a significant difference for sentence, indicate where the significant differences were for each of the three groups. (c) Determine the effect size for offender ethnicity. (d) Based on all of these results, would you make any recommendations to the Justice Department about investigating bias in sentencing? Why or why not? (5) African American Caucasian Middle Eastern 6 5 2 5 5 5 4 6 5 5 5 6 5 6 2 2 6 2 6 7
- 10. 5 5 6 6 Step 1. Ho: µ1 = µ2 = µ3 H1: µ1 ≠ µ2 ≠ µ3 Step 2. α = .05 Step 3. ANOVA Step 4. Descriptives Sentence N Mean Std. Deviation Std. Error 95% Confidence Interval for Mean Minimum Maximum Lower Bound Upper Bound AfricanAmerican 20
- 12. Sentence Sum of Squares df Mean Square F Sig. Between Groups 17.733 2 8.867 4.238 .019 Within Groups 119.250 57 2.092 Total 136.983 59 Step 5. F (2, 57) =4.238, p=.019. p < .05, Therefore, we reject the null hypothesis because the data is statistically significant, showing that there is a difference. Multiple Comparisons Dependent Variable: Sentence
- 13. Tukey HSD (I) Race (J) Race Mean Difference (I-J) Std. Error Sig. 95% Confidence Interval Lower Bound Upper Bound AfricanAmerican Caucasian -.10000 .45740 .974 -1.2007 1.0007 MiddleEastern 1.10000 .45740 .050 -.0007 2.2007 Caucasian AfricanAmerican .10000 .45740 .974 -1.0007 1.2007
- 14. MiddleEastern 1.20000(*) .45740 .030 .0993 2.3007 MiddleEastern AfricanAmerican -1.10000 .45740 .050 -2.2007 .0007 Caucasian -1.20000(*) .45740 .030 -2.3007 -.0993 * The mean difference is significant at the .05 level. There is a statistical significance between African Americans & Middle Eastern as well as between Caucasians and Middle Easterners. η2= 17.733/136.983 = .13 This is not a very strong statistic. We can say that 13% of the variation in sentences was based on race. Mean: African American = 5.1500, Caucasian = 5.2500, Middle Eastern = 4.0500 __ I would not recommend that the Justice Department open an
- 15. investigation. The results showed that both Caucasian and African American suspects received larger sentences than Middle Eastern suspects. Moreover, these findings, although significant, were very weak. MiddleEasternCaucasianAfricanAmerican Race 5.00 4.00 3.00 2.00 1.00 0.00 Mean Sentence Sentences based on Race JUS520 Exam 2 I expect the answers to be organized neatly in a Word document. For all questions, use the 5-step procedure that I have outlined. Each of the 5 steps is worth the following point values: Step 1 (8 points), Step 2 (2 points), Step 3 (5 points), Step 4 (5 points), and Step 5 (5 points). Paste all relevant output. 1. You are interested in assessing the effectiveness of a domestic violence counseling program designed to decrease the number of domestic abuse incidents among convicted abusers. The case files of ten offenders are randomly selected from the population of convicted abusers. The number of abuse incidents (verbal or physical) six reported six months before the implementation of the counseling program and six months following the completion of the program are reported below. Using a .01 level of significance, test the hypothesis that the number of abuse incidents was greater before participation in the counseling program.
- 16. Number of Abuse Incidents Before and After Implementation of Domestic Violence Counseling Program Offender number Before After 1 4 2 2 3 1 3 1 1 4 4 0 5 1 2 6 3 1 7 4 3 8 4 2 9 4 2 10 2 0
- 17. 2. You have been hired by the mayor of a mid-sized city who wants to see if senior citizens and younger citizens differ in their attitudes toward a neighborhood watch program. Fifteen citizens from each age group were randomly selected to give their opinions about the effectiveness of the program on a 7- point scale (the higher the number, the more favorable the attitude). Using the data below, test the hypothesis that there is no difference between the two groups of citizens. Younger Citizens Senior Citizens 5 3 5 4 7 5 7 7 7 4 6 4 7 3 6 4 5 4 7 3 5 5 7 4
- 18. 6 2 7 3 6 2 3. A researcher undertakes a study of physical force incidences among a sample of correctional officers. The research is specifically interested in determining whether the use of force differs depending on the height of the officer. The researcher selected a random sample of 45 officers in three different height categories and examines the number of times each of those officers used physical force within the past 12 months. Use the data below to answer the following questions: (a) Test the hypothesis that there is a significant difference, overall, between the three height groups and display the means in a bar graph. (30) (b) Using a post hoc analysis, write where the specific differences are between each of the possible pairwise comparisons of officers’ height. (10) (c) Calculate the strength of the effect for height on officers’ use of physical force (5) (d) Based on all of these results, would you make any recommendations to your state department of corrections regarding the hiring of correctional officers? Why or why not? (5) 5’0” – 5’10” (X1) 5’11” – 6’4” (X2) Over 6’4” (X3) 0 3 4 3
- 20. 3 5 2 2 3