Assignment 2: Tests of Significance
Throughout this assignment you will review mock studies. You will needs to follow the directions outlined in the section using SPSS and decide whether there is significance between the variables. You will need to list the five steps of hypothesis testing (as covered in the lesson for Week 6) to see how every question should be formatted. You will complete all of the problems. Be sure to cut and past the appropriate test result boxes from SPSS under each problem and explain what you will do with your research hypotheses. All calculations should be coming from your SPSS. You will need to submit the SPSS output file to get credit for this assignment. This file will save as a .spv file and will need to be in a single file. In other words, you are not allowed to submit more than one output file for this assignment.
The five steps of hypothesis testing when using SPSS are as follows:
1. State your research hypothesis (H1) and null hypothesis (H0).
2. Identify your confidence interval (.05 or .01)
3. Conduct your analysis using SPSS.
4. Look for the valid score for comparison. This score is usually under ‘Sig 2-tail’ or ‘Sig. 2’. We will call this “p”.
5. Compare the two and apply the following rule:
a. If “p” is < or = confidence interval, than you reject the null.
Be sure to explain to the reader what this means in regards to your study. (Ex: will you recommend counseling services?)
* Be sure that your answers are clearly distinguishable. Perhaps you bold your font or use a different color.
ASSIGNMENT 2(200) WORD MINIUM
1. They allow us to see if our relationship is "statistically significant". (Remember that this only shows us that there is or is not a relationship but does NOT show us if it is big, small, or in-between.)
2. It let's us know if our findings can be generalized to the population which our sample was selected from and represents.
This week you will decide which test of significance you will use for your project. For this class your choices for tests will include one of the following:
· Chi-square
· t Test
· ANOVA
We will be using a process for hypothesis testing which outlines five steps researchers can follow to complete this process:
1. Write your research hypothesis (H1) and your null hypothesis (H0).
2. Identify and record your confidence interval. These are usually .05 (95%) or .01 (99%).
3. Complete the test using SPSS.
4. Identify the number under Sig. (2-tail). This will be represented by "p".
5. Compare the numbers in steps 2 and 4 and apply the following rule:
1. If p < or = confidence interval, than you reject the null hypothesis
Determine what to do with your null and explain this to your reader. Be sure to go beyond the phrase "reject or fail to reject the null" and explain how that impacts your research and best describes the relationship between variables.
TEST QUESTIONS-NEED FULL ANSWERS
Q1
Make up and discuss research examples corresponding to the various ...
Assignment 2 Tests of SignificanceThroughout this assignmen.docxkarenahmanny4c
Assignment 2: Tests of Significance
Throughout this assignment you will review mock studies. You will needs to follow the directions outlined in the section using SPSS and decide whether there is significance between the variables. You will need to list the five steps of hypothesis testing (as covered in the lesson for Week 6) to see how
every
question should be formatted. You will complete all of the problems. Be sure to cut and past the appropriate test result boxes from SPSS under each problem and explain what you will do with your research hypotheses.
All calculations should be coming from your SPSS
. You will need to submit the SPSS output file to get credit for this assignment. This file will save as a .spv file and will need to be in a single file. In other words, you are not allowed to submit more than one output file for this assignment.
The five steps of hypothesis testing when using SPSS are as follows:
State your research hypothesis (H
1
) and null hypothesis (H
0
).
Identify your significance level (.05 or .01)
Conduct your analysis using SPSS.
Look for the valid score for comparison. This score is usually under ‘Sig 2-tail’ or ‘Sig. 2’. We will call this “p”.
Compare the two and apply the following rule:
If “p” is < or = significance level, than you reject the null.
Be sure to explain to the reader what this means in regards to your study. (Ex: will you recommend counseling services?)
* Be sure that your answers are clearly distinguishable. Perhaps you bold your font or use a different color.
This assignment is due no later than Sunday of Week 6 by 11:55 pm ET. Save the file in the following format: [your last name_SOCI332_A2]. The file must be a word file.
t Tests
t Test for a Single Sample (20 points)
Open SPSS
Enter the number of activities of daily living performed by the depressed clients studied in #1 in the Data View window.
In the Variable View window, change the variable name to “ADL” and set the decimals to zero.
Click Analyze
à
Compare Means
à
One-Sample T test
à
the arrow to move “ADL” to the Variable(s) window.
Enter the population mean (17) in the “Test Value” box.
Click OK.
1.
Researches are interested in whether depressed people undergoing group therapy will perform a different number of activities of daily living after group therapy. The researchers have randomly selected 12 depressed clients to undergo a 6-week group therapy program.
Use the five steps of hypothesis testing to determine whether the average number of activities of daily living (shown below) obtained after therapy is significantly different from a mean number of activities of 17 that is typical for depressed people. (Clearly indicate each step).
Test the difference at the .05 level of significance and at the .01 level (in SPSS this means you change the “confidence level” from 95% to 99%).
As part of Step 5, indicate whether the behavioral scientists should recommend group therapy for all depressed people based.
WEEK 6 – EXERCISES Enter your answers in the spaces pr.docxwendolynhalbert
WEEK 6 – EXERCISES
Enter your answers in the spaces provided. Save the file using your last name as the beginning of the file name (e.g., ruf_week6_exercises) and submit via “Assignments.” When appropriate,
show your work
. You can do the work by hand, scan/take a digital picture, and attach that file with your work.
1
.
A psychotherapist studied whether his clients self-disclosed more while sitting in an easy chair or lying down on a couch. All clients had previously agreed to allow the sessions to be videotaped for research purposes. The therapist randomly assigned 10 clients to each condition. The third session for each client was videotaped and an independent observer counted the clients’ disclosures. The therapist reported that “clients made more disclosures when sitting in easy chairs (
M
= 18.20) than when lying down on a couch (
M
= 14.31),
t
(18) = 2.84,
p
< .05, two-tailed.” Explain these results to a person who understands the
t
test for a single sample but knows nothing about the
t
test for independent means.
2.
A researcher compared the adjustment of adolescents who had been raised in homes that were either very structured or unstructured. Thirty adolescents from each type of family completed an adjustment inventory. The results are reported in the table below. Explain these results to a person who understands the
t
test for a single sample but knows nothing about the
t
test for independent means.
Means on Four Adjustment Scales for
Adolescents from Structured versus Unstructured Homes
Scale
Structured Homes
Unstructured Homes
t
Social Maturity
106.82
113.94
–1.07
School Adjustment
116.31
107.22
2.03*
Identity Development
89.48
94.32
1.93*
Intimacy Development
102.25
104.33
.32
______________________
*
p
< .05
3.
Do men with higher levels of a particular hormone show higher levels of assertiveness? Levels of this hormone were tested in 100 men. The top 10 and the bottom 10 were selected for the study. All participants took part in a laboratory simulation in which they were asked to role-play a person picking his car up from a mechanic’s shop. The simulation was videotaped and later judged by independent raters on each of four types of assertive statements made by the participant. The results are shown in the table below. Explain these results to a person who fully understands the
t
test for a single sample but knows nothing about the
t
test for independent means.
Mean Number of Assertive Statements
Type of Assertive Statement
Group
1
2
3
4
Men with High Levels
2.14
1.16
3.83
0.14
Men with Low Levels
1.21
1.32
2.33
0.38
t
3.81**
0.89
2.03*
0.58
______________________
*
p
< .05;
**
p
< 0.1
4.
A manager of a small store wanted to discourage shoplifters by putting signs around the store saying “Shoplifting is a crime!” However, he wanted to make sure this would not result in customers buying less. To test this, he displayed the signs every other W.
I need this done ASAP, You have to have SPSS Software on your comput.docxanthonybrooks84958
I need this done ASAP, You have to have SPSS Software on your computer. Please do not request to do the assignment if you don't have the software or if you do not have the understanding to get this assignment complete.
Assignment 2: Tests of Significance
Throughout this assignment you will review mock studies.
You will needs to follow the directions outlined in the section using SPSS and decide whether there is significance between the variables.
You will need to list the five steps of hypothesis testing (as covered in the lesson for Week 6) to see how
every
question should be formatted.
You will complete all of the problems.
Be sure to cut and past the appropriate test result boxes from SPSS under each problem and explain what you will do with your research hypotheses.
All calculations should be coming from your SPSS
.
You will need to submit the SPSS output file to get credit for this assignment.
This file will save as a .spv file and will need to be in a single file.
In other words, you are not allowed to submit more than one output file for this assignment.
The five steps of hypothesis testing when using SPSS are as follows:
State your research hypothesis (H
1
) and null hypothesis (H
0
).
Identify your significance level (.05 or .01)
Conduct your analysis using SPSS.
Look for the valid score for comparison.
This score is usually under ‘Sig 2-tail’ or ‘Sig. 2’.
We will call this “p”.
Compare the two and apply the following rule:
If “p” is < or = significance level, than you reject the null.
Be sure to explain to the reader what this means in regards to your study.
(Ex: will you recommend counseling services?)
* Be sure that your answers are clearly distinguishable.
Perhaps you bold your font or use a different color.
This assignment is due no later than Sunday of Week 6 by 11:55 pm ET.
Save the file in the following format: [your last name_SOCI332_A2].
The file must be a word file.
t Tests
t Test for a Single Sample (20 points)
Open SPSS
Enter the number of activities of daily living performed by the depressed clients studied in #1 in the Data View window.
In the Variable View window, change the variable name to “ADL” and set the decimals to zero.
Click Analyze
Compare Means
One-Sample T test
the arrow to move “ADL” to the Variable(s) window.
Enter the population mean (17) in the “Test Value” box.
Click OK.
Researches are interested in whether depressed people undergoing group therapy will perform a different number of activities of daily living after group therapy. The researchers have randomly selected 12 depressed clients to undergo a 6-week group therapy program.
Use the five steps of hypothesis testing to determine whether the average number of activities of daily living (shown below) obtained after therapy is significantly different from a mean number of activities of 17 that is typical for depressed people. (Clearly indicate each step).
Test the difference at the .05 level of significance a.
For more classes visit
www.snaptutorial.com
Exam 1 Psych 355
3. A p level of 0.05 corresponds to a confidence level of __________%
4. In a within-groups design where one group is measured twice over time, the appropriate hypothesis test is an:
7. Why do we divide by N-1 rather than by N when estimating a population standard deviation from the sample standard deviation?
8. The paired-samples t test has three assumptions, including all
Exam 1 Psych 355
3. A p level of 0.05 corresponds to a confidence level of __________%
4. In a within-groups design where one group is measured twice over time, the appropriate hypothesis test is an:
7. Why do we divide by N-1 rather than by N when estimating a population standard deviation from the sample standard deviation?
8. The paired-samples t test has three assumptions, including all but:
9. We have learned three t tests, including all of the following except
Psyc 355 Effective Communication / snaptutorial.comHarrisGeorg39
Exam 1 Psych 355
3. A p level of 0.05 corresponds to a confidence level of __________%
4. In a within-groups design where one group is measured twice over time, the appropriate hypothesis test is an:
For more classes visit
www.snaptutorial.com
Exam 1 Psych 355
3. A p level of 0.05 corresponds to a confidence level of __________%
4. In a within-groups design where one group is measured twice over time, the appropriate hypothesis test is an:
7. Why do we divide by N-1 rather than by N when estimating a population standard deviation from the sample standard deviation?
WEEK 5 – EXERCISES Enter your answers in the spaces pr.docxpaynetawnya
WEEK 5 – EXERCISES
Enter your answers in the spaces provided. Save the file using your last name as the beginning of the file name (e.g., ruf_week5_exercises) and submit via “Assignments.” When appropriate,
show your work
. You can do the work by hand, scan/take a digital picture, and attach that file with your work.
For the following question(s): A school counselor tests the level of depression in fourth graders in a particular class of 20 students. The counselor wants to know whether the kind of students in this class differs from that of fourth graders in general at her school. On the test, a score of 10 indicates severe depression, while a score of 0 indicates no depression. From reports, she is able to find out about past testing. Fourth graders at her school usually score 5 on the scale, but the variation is not known. Her sample of 20 fifth graders has a mean depression score of 4.4. Use the .01 level of significance.
1.
The counselor calculates the unbiased estimate of the population’s variance to be 15. What is the variance of the distribution of means?
A)
15/20 = 0.75
B)
15/19 = 0.79
C)
15
2
/20 = 11.25
D)
15
2
/19 = 11.84
2.
Suppose the counselor tested the null hypothesis that fourth graders in this class were
less
depressed than those at the school generally. She figures her
t
score to be
-
.20. What decision should she make regarding the null hypothesis?
A)
Reject it
B)
Fail to reject it
C)
Postpone any decisions until a more conclusive study could be conducted
D)
There is not enough information given to make a decision
3.
Suppose the standard deviation she figures (the square root of the unbiased estimate of the population variance) is .85. What is the effect size?
A)
5/.85 = 5.88
B)
.85/5 = .17
C)
(5
-
4.4)/.85 = .71
D)
.85/(5
-
4.4) = 1.42
For the following question(s): Professor Juarez thinks the students in her statistics class this term are more creative than most students at this university. A previous study found that students at this university had a mean score of 35 on a standard creativity test. Professor Juarez finds that her class scores an average of 40 on this scale, with an estimated population standard deviation of 7. The standard deviation of the distribution of means comes out to 1.63.
4.
What is the
t
score?
A)
(40
-
35)/7 = .71
B)
(40
-
35)/1.63 = 3.07
C)
(40
-
35)/7
2
= 5/49 = .10
D)
(40
-
35)/1.63
2
= 5/2.66 = 1.88
5.
What effect size did Professor Juarez find?
A)
(40
-
35)/7 = .71
B)
(40
-
35)/1.63 = 3.07
C)
(40
-
35)/7
2
= 5/49 = .10
D)
(40
-
35)/1.63
2
= 5/2.66 = 1.88
6.
If Professor Juarez had 30 students in her class, and she wanted to test her hypothesis using the 5% level of significance, what cutoff
t
score would she use? (You should be able to figure this out without a table because only one answer is in the correct region.)
A)
304.11
B)
1.699.
For more classes visit
www.snaptutorial.com
Exam 1 Psych 355
3. A p level of 0.05 corresponds to a confidence level of __________%
4. In a within-groups design where one group is measured twice over time, the appropriate hypothesis test is an:
7. Why do we divide by N-1 rather than by N when estimating a population standard deviation from the sample standard deviation?
For more course tutorials visit
www.tutorialrank.com
Exam 1 Psych 355
3. A p level of 0.05 corresponds to a confidence level of __________%
4. In a within-groups design where one group is measured twice over time, the appropriate hypothesis test is an:
Psyc 355 Effective Communication - tutorialrank.comBartholomew88
For more course tutorials visit
www.tutorialrank.com
Exam 1 Psych 355
3. A p level of 0.05 corresponds to a confidence level of __________%
4. In a within-groups design where one group is measured twice over time, the appropriate hypothesis test is an:
7. Why do we divide by N-1 rather than by N when estimating a population standard deviation from the
Week 5 Independent t Test ExercisesPart IThe hypothesis bein.docxcockekeshia
Week 5 Independent t Test Exercises
Part I
The hypothesis being tested is: Women who are working will have a lower level of depression as compared to women who are not working.
Using Polit2SetC SPSS dataset, which contains a number of mental health variables, determine if the above hypothesis is true.
Follow these steps when using SPSS:
Open Polit2SetC dataset.
Click Analyze then click Compare Means, then Independent Sample T-test.
Move the Dependent Variable (CES_D Score “cesd”) in the area labelled Test Variable.
Move the Independent Variable (Currently Employed “worknow”) into the area labelled Grouping Variable. The worknow variable is coded as (0= those women who do not work and 1= those women who are working). Click on Define Groups in group 1 box type 0 and in group 2 box type 1. Click Continue.
Click continue and then click OK.
Assignment: Through analysis of the data and use of the questions below write one to two paragraphs summarizing your findings from this t-test.
How many women were employed versus not employed in the sample?
What is the total sample size?
What are the mean (SD) CES-D scores for each group?
Interpret the Levene’s statistic. (Hint: Is the assumption of homogeneity of variance met? Are equal variances assumed or not assumed?)
What is the value of the t-statistic, number of degrees of freedom and the p-value?
Does the data support the hypothesis? Why or why not?
Part II
Hypothesis: Women who reported depression scores in wave 1 and wave 2 of the study did not have a significant difference in their level of depression.
Using Polit2SetC SPSS dataset, determine if the above hypothesis is true.
Follow these steps when using SPSS:
Open Polit2SetC dataset.
Click Analyze then click Compare Means, then Paired Samples T-test.
First click on CES-D Score (cesd) and move it into the box labelled Paired Variables (in the rectangle for Pair 1 of Variable 1 and then click on CESD Score, Wave 1 (cesdwav1) and move it into the Paired Variables box (in the rectangle next to CES-D Score, pair 1, variable 2).
Click continue and then click OK.
Assignment: Through analysis of the data and use of the questions below write one to two paragraphs summarizing your findings from this t-test.
What is the total sample size?
What are the mean (SD) CES-D scores at wave 1 and wave 2?
What is the mean difference between the two time periods?
What is the value of the t-statistic, number of degrees of freedom and the p-value(sig)?
Does the data support the hypothesis? Why or why not?
Part III
Using Polit2SetC dataset, run independent groups t-tests for three outcomes. The outcome variables are CES-D Score (cesd), SF12: Physical Health Component Score, standardized (sf12phys) and SF12: Mental Health Component Score, standardized (sf12ment).
Follow these steps when using SPSS:
Open Polit2SetC dataset.
Click Analyze then click Compare Means, then Independent Sample T-test.
Move the Dependent Variables (.
WEEK 7 – EXERCISES Enter your answers in the spaces pr.docxwendolynhalbert
WEEK 7 – EXERCISES
Enter your answers in the spaces provided. Save the file using your last name as the beginning of the file name (e.g., ruf_week6_exercises) and submit via “Assignments.” When appropriate,
show your work
. You can do the work by hand, scan/take a digital picture, and attach that file with your work.
A sports researcher gave a standard written test of eating habits to 12 randomly selected professionals, four each from baseball, football, and basketball. The results were as follows:
Eating Habits Scores
Baseball Players
Football Players
Basketball Players
34
27
35
18
28
44
21
67
47
65
42
61
Is there a difference in eating habits among professionals in the three sports? (Use the .05 significance level.)
a.
Use the five steps of hypothesis testing.
b.
Sketch the distribution involved.
c.
Determine effect size.
2.
To study the effectiveness of treatments for insomnia, a sleep researcher conducted a study with 12 participants.
Four participants were instructed to count sheep (Sheep Condition), four were told to concentrate on their breathing (Breathing Condition), and four were not given any special instructions. Over the next few days, measures were taken of how many minutes it took each participant to fall asleep. The average times for the participants in the Sheep Condition were 14, 28, 27, and 31; for those in the Breathing Condition, 25, 22, 17, and 14; and for those in the control condition, 45, 33, 30, and 41.
Do these results suggest that the different techniques have different effects?
(Use the .05 significance level.)
a.
Use the five steps of hypothesis testing.
b.
Sketch the distribution involved.
c.
Figure the effect size of the study.
d.
Explain your findings (including the logic of comparing within-group to between-group population variance estimates, how each of these is figured, and the
F
distribution).
High school juniors planning to attend college were randomly assigned to view one of four videos about a particular college, each differing according to what aspect of college life was emphasized: athletics, social life, scholarship, or artistic/cultural opportunities. After viewing the videos, the students took a test measuring their desire to attend this college. The results were as follows:
Desire to Attend this College
Athletics
Social Life
Scholarship
Art/Cultural
68
89
74
76
56
78
82
71
69
81
79
69
70
77
80
65
Do these results suggest that the type of activity emphasized in a college film affects desire to attend that college? (Use the .01 significance level.)
a.
Use the five steps of hypothesis testing.
b.
Sketch the distribution involved.
c.
Figure the effect size of the study.
d.
Explain the logic of what you have done to a person who is unfamiliar with the analysis of variance.
A team of psychologists designed a study in which 12 psychiatric patients diagnosed as having generalized anxiety disorder were randomly assigned to one of three new types of th.
Assessment 3 – Hypothesis, Effect Size, Power, and t Tests.docxcargillfilberto
Assessment 3 – Hypothesis, Effect Size, Power, and
t
Tests
Complete the following problems within this Word document. Do not submit other files. Show your work for problem sets that require calculations. Ensure that your answer to each problem is clearly visible. You may want to highlight your answer or use a different type color to set it apart.
Hypothesis, Effect Size, and Power
Problem Set 3.1: Sampling Distribution of the Mean Exercise
Criterion:
Interpret population mean and variance.
Instructions:
Read the information below and answer the questions.
Suppose a researcher wants to learn more about the mean attention span of individuals in some hypothetical population. The researcher cites that the attention span (the time in minutes attending to some task) in this population is normally distributed with the following characteristics: 20
36
. Based on the parameters given in this example, answer the following questions:
1. What is the population mean (μ)? __________________________
2. What is the population variance
? __________________________
3. Sketch the distribution of this population. Make sure you draw the shape of the distribution and label the mean plus and minus three standard deviations.
Problem Set 3.2: Effect Size and Power
Criterion:
Explain effect size and power.
Instructions:
Read each of the following three scenarios and answer the questions.
Two researchers make a test concerning the effectiveness of a drug use treatment. Researcher A determines that the effect size in the population of males is
d
= 0.36; Researcher B determines that the effect size in the population of females is
d
= 0.20. All other things being equal, which researcher has more power to detect an effect? Explain. ______________________________________________________________________
Two researchers make a test concerning the levels of marital satisfaction among military families. Researcher A collects a sample of 22 married couples (
n
= 22); Researcher B collects a sample of 40 married couples (
n
= 40). All other things being equal, which researcher has more power to detect an effect? Explain. ______________________________________________________________________
Two researchers make a test concerning standardized exam performance among senior high school students in one of two local communities. Researcher A tests performance from the population in the northern community, where the standard deviation of test scores is 110 (
); Researcher B tests performance from the population in the southern community, where the standard deviation of test scores is 60 (
). All other things being equal, which researcher has more power to detect an effect? Explain. ______________________________________________________________________
Problem Set 3.3: Hypothesis, Direction, and Population Mean
Criterion:
Explain the relationship between hypothesis, tests, and population mean.
Instructions:
Read the following and answer the questions.
Answer the questions below, following the Submission Requirements .docxjustine1simpson78276
Answer the questions below, following the Submission Requirements as specified at the end of the assessment.
Assessment Concepts
Question
Concept
Question 1
SPSS: One-Variable Chi Square
Question 2
SPSS: One-Variable Chi Square
Question 3
Chi-Square as a Test of Independence
Question 4
SPSS: Two-Variable Chi-Square
Question 5
Measures of Effect Size
Question 6
Power and the Factors Affecting It
Question 7
Power and the Factors Affecting It
Question 8
Correlational Studies
Question 9
Correlation: Relationship Direction
Question 10
SPSS: Scatterplot
Question 11
SPSS: Pearson r
Question 12
SPSS: Pearson r
Question 1
Complete the following steps:
1. Open the SPSS file assessment5a.sav linked in the Resources under the Required Resources heading.
2. At the top of the screen, click on Data, then select Weight Cases.
3. Click on Weight Cases By, click on Count, then click on the arrow next to Frequency Variable to send it over to the Test Variable box.
4. On the toolbar, click Analyze, then Nonparametric Tests, then Legacy Dialogs, the Chi Square.
5. Click on Favorite Color, then click on the arrow to send to the Test Variable List window.
6. Under Expected Values, select Value, then enter the following four values in order: 43, 58, 253, 414.
7. Click OK and copy and paste the output to your Word document.
Question 2
There are 218 first graders in an elementary school. Of these first graders, 86 are boys, and 132 are girls. School-wide, there are 753 boys and 1063 girls. The principal would like to know if the gender ratio in first grade reflects the gender ratio across the school.
Complete the following:
1. Identify the null hypothesis.
2. What are the degrees of freedom (df)?
3. Complete the table (complete in SPSS and paste the output into your Word document):
Question 2
Men
Women
Number Observed
Number Expected
Number Observed
Number Expected
4. Calculate χ² in SPSS and paste the output into your Word document.
5. Can you reject the null hypothesis at α = .05?
Question 3
You recently read a magazine article stating that professionals who attended college online tend to earn higher salaries than professionals who attended brick-and-mortar universities. Identify this study's two variables.
Question 4
Complete the following steps:
1. Open the SPSS file assessment5b.sav linked in the Resources under the Required Resources heading.
2. At the top of the screen, click on Data, then select Weight Cases.
3. Click on Weight Cases By, click on Count, then click on the arrow next to Frequency Variable to send it over to the Test Variable box.
4. On the toolbar, click Analyze, then Descriptive Statistics, then Crosstabs.
5. Click on Team Placement, then click on the arrow to send to the Rows window.
6. Click on Gender, then click on the arrow to send to the Columns window.
7. Click on the Statistics button, then check the box for Chi-Square. Click Continue.
8. Click on the Cells button, then check the box for Expected. Click Continue.
9. Click OK, and.
PSYC 354Homework 8Single-Sample T-TestWhen submitting this f.docxpotmanandrea
PSYC 354
Homework 8
Single-Sample T-Test
When submitting this file, be sure the filename includes your full name, course and section. Example: HW8_JohnDoe_354B01
Be sure you have reviewed this module/week’s lesson and presentations along with the practice data analysis before proceeding to the homework exercises. Complete all analyses in SPSS, then copy and paste your output and graphs into your homework document file. Answer any written questions (such as the text-based questions or the APA Participants section) in the appropriate place within the same file.
Part I: Concepts
Questions 1–3; Answer the questions in the spaces provided.
Part I: Questions 1a-e
Fill in the highlighted blanks with the best word or words.
1-a)
You use a t-test when you know the population ________ but not the population ________.
1-b)
The 2 groups compared in the single-sample t-test are the sample and the ________.
1-c)
The number of scores that are free to vary when you are estimating a population parameter from a sample is called the ________.
1-d)
A researcher reports the results of a single-sample t-test as t(23) = 3.96. The degrees of freedom for this t-test are ______, which means there were ____ total participants in the researcher's sample.
1-e)
When your t-statistic in your results exceeds your critical cutoffs, you ________ the null hypothesis.
Part I: Question 2-3
2)
Explain what each part of the following statistical phrase represents, as it would be reported in APA format: t(19) = 3.15, p = .04
t
Answer
19
Answer
3.15
Answer
P
Answer
.04
Answer
3)
Calculate the degrees of freedom and identify the critical t value for a single-sample t test in each of the following situations:
3-a) Two-tailed test, N = 9, p = .10
df= Answer
critical t = Answer
3-b) Two-tailed test, N = 16, p = .05
df= Answer
critical t = Answer
3-c) One-tailed test, N = 21, p = .01
df= Answer
critical t = Answer
Part II: SPSS Analysis
Module 8 Exercise File 1
Part II:
Questions 1-2
· Open Module 8 Exercise File 1. This file contatins scores on a measure of acute PTSD for 12 children who live in an area recently affected by a natural disaster. Higher scores indicate more acute PTSD symptomology.
· Using these data, run 2 separate single-sample t-tests to compare the sample’s mean acute PTSD score to the following population values:
Population means on PTSD measure for 2 different populations
Population of children in the US: = 12
Population of children in the US who have been victims of abuse : = 16.2
· For each test, paste the output and write a Results section in current APA style
· As demonstrated in the presentations and in the textbooks.
· There will be 2 sets of output and 2 results sections using this data set
· 1 for each test involving a different population mean.
1-a)
Population of children in the US: = 12.
Answer: SPSS output of the t-Test
1-b)
Write a results section in current APA style describing the ou ...
ANOVA is a hypothesis testing technique used to compare the equali.docxjustine1simpson78276
ANOVA is a hypothesis testing technique used to compare the equality of means for two or more groups; for example, it can be used to test that the mean number of computer chips produced by a company on each of the day, evening, and night shifts is the same. Give an example of an application of ANOVA in an industrial, operations, or manufacturing setting that is different from the examples provided in the overview. Discuss and share this information with your classmates.
In responding to your peers, select responses that use an ANOVA application that is different from your own. Are the results of the ANOVA application statistically significant? Why are the results significant or not significant? Explain your reasoning. Consider how ANOVA could be applied to the final project case study.
Support your initial posts and response posts with scholarly sources cited in APA style.
https://statistics4beginners.wordpress.com/2015/02/18/how-to-calculate-anova-in-excel-2013/
PLEASE GIVE A 1-2 PARAGRAPH RESPONSE TO THE FOLLOWING:
1.
In this module, our goal is to learn the statistical process of comparing several population means through a procedure called "analysis of variance", or ANOVA. ANOVA uses the variance from the mean of 2 or more sample populations to see if there is a statistically significant difference between them (Sharpe, DeVeaux, Velleman, 2016). We've learned that this is a valuable tool in all sorts of areas of study, including automotive, chemical, and medical industries.
There are many practical examples of ANOVA throughout business. As previously mentioned, the medical field can benefit from the use of this statistics tool. For example, a drug company may be interested in the results of clinical trials for a few new drugs they plan to release. Medicine A, B, and C are all now in the clinical testing phase, so the instances in which each cures a specific ailment can be summed up using ANOVA. Each of the individual drugs, through the course of multiple trials, will have a number of "cured" patients. The following is an example of what the results may be, in table format:
A B C
Trial 1 4 9 2
2 5 8 7
3 7 1 6
4 6 1 5
5 6 4 9
Using ANOVA to evaluate the variance from the mean for each trial, the ultimate goal would be to compare each trial to one another. By comparing the variance, we can say, with statistical confidence, that one medicine may be more effect.
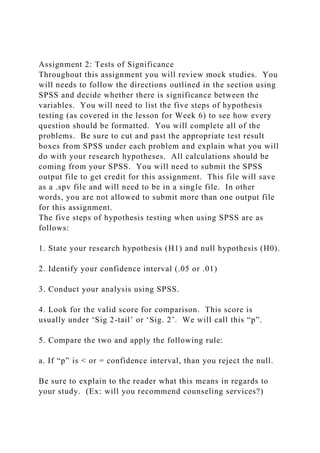
statistics/cf_choose_a_statistical_test (1) (1).pptx
Independent Variable [IV]
(number of groups)Dependent Variable [DV]
(measurement level) Two Groups
Three + Groups
Independent
(“unpaired”)Dependent
(“paired”)Independent
(“unpaired”)
Dependent
(“paired”)
CategoricalNon-parametric TestsChi-squareMcNemar’sChi-square
Cochran’s QOrdinal Mann-Whitney UWilcoxon Signed ranksKruskal Wallis HFriedman’sInterval / Ratio
(continuous)Parametric TestsIndependent
t-testDependent
t-testANOVARM-ANOVA
“What is the effect of TREATMENT (IV) on our OUTCOME (DV) of interest?”
Example: TREATMENT independent groups (placebo versus drug), OUTCOME interval/ratio (blood pressure)
Example: TREATMENT dependent group (pre/post yoga therapy), OUTCOME ordinal (back pain levels)
Example: TREATMENT independent 3+ groups (yoga therapy, none, aerobics), OUTCOME categorical (pass/fail of driving test)CorrelationsPhi coefficientSpearman’s rhoPearson’s r
Independent Variable
(number of groups)Dependent Variable (measurement level) Two Groups
Three + Groups
Independent
(“unpaired”)Dependent
(“paired”)Independent
(“unpaired”)
Dependent
(“paired”)
CategoricalNon-parametric TestsChi-squareMcNemar’sChi-square
Cochran’s QOrdinal Mann-Whitney UWilcoxon Signed ranksKruskal Wallis HFriedman’sInterval / Ratio
(continuous)Parametric TestsIndependent
t-testDependent
t-testANOVARM-ANOVA
STEP #1
Check what measurement level your DV is.
STEP #2
Choose the column related to the number Groups in your study.
STEP #3
Choose the column where intervention groups are either “paired” or “unpaired.”
STEP #4
Match your column with the row to find which test
to run.
STEP #1
Look at your Dependent Variable or outcome.
The data that we are looking at here is from the instruments you used to measure the effect of your intervention. Maybe you chose to measure stress with a commonly used psychological questionnaire or maybe you measured cholesterol levels or test scores.
What is its measurement level?
Categorical (such as yes or no; dead or alive; pass or fail).
Ordinal (such as health status – poor, average, excellent).
Interval ratio (for instance blood pressure, cholesterol level, rates of infection, or workplace satisfaction scores on a scale of 0-100).
STEP #2
Next you will look for the column that corresponds to the number of groups you have for your Independent Variable (also called experimental or predictor variable).
Remember, the independent variable is the thing in your study that was controlled by you (such as a medical intervention, or training initiative, or implementation of a modified protocol) for the purpose of making a change on some outcome in the population you are studying.
So…how many groups were involved in this intervention?
For example, if you were testing the effect of an evidence-based training initiative on employee workplace satisfaction or happiness, you might be interested in comparing the training initiative in one group to no training in another group..
WEEK 8 – EXERCISESEnter your answers in the spaces pro.docxwendolynhalbert
WEEK 8 – EXERCISES
Enter your answers in the spaces provided. Save the file using your last name as the beginning of the file name (e.g., ruf_week8_exercises) and submit via “Assignments.” When appropriate,
show your work
. You can do the work by hand, scan/take a digital picture, and attach that file with your work.
1.
A researcher plans a study in which a crucial step is offering participants a food reward. It is important that the three food rewards be equal in appeal. Thus, a prestudy was designed in which participants were asked which of the rewards they preferred. Of the 60 participants, 16 preferred cupcakes, 26 preferred candy bars, and 18 favored dried apricots. Do these scores suggest that the different foods are differentially preferred by people in general? (Use the .05 significance level.)
a.Use the five steps of hypothesis testing.
b.Sketch the distribution involved.
c.Explain your findings.
2.
A high school principal wanted to know if the racial makeup of her teachers mirrored that of the student body. The student body broke down into 47% White, 28% Latino, 15% African American, and 10% other. Of the 65 teachers, 42 were White, 4 were Latino, 15 were African American, and 4 were Other. Do these results suggest that the racial makeup of the faculty members is different from that of the students? (Use the .05 significance level.)
Use the five steps of hypothesis testing and explain your findings.
3.
Please make up and discuss research examples corresponding to the various techniques introduced throughout this course. Describe a plausible study for each of the following statistical procedures, indicating how it would apply and what results you would predict. Also include information about the number of participants you would assess and how you would go about estimating effect size and statistical power (when relevant).
a.correlation
b.multiple regression
c.
t
test for independent means
d.
t
test for dependent means
e.ANOVA
f.chi square for goodness of fit
g.chi-square test for independence
SPSS ASSIGNMENT #8
Chi-Square
SPSS instructions:
Chi-Square Test for Goodness of Fit:
Open SPSS
Remember that SPSS assumes that all the scores in a row are from the same participant. In the study presented in #1, there are 20 students, some of whom have been suspended for misbehavior. The primary conflict-resolution style used by each student is also entered. [Ignore the first variable in this analysis.]
When you have entered the data for all 20 students, move to the Variable View window and change the first variable name to “SUSPEND” and the second to “STYLE”. Set the number of decimals for both variables to zero.
Click Analyze
à
Non-Parametric Tests
à
Chi-Square
Click the variable “STYLE” and then the arrow next to the box labeled “Test Variable List” to indicate that the chi-square for goodness of fit should be conducted on the conflict-resolution style variable.
N.
P
A
G
E
5
Ryerson University
Daphne Cockwell School of Nursing
CNUR 860 WINTER 2022 Major Statistics Week 10
Course Leader Dr Elaine Santa Mina
This assignment is worth 30 marks
THE QUESTIONS ON THIS ASSIGNMENT ARE Three (3) PAGES IN LENGTH
There is no page limit to your paper.
This assignment accompanies the RNAO Best Practice Guideline:
Registered Nurses’ Association of Ontario (2005). Nursing Care of Dyspnea: The 6th
Vital Sign in Individuals with Chronic Obstructive Pulmonary Disease (COPD). Toronto,
Canada: Registered Nurses’ Association of Ontario.
Prepare your assignment as per APA 5th format, inclusive of a title page, pages
numbered, double spaced , reference page etc. DO NOT RECOPY Question format and
DO NOT INSERT ANSWERS IN POINT FORM; Reference your Salkind text
appropriately
Grading: Assignments completed in point form will NOT be accepted for grading.
This is an individual assignment, not a group assignment, see course syllabus
directions to not share files, papers, or any part of your assignment with another
student, as that constitutes academic misconduct.
Answer each research question separately…do not combine answers across questions.
There will be a 5 mark deduction, if APA format for a scholarly paper is not followed,
and/ or if responses to questions are combined.
Please remember: If you decide a pearson r is required in the hypothesis test, on
your output the correct significance in the correlation to interpret is the significance for
the p value beside the independent variable. The written excel directions are correct.
There is an error in the captivate lab which incorrectly indicates that you are to use the p
value for the intercept
Use the CNUR 860 Major STATS assignment database and study abstract for this
assignment. For the following three research scenarios, answer the research questions by
conducting the requested analyses. Each question is worth a total of 10 marks for a total
of 30 marks for this assignment. The distribution of marks is similar to the distribution
on your mini stats assignments.
FOR EACH RESEARCH QUESTION CONDUCT ALL RELEVANT:
a) descriptive stats = 4 marks (2 marks per variable) Conduct the appropriate
descriptive statistical analyses to answer this research question. Include in the descriptive
analyses, all outputs, (include graphs: histograms/bar graphs, for the descriptives, if you think they are
helpful in the presentation of your answer) with legends as required and discuss findings of
descriptives
b) inferential = 4 marks, Include each step of the hypothesis test.
P
A
G
E
5
Correct null and research hypotheses = .25
No grade is given for identification of target population, sample population or IV and DV
and level of measure, (grades for IV and DV are included in descriptives), but if omitted,
there will be a deduction of .1 for each omission
No grade is given for level ...
Hypothesis Testing Definitions A statistical hypothesi.docxwilcockiris
Hypothesis Testing
Definitions:
A statistical hypothesis is a guess about a population parameter. The guess may or not be
true.
The null hypothesis, written H0, is a statistical hypothesis that states that there is no
difference between a parameter and a specific value, or that there is no difference between
two parameters.
The alternative hypothesis, written H1 or HA, is a statistical hypothesis that specifies a
specific difference between a parameter and a specific value, or that there is a difference
between two parameters.
Example 1:
A medical researcher is interested in finding out whether a new medication will have
undesirable side effects. She is particularly concerned with the pulse rate of patients who
take the medication. The research question is, will the pulse rate increase, decrease, or
remain the same after a patient takes the medication?
Since the researcher knows that the mean pulse rate for the population under study is 82
beats per minute, the hypotheses for this study are:
H0: µ = 82
HA: µ ≠ 82
The null hypothesis specifies that the mean will remain unchanged and the alternative
hypothesis states that it will be different. This test is called a two-tailed test since the
possible side effects could be to raise or lower the pulse rate. Notice that this is a non
directional hypothesis. The rejection region lies in both tails. We divide the alpha in two
and place half in each tail.
Example 2:
An entrepreneur invents an additive to increase the life of an automobile battery. If the
mean lifetime of the automobile battery is 36 months, then his hypotheses are:
H0: µ ≤ 36
HA: µ > 36
Here, the entrepreneur is only interested in increasing the lifetime of the batteries, so his
alternative hypothesis is that the mean is greater than 36 months. The null hypothesis is
that the mean is less than or equal to 36 months. This test is one-tailed since the interest
is only in an increased lifetime. Notice that the direction of the inequality in the alternate
hypothesis points to the right, same as the area of the curve that forms the rejection
region.
Example 3:
A landlord who wants to lower heating bills in a large apartment complex is considering
using a new type of insulation. If the current average of the monthly heating bills is $78,
his hypotheses about heating costs with the new insulation are:
H0: µ ≥ 78
HA: µ < 78
This test is also a one-tailed test since the landlord is interested only in lowering heating
costs. Notice that the direction of the inequality in the alternate hypothesis points to the
left, same as the area of the curve that forms the rejection region.
Study Design:
After stating the hypotheses, the researcher’s next step is to design the study. In designing
the study, the researcher selects an appropriate statistical test, chooses a level of
significance, and formulates a plan for conducting the study..
In a two- to three-page paper (excluding the title and reference pag.docxrock73
In a two- to three-page paper (excluding the title and reference pages), explain the purpose of an income statement and how it reflects the firm’s financial status. Include important points that an analyst would use in assessing the financial condition of the company. Also, analyze Ford Motor Company’s income statement from its
2012 Annual Report
.
Your paper must be formatted according to APA style, and must include citations and references for the text and at least two scholarly sources.
.
In a substantial paragraph respond to either one of the following qu.docxrock73
In a substantial paragraph respond to either one of the following questions:
1.) Choose one source of energy, explain its origins, how does it impact our Earth, and what effect does it have on our planet?
OR
2.) Explain, with details, how geology influences the distribution of natural resources.
NO MINIMUM WORD LENGTH REQUIRED.
.
In a study by Dr. Sandra Levitsky, she considers why the economic,.docxrock73
In a study by Dr. Sandra Levitsky, she considers why the economic, physical, and emotional challenges of providing chronic care for a family member have not produced more salient political demands for aggressive policy intervention (Hudson, 2014).
Discuss her findings as well as your own theory on why there has not been a stronger demand from the public for policy intervention to assist caregivers.
Support your statements with evidence from the Required Studies and your research. Cite and reference your sources in APA style.
References
Hudson, R. (Ed). (2014).
The new politics of old age policy
(3rd ed.). Baltimore, John Hopkins.
.
In a response of at least two paragraphs, provide an explanation o.docxrock73
In a response of at least two paragraphs, provide an explanation of the steps you took to rewrite the Romantic poem you selected. Your explanation should point out at least three typically modernist qualities in your work with regard to elements such as
language, style, literary elements, and themes. Here, as an example, is a brief explanation of the modernist rewrite of the first stanza of Wordsworth
’s “I Wandered Lonely as a Cloud”:
.
in a minimum of 1000 words, describe why baseball is Americas past .docxrock73
in a minimum of 1000 words, describe why baseball is America's past time. As part of your paper you can share some of your memories of baseball. How did baseball mirror society(good and bad?) as a reflection of American society. Be sure to cite all of your sources and you must show direct evidence of integrating your textbook once per chapter as part of your final exam. Your paper should at include at least one resource from the library.
.
In a minimum 200 word response, describe some ways how the public .docxrock73
In a minimum 200 word response, describe some ways how the public has responded to the October 2001 USA Patriot Act. Has the public’s response been positive or negative? What are some pros and cons of the USA Patriot Act with the American public? Explain your answer.
Dempsey, J. S., & Forst, L. S. (2011, Pg. 213-214).
Police
. Clifton Park, NY: Delmar.
.
More Related Content
Similar to Assignment 2 Tests of SignificanceThroughout this assignment yo.docx
WEEK 5 – EXERCISES Enter your answers in the spaces pr.docxpaynetawnya
WEEK 5 – EXERCISES
Enter your answers in the spaces provided. Save the file using your last name as the beginning of the file name (e.g., ruf_week5_exercises) and submit via “Assignments.” When appropriate,
show your work
. You can do the work by hand, scan/take a digital picture, and attach that file with your work.
For the following question(s): A school counselor tests the level of depression in fourth graders in a particular class of 20 students. The counselor wants to know whether the kind of students in this class differs from that of fourth graders in general at her school. On the test, a score of 10 indicates severe depression, while a score of 0 indicates no depression. From reports, she is able to find out about past testing. Fourth graders at her school usually score 5 on the scale, but the variation is not known. Her sample of 20 fifth graders has a mean depression score of 4.4. Use the .01 level of significance.
1.
The counselor calculates the unbiased estimate of the population’s variance to be 15. What is the variance of the distribution of means?
A)
15/20 = 0.75
B)
15/19 = 0.79
C)
15
2
/20 = 11.25
D)
15
2
/19 = 11.84
2.
Suppose the counselor tested the null hypothesis that fourth graders in this class were
less
depressed than those at the school generally. She figures her
t
score to be
-
.20. What decision should she make regarding the null hypothesis?
A)
Reject it
B)
Fail to reject it
C)
Postpone any decisions until a more conclusive study could be conducted
D)
There is not enough information given to make a decision
3.
Suppose the standard deviation she figures (the square root of the unbiased estimate of the population variance) is .85. What is the effect size?
A)
5/.85 = 5.88
B)
.85/5 = .17
C)
(5
-
4.4)/.85 = .71
D)
.85/(5
-
4.4) = 1.42
For the following question(s): Professor Juarez thinks the students in her statistics class this term are more creative than most students at this university. A previous study found that students at this university had a mean score of 35 on a standard creativity test. Professor Juarez finds that her class scores an average of 40 on this scale, with an estimated population standard deviation of 7. The standard deviation of the distribution of means comes out to 1.63.
4.
What is the
t
score?
A)
(40
-
35)/7 = .71
B)
(40
-
35)/1.63 = 3.07
C)
(40
-
35)/7
2
= 5/49 = .10
D)
(40
-
35)/1.63
2
= 5/2.66 = 1.88
5.
What effect size did Professor Juarez find?
A)
(40
-
35)/7 = .71
B)
(40
-
35)/1.63 = 3.07
C)
(40
-
35)/7
2
= 5/49 = .10
D)
(40
-
35)/1.63
2
= 5/2.66 = 1.88
6.
If Professor Juarez had 30 students in her class, and she wanted to test her hypothesis using the 5% level of significance, what cutoff
t
score would she use? (You should be able to figure this out without a table because only one answer is in the correct region.)
A)
304.11
B)
1.699.
For more classes visit
www.snaptutorial.com
Exam 1 Psych 355
3. A p level of 0.05 corresponds to a confidence level of __________%
4. In a within-groups design where one group is measured twice over time, the appropriate hypothesis test is an:
7. Why do we divide by N-1 rather than by N when estimating a population standard deviation from the sample standard deviation?
For more course tutorials visit
www.tutorialrank.com
Exam 1 Psych 355
3. A p level of 0.05 corresponds to a confidence level of __________%
4. In a within-groups design where one group is measured twice over time, the appropriate hypothesis test is an:
Psyc 355 Effective Communication - tutorialrank.comBartholomew88
For more course tutorials visit
www.tutorialrank.com
Exam 1 Psych 355
3. A p level of 0.05 corresponds to a confidence level of __________%
4. In a within-groups design where one group is measured twice over time, the appropriate hypothesis test is an:
7. Why do we divide by N-1 rather than by N when estimating a population standard deviation from the
Week 5 Independent t Test ExercisesPart IThe hypothesis bein.docxcockekeshia
Week 5 Independent t Test Exercises
Part I
The hypothesis being tested is: Women who are working will have a lower level of depression as compared to women who are not working.
Using Polit2SetC SPSS dataset, which contains a number of mental health variables, determine if the above hypothesis is true.
Follow these steps when using SPSS:
Open Polit2SetC dataset.
Click Analyze then click Compare Means, then Independent Sample T-test.
Move the Dependent Variable (CES_D Score “cesd”) in the area labelled Test Variable.
Move the Independent Variable (Currently Employed “worknow”) into the area labelled Grouping Variable. The worknow variable is coded as (0= those women who do not work and 1= those women who are working). Click on Define Groups in group 1 box type 0 and in group 2 box type 1. Click Continue.
Click continue and then click OK.
Assignment: Through analysis of the data and use of the questions below write one to two paragraphs summarizing your findings from this t-test.
How many women were employed versus not employed in the sample?
What is the total sample size?
What are the mean (SD) CES-D scores for each group?
Interpret the Levene’s statistic. (Hint: Is the assumption of homogeneity of variance met? Are equal variances assumed or not assumed?)
What is the value of the t-statistic, number of degrees of freedom and the p-value?
Does the data support the hypothesis? Why or why not?
Part II
Hypothesis: Women who reported depression scores in wave 1 and wave 2 of the study did not have a significant difference in their level of depression.
Using Polit2SetC SPSS dataset, determine if the above hypothesis is true.
Follow these steps when using SPSS:
Open Polit2SetC dataset.
Click Analyze then click Compare Means, then Paired Samples T-test.
First click on CES-D Score (cesd) and move it into the box labelled Paired Variables (in the rectangle for Pair 1 of Variable 1 and then click on CESD Score, Wave 1 (cesdwav1) and move it into the Paired Variables box (in the rectangle next to CES-D Score, pair 1, variable 2).
Click continue and then click OK.
Assignment: Through analysis of the data and use of the questions below write one to two paragraphs summarizing your findings from this t-test.
What is the total sample size?
What are the mean (SD) CES-D scores at wave 1 and wave 2?
What is the mean difference between the two time periods?
What is the value of the t-statistic, number of degrees of freedom and the p-value(sig)?
Does the data support the hypothesis? Why or why not?
Part III
Using Polit2SetC dataset, run independent groups t-tests for three outcomes. The outcome variables are CES-D Score (cesd), SF12: Physical Health Component Score, standardized (sf12phys) and SF12: Mental Health Component Score, standardized (sf12ment).
Follow these steps when using SPSS:
Open Polit2SetC dataset.
Click Analyze then click Compare Means, then Independent Sample T-test.
Move the Dependent Variables (.
WEEK 7 – EXERCISES Enter your answers in the spaces pr.docxwendolynhalbert
WEEK 7 – EXERCISES
Enter your answers in the spaces provided. Save the file using your last name as the beginning of the file name (e.g., ruf_week6_exercises) and submit via “Assignments.” When appropriate,
show your work
. You can do the work by hand, scan/take a digital picture, and attach that file with your work.
A sports researcher gave a standard written test of eating habits to 12 randomly selected professionals, four each from baseball, football, and basketball. The results were as follows:
Eating Habits Scores
Baseball Players
Football Players
Basketball Players
34
27
35
18
28
44
21
67
47
65
42
61
Is there a difference in eating habits among professionals in the three sports? (Use the .05 significance level.)
a.
Use the five steps of hypothesis testing.
b.
Sketch the distribution involved.
c.
Determine effect size.
2.
To study the effectiveness of treatments for insomnia, a sleep researcher conducted a study with 12 participants.
Four participants were instructed to count sheep (Sheep Condition), four were told to concentrate on their breathing (Breathing Condition), and four were not given any special instructions. Over the next few days, measures were taken of how many minutes it took each participant to fall asleep. The average times for the participants in the Sheep Condition were 14, 28, 27, and 31; for those in the Breathing Condition, 25, 22, 17, and 14; and for those in the control condition, 45, 33, 30, and 41.
Do these results suggest that the different techniques have different effects?
(Use the .05 significance level.)
a.
Use the five steps of hypothesis testing.
b.
Sketch the distribution involved.
c.
Figure the effect size of the study.
d.
Explain your findings (including the logic of comparing within-group to between-group population variance estimates, how each of these is figured, and the
F
distribution).
High school juniors planning to attend college were randomly assigned to view one of four videos about a particular college, each differing according to what aspect of college life was emphasized: athletics, social life, scholarship, or artistic/cultural opportunities. After viewing the videos, the students took a test measuring their desire to attend this college. The results were as follows:
Desire to Attend this College
Athletics
Social Life
Scholarship
Art/Cultural
68
89
74
76
56
78
82
71
69
81
79
69
70
77
80
65
Do these results suggest that the type of activity emphasized in a college film affects desire to attend that college? (Use the .01 significance level.)
a.
Use the five steps of hypothesis testing.
b.
Sketch the distribution involved.
c.
Figure the effect size of the study.
d.
Explain the logic of what you have done to a person who is unfamiliar with the analysis of variance.
A team of psychologists designed a study in which 12 psychiatric patients diagnosed as having generalized anxiety disorder were randomly assigned to one of three new types of th.
Assessment 3 – Hypothesis, Effect Size, Power, and t Tests.docxcargillfilberto
Assessment 3 – Hypothesis, Effect Size, Power, and
t
Tests
Complete the following problems within this Word document. Do not submit other files. Show your work for problem sets that require calculations. Ensure that your answer to each problem is clearly visible. You may want to highlight your answer or use a different type color to set it apart.
Hypothesis, Effect Size, and Power
Problem Set 3.1: Sampling Distribution of the Mean Exercise
Criterion:
Interpret population mean and variance.
Instructions:
Read the information below and answer the questions.
Suppose a researcher wants to learn more about the mean attention span of individuals in some hypothetical population. The researcher cites that the attention span (the time in minutes attending to some task) in this population is normally distributed with the following characteristics: 20
36
. Based on the parameters given in this example, answer the following questions:
1. What is the population mean (μ)? __________________________
2. What is the population variance
? __________________________
3. Sketch the distribution of this population. Make sure you draw the shape of the distribution and label the mean plus and minus three standard deviations.
Problem Set 3.2: Effect Size and Power
Criterion:
Explain effect size and power.
Instructions:
Read each of the following three scenarios and answer the questions.
Two researchers make a test concerning the effectiveness of a drug use treatment. Researcher A determines that the effect size in the population of males is
d
= 0.36; Researcher B determines that the effect size in the population of females is
d
= 0.20. All other things being equal, which researcher has more power to detect an effect? Explain. ______________________________________________________________________
Two researchers make a test concerning the levels of marital satisfaction among military families. Researcher A collects a sample of 22 married couples (
n
= 22); Researcher B collects a sample of 40 married couples (
n
= 40). All other things being equal, which researcher has more power to detect an effect? Explain. ______________________________________________________________________
Two researchers make a test concerning standardized exam performance among senior high school students in one of two local communities. Researcher A tests performance from the population in the northern community, where the standard deviation of test scores is 110 (
); Researcher B tests performance from the population in the southern community, where the standard deviation of test scores is 60 (
). All other things being equal, which researcher has more power to detect an effect? Explain. ______________________________________________________________________
Problem Set 3.3: Hypothesis, Direction, and Population Mean
Criterion:
Explain the relationship between hypothesis, tests, and population mean.
Instructions:
Read the following and answer the questions.
Answer the questions below, following the Submission Requirements .docxjustine1simpson78276
Answer the questions below, following the Submission Requirements as specified at the end of the assessment.
Assessment Concepts
Question
Concept
Question 1
SPSS: One-Variable Chi Square
Question 2
SPSS: One-Variable Chi Square
Question 3
Chi-Square as a Test of Independence
Question 4
SPSS: Two-Variable Chi-Square
Question 5
Measures of Effect Size
Question 6
Power and the Factors Affecting It
Question 7
Power and the Factors Affecting It
Question 8
Correlational Studies
Question 9
Correlation: Relationship Direction
Question 10
SPSS: Scatterplot
Question 11
SPSS: Pearson r
Question 12
SPSS: Pearson r
Question 1
Complete the following steps:
1. Open the SPSS file assessment5a.sav linked in the Resources under the Required Resources heading.
2. At the top of the screen, click on Data, then select Weight Cases.
3. Click on Weight Cases By, click on Count, then click on the arrow next to Frequency Variable to send it over to the Test Variable box.
4. On the toolbar, click Analyze, then Nonparametric Tests, then Legacy Dialogs, the Chi Square.
5. Click on Favorite Color, then click on the arrow to send to the Test Variable List window.
6. Under Expected Values, select Value, then enter the following four values in order: 43, 58, 253, 414.
7. Click OK and copy and paste the output to your Word document.
Question 2
There are 218 first graders in an elementary school. Of these first graders, 86 are boys, and 132 are girls. School-wide, there are 753 boys and 1063 girls. The principal would like to know if the gender ratio in first grade reflects the gender ratio across the school.
Complete the following:
1. Identify the null hypothesis.
2. What are the degrees of freedom (df)?
3. Complete the table (complete in SPSS and paste the output into your Word document):
Question 2
Men
Women
Number Observed
Number Expected
Number Observed
Number Expected
4. Calculate χ² in SPSS and paste the output into your Word document.
5. Can you reject the null hypothesis at α = .05?
Question 3
You recently read a magazine article stating that professionals who attended college online tend to earn higher salaries than professionals who attended brick-and-mortar universities. Identify this study's two variables.
Question 4
Complete the following steps:
1. Open the SPSS file assessment5b.sav linked in the Resources under the Required Resources heading.
2. At the top of the screen, click on Data, then select Weight Cases.
3. Click on Weight Cases By, click on Count, then click on the arrow next to Frequency Variable to send it over to the Test Variable box.
4. On the toolbar, click Analyze, then Descriptive Statistics, then Crosstabs.
5. Click on Team Placement, then click on the arrow to send to the Rows window.
6. Click on Gender, then click on the arrow to send to the Columns window.
7. Click on the Statistics button, then check the box for Chi-Square. Click Continue.
8. Click on the Cells button, then check the box for Expected. Click Continue.
9. Click OK, and.
PSYC 354Homework 8Single-Sample T-TestWhen submitting this f.docxpotmanandrea
PSYC 354
Homework 8
Single-Sample T-Test
When submitting this file, be sure the filename includes your full name, course and section. Example: HW8_JohnDoe_354B01
Be sure you have reviewed this module/week’s lesson and presentations along with the practice data analysis before proceeding to the homework exercises. Complete all analyses in SPSS, then copy and paste your output and graphs into your homework document file. Answer any written questions (such as the text-based questions or the APA Participants section) in the appropriate place within the same file.
Part I: Concepts
Questions 1–3; Answer the questions in the spaces provided.
Part I: Questions 1a-e
Fill in the highlighted blanks with the best word or words.
1-a)
You use a t-test when you know the population ________ but not the population ________.
1-b)
The 2 groups compared in the single-sample t-test are the sample and the ________.
1-c)
The number of scores that are free to vary when you are estimating a population parameter from a sample is called the ________.
1-d)
A researcher reports the results of a single-sample t-test as t(23) = 3.96. The degrees of freedom for this t-test are ______, which means there were ____ total participants in the researcher's sample.
1-e)
When your t-statistic in your results exceeds your critical cutoffs, you ________ the null hypothesis.
Part I: Question 2-3
2)
Explain what each part of the following statistical phrase represents, as it would be reported in APA format: t(19) = 3.15, p = .04
t
Answer
19
Answer
3.15
Answer
P
Answer
.04
Answer
3)
Calculate the degrees of freedom and identify the critical t value for a single-sample t test in each of the following situations:
3-a) Two-tailed test, N = 9, p = .10
df= Answer
critical t = Answer
3-b) Two-tailed test, N = 16, p = .05
df= Answer
critical t = Answer
3-c) One-tailed test, N = 21, p = .01
df= Answer
critical t = Answer
Part II: SPSS Analysis
Module 8 Exercise File 1
Part II:
Questions 1-2
· Open Module 8 Exercise File 1. This file contatins scores on a measure of acute PTSD for 12 children who live in an area recently affected by a natural disaster. Higher scores indicate more acute PTSD symptomology.
· Using these data, run 2 separate single-sample t-tests to compare the sample’s mean acute PTSD score to the following population values:
Population means on PTSD measure for 2 different populations
Population of children in the US: = 12
Population of children in the US who have been victims of abuse : = 16.2
· For each test, paste the output and write a Results section in current APA style
· As demonstrated in the presentations and in the textbooks.
· There will be 2 sets of output and 2 results sections using this data set
· 1 for each test involving a different population mean.
1-a)
Population of children in the US: = 12.
Answer: SPSS output of the t-Test
1-b)
Write a results section in current APA style describing the ou ...
ANOVA is a hypothesis testing technique used to compare the equali.docxjustine1simpson78276
ANOVA is a hypothesis testing technique used to compare the equality of means for two or more groups; for example, it can be used to test that the mean number of computer chips produced by a company on each of the day, evening, and night shifts is the same. Give an example of an application of ANOVA in an industrial, operations, or manufacturing setting that is different from the examples provided in the overview. Discuss and share this information with your classmates.
In responding to your peers, select responses that use an ANOVA application that is different from your own. Are the results of the ANOVA application statistically significant? Why are the results significant or not significant? Explain your reasoning. Consider how ANOVA could be applied to the final project case study.
Support your initial posts and response posts with scholarly sources cited in APA style.
https://statistics4beginners.wordpress.com/2015/02/18/how-to-calculate-anova-in-excel-2013/
PLEASE GIVE A 1-2 PARAGRAPH RESPONSE TO THE FOLLOWING:
1.
In this module, our goal is to learn the statistical process of comparing several population means through a procedure called "analysis of variance", or ANOVA. ANOVA uses the variance from the mean of 2 or more sample populations to see if there is a statistically significant difference between them (Sharpe, DeVeaux, Velleman, 2016). We've learned that this is a valuable tool in all sorts of areas of study, including automotive, chemical, and medical industries.
There are many practical examples of ANOVA throughout business. As previously mentioned, the medical field can benefit from the use of this statistics tool. For example, a drug company may be interested in the results of clinical trials for a few new drugs they plan to release. Medicine A, B, and C are all now in the clinical testing phase, so the instances in which each cures a specific ailment can be summed up using ANOVA. Each of the individual drugs, through the course of multiple trials, will have a number of "cured" patients. The following is an example of what the results may be, in table format:
A B C
Trial 1 4 9 2
2 5 8 7
3 7 1 6
4 6 1 5
5 6 4 9
Using ANOVA to evaluate the variance from the mean for each trial, the ultimate goal would be to compare each trial to one another. By comparing the variance, we can say, with statistical confidence, that one medicine may be more effect.
statistics/cf_choose_a_statistical_test (1) (1).pptx
Independent Variable [IV]
(number of groups)Dependent Variable [DV]
(measurement level) Two Groups
Three + Groups
Independent
(“unpaired”)Dependent
(“paired”)Independent
(“unpaired”)
Dependent
(“paired”)
CategoricalNon-parametric TestsChi-squareMcNemar’sChi-square
Cochran’s QOrdinal Mann-Whitney UWilcoxon Signed ranksKruskal Wallis HFriedman’sInterval / Ratio
(continuous)Parametric TestsIndependent
t-testDependent
t-testANOVARM-ANOVA
“What is the effect of TREATMENT (IV) on our OUTCOME (DV) of interest?”
Example: TREATMENT independent groups (placebo versus drug), OUTCOME interval/ratio (blood pressure)
Example: TREATMENT dependent group (pre/post yoga therapy), OUTCOME ordinal (back pain levels)
Example: TREATMENT independent 3+ groups (yoga therapy, none, aerobics), OUTCOME categorical (pass/fail of driving test)CorrelationsPhi coefficientSpearman’s rhoPearson’s r
Independent Variable
(number of groups)Dependent Variable (measurement level) Two Groups
Three + Groups
Independent
(“unpaired”)Dependent
(“paired”)Independent
(“unpaired”)
Dependent
(“paired”)
CategoricalNon-parametric TestsChi-squareMcNemar’sChi-square
Cochran’s QOrdinal Mann-Whitney UWilcoxon Signed ranksKruskal Wallis HFriedman’sInterval / Ratio
(continuous)Parametric TestsIndependent
t-testDependent
t-testANOVARM-ANOVA
STEP #1
Check what measurement level your DV is.
STEP #2
Choose the column related to the number Groups in your study.
STEP #3
Choose the column where intervention groups are either “paired” or “unpaired.”
STEP #4
Match your column with the row to find which test
to run.
STEP #1
Look at your Dependent Variable or outcome.
The data that we are looking at here is from the instruments you used to measure the effect of your intervention. Maybe you chose to measure stress with a commonly used psychological questionnaire or maybe you measured cholesterol levels or test scores.
What is its measurement level?
Categorical (such as yes or no; dead or alive; pass or fail).
Ordinal (such as health status – poor, average, excellent).
Interval ratio (for instance blood pressure, cholesterol level, rates of infection, or workplace satisfaction scores on a scale of 0-100).
STEP #2
Next you will look for the column that corresponds to the number of groups you have for your Independent Variable (also called experimental or predictor variable).
Remember, the independent variable is the thing in your study that was controlled by you (such as a medical intervention, or training initiative, or implementation of a modified protocol) for the purpose of making a change on some outcome in the population you are studying.
So…how many groups were involved in this intervention?
For example, if you were testing the effect of an evidence-based training initiative on employee workplace satisfaction or happiness, you might be interested in comparing the training initiative in one group to no training in another group..
WEEK 8 – EXERCISESEnter your answers in the spaces pro.docxwendolynhalbert
WEEK 8 – EXERCISES
Enter your answers in the spaces provided. Save the file using your last name as the beginning of the file name (e.g., ruf_week8_exercises) and submit via “Assignments.” When appropriate,
show your work
. You can do the work by hand, scan/take a digital picture, and attach that file with your work.
1.
A researcher plans a study in which a crucial step is offering participants a food reward. It is important that the three food rewards be equal in appeal. Thus, a prestudy was designed in which participants were asked which of the rewards they preferred. Of the 60 participants, 16 preferred cupcakes, 26 preferred candy bars, and 18 favored dried apricots. Do these scores suggest that the different foods are differentially preferred by people in general? (Use the .05 significance level.)
a.Use the five steps of hypothesis testing.
b.Sketch the distribution involved.
c.Explain your findings.
2.
A high school principal wanted to know if the racial makeup of her teachers mirrored that of the student body. The student body broke down into 47% White, 28% Latino, 15% African American, and 10% other. Of the 65 teachers, 42 were White, 4 were Latino, 15 were African American, and 4 were Other. Do these results suggest that the racial makeup of the faculty members is different from that of the students? (Use the .05 significance level.)
Use the five steps of hypothesis testing and explain your findings.
3.
Please make up and discuss research examples corresponding to the various techniques introduced throughout this course. Describe a plausible study for each of the following statistical procedures, indicating how it would apply and what results you would predict. Also include information about the number of participants you would assess and how you would go about estimating effect size and statistical power (when relevant).
a.correlation
b.multiple regression
c.
t
test for independent means
d.
t
test for dependent means
e.ANOVA
f.chi square for goodness of fit
g.chi-square test for independence
SPSS ASSIGNMENT #8
Chi-Square
SPSS instructions:
Chi-Square Test for Goodness of Fit:
Open SPSS
Remember that SPSS assumes that all the scores in a row are from the same participant. In the study presented in #1, there are 20 students, some of whom have been suspended for misbehavior. The primary conflict-resolution style used by each student is also entered. [Ignore the first variable in this analysis.]
When you have entered the data for all 20 students, move to the Variable View window and change the first variable name to “SUSPEND” and the second to “STYLE”. Set the number of decimals for both variables to zero.
Click Analyze
à
Non-Parametric Tests
à
Chi-Square
Click the variable “STYLE” and then the arrow next to the box labeled “Test Variable List” to indicate that the chi-square for goodness of fit should be conducted on the conflict-resolution style variable.
N.
P
A
G
E
5
Ryerson University
Daphne Cockwell School of Nursing
CNUR 860 WINTER 2022 Major Statistics Week 10
Course Leader Dr Elaine Santa Mina
This assignment is worth 30 marks
THE QUESTIONS ON THIS ASSIGNMENT ARE Three (3) PAGES IN LENGTH
There is no page limit to your paper.
This assignment accompanies the RNAO Best Practice Guideline:
Registered Nurses’ Association of Ontario (2005). Nursing Care of Dyspnea: The 6th
Vital Sign in Individuals with Chronic Obstructive Pulmonary Disease (COPD). Toronto,
Canada: Registered Nurses’ Association of Ontario.
Prepare your assignment as per APA 5th format, inclusive of a title page, pages
numbered, double spaced , reference page etc. DO NOT RECOPY Question format and
DO NOT INSERT ANSWERS IN POINT FORM; Reference your Salkind text
appropriately
Grading: Assignments completed in point form will NOT be accepted for grading.
This is an individual assignment, not a group assignment, see course syllabus
directions to not share files, papers, or any part of your assignment with another
student, as that constitutes academic misconduct.
Answer each research question separately…do not combine answers across questions.
There will be a 5 mark deduction, if APA format for a scholarly paper is not followed,
and/ or if responses to questions are combined.
Please remember: If you decide a pearson r is required in the hypothesis test, on
your output the correct significance in the correlation to interpret is the significance for
the p value beside the independent variable. The written excel directions are correct.
There is an error in the captivate lab which incorrectly indicates that you are to use the p
value for the intercept
Use the CNUR 860 Major STATS assignment database and study abstract for this
assignment. For the following three research scenarios, answer the research questions by
conducting the requested analyses. Each question is worth a total of 10 marks for a total
of 30 marks for this assignment. The distribution of marks is similar to the distribution
on your mini stats assignments.
FOR EACH RESEARCH QUESTION CONDUCT ALL RELEVANT:
a) descriptive stats = 4 marks (2 marks per variable) Conduct the appropriate
descriptive statistical analyses to answer this research question. Include in the descriptive
analyses, all outputs, (include graphs: histograms/bar graphs, for the descriptives, if you think they are
helpful in the presentation of your answer) with legends as required and discuss findings of
descriptives
b) inferential = 4 marks, Include each step of the hypothesis test.
P
A
G
E
5
Correct null and research hypotheses = .25
No grade is given for identification of target population, sample population or IV and DV
and level of measure, (grades for IV and DV are included in descriptives), but if omitted,
there will be a deduction of .1 for each omission
No grade is given for level ...
Hypothesis Testing Definitions A statistical hypothesi.docxwilcockiris
Hypothesis Testing
Definitions:
A statistical hypothesis is a guess about a population parameter. The guess may or not be
true.
The null hypothesis, written H0, is a statistical hypothesis that states that there is no
difference between a parameter and a specific value, or that there is no difference between
two parameters.
The alternative hypothesis, written H1 or HA, is a statistical hypothesis that specifies a
specific difference between a parameter and a specific value, or that there is a difference
between two parameters.
Example 1:
A medical researcher is interested in finding out whether a new medication will have
undesirable side effects. She is particularly concerned with the pulse rate of patients who
take the medication. The research question is, will the pulse rate increase, decrease, or
remain the same after a patient takes the medication?
Since the researcher knows that the mean pulse rate for the population under study is 82
beats per minute, the hypotheses for this study are:
H0: µ = 82
HA: µ ≠ 82
The null hypothesis specifies that the mean will remain unchanged and the alternative
hypothesis states that it will be different. This test is called a two-tailed test since the
possible side effects could be to raise or lower the pulse rate. Notice that this is a non
directional hypothesis. The rejection region lies in both tails. We divide the alpha in two
and place half in each tail.
Example 2:
An entrepreneur invents an additive to increase the life of an automobile battery. If the
mean lifetime of the automobile battery is 36 months, then his hypotheses are:
H0: µ ≤ 36
HA: µ > 36
Here, the entrepreneur is only interested in increasing the lifetime of the batteries, so his
alternative hypothesis is that the mean is greater than 36 months. The null hypothesis is
that the mean is less than or equal to 36 months. This test is one-tailed since the interest
is only in an increased lifetime. Notice that the direction of the inequality in the alternate
hypothesis points to the right, same as the area of the curve that forms the rejection
region.
Example 3:
A landlord who wants to lower heating bills in a large apartment complex is considering
using a new type of insulation. If the current average of the monthly heating bills is $78,
his hypotheses about heating costs with the new insulation are:
H0: µ ≥ 78
HA: µ < 78
This test is also a one-tailed test since the landlord is interested only in lowering heating
costs. Notice that the direction of the inequality in the alternate hypothesis points to the
left, same as the area of the curve that forms the rejection region.
Study Design:
After stating the hypotheses, the researcher’s next step is to design the study. In designing
the study, the researcher selects an appropriate statistical test, chooses a level of
significance, and formulates a plan for conducting the study..
Similar to Assignment 2 Tests of SignificanceThroughout this assignment yo.docx (16)
In a two- to three-page paper (excluding the title and reference pag.docxrock73
In a two- to three-page paper (excluding the title and reference pages), explain the purpose of an income statement and how it reflects the firm’s financial status. Include important points that an analyst would use in assessing the financial condition of the company. Also, analyze Ford Motor Company’s income statement from its
2012 Annual Report
.
Your paper must be formatted according to APA style, and must include citations and references for the text and at least two scholarly sources.
.
In a substantial paragraph respond to either one of the following qu.docxrock73
In a substantial paragraph respond to either one of the following questions:
1.) Choose one source of energy, explain its origins, how does it impact our Earth, and what effect does it have on our planet?
OR
2.) Explain, with details, how geology influences the distribution of natural resources.
NO MINIMUM WORD LENGTH REQUIRED.
.
In a study by Dr. Sandra Levitsky, she considers why the economic,.docxrock73
In a study by Dr. Sandra Levitsky, she considers why the economic, physical, and emotional challenges of providing chronic care for a family member have not produced more salient political demands for aggressive policy intervention (Hudson, 2014).
Discuss her findings as well as your own theory on why there has not been a stronger demand from the public for policy intervention to assist caregivers.
Support your statements with evidence from the Required Studies and your research. Cite and reference your sources in APA style.
References
Hudson, R. (Ed). (2014).
The new politics of old age policy
(3rd ed.). Baltimore, John Hopkins.
.
In a response of at least two paragraphs, provide an explanation o.docxrock73
In a response of at least two paragraphs, provide an explanation of the steps you took to rewrite the Romantic poem you selected. Your explanation should point out at least three typically modernist qualities in your work with regard to elements such as
language, style, literary elements, and themes. Here, as an example, is a brief explanation of the modernist rewrite of the first stanza of Wordsworth
’s “I Wandered Lonely as a Cloud”:
.
in a minimum of 1000 words, describe why baseball is Americas past .docxrock73
in a minimum of 1000 words, describe why baseball is America's past time. As part of your paper you can share some of your memories of baseball. How did baseball mirror society(good and bad?) as a reflection of American society. Be sure to cite all of your sources and you must show direct evidence of integrating your textbook once per chapter as part of your final exam. Your paper should at include at least one resource from the library.
.
In a minimum 200 word response, describe some ways how the public .docxrock73
In a minimum 200 word response, describe some ways how the public has responded to the October 2001 USA Patriot Act. Has the public’s response been positive or negative? What are some pros and cons of the USA Patriot Act with the American public? Explain your answer.
Dempsey, J. S., & Forst, L. S. (2011, Pg. 213-214).
Police
. Clifton Park, NY: Delmar.
.
In a weekly coordination meeting, several senior investigators from .docxrock73
In a weekly coordination meeting, several senior investigators from the state crime lab request that AB Investigative Services (ABIS) prepare a standard operations procedure document concerning the general processing of computer evidence. Recent forensic investigator actions during the processing of computer evidence have failed to show understanding of how computer data are created, modified, and stored. In addition, the investigators have not understood the underlying technical issues tied to evidence processing and associated security issues. Provide four general evidence processing guidelines to ensure investigators understand the steps of processing evidence and the results when standard operating procedures are not followed.
Please submit your assignment.
.
In a memo, describe 1) the form and style of art as well as 2) the e.docxrock73
In a memo, describe 1) the form and style of art as well as 2) the engineering phenomenon – a substantial paragraph for each. You will need to research both the art and engineering, so each section of the memo should include citations from credible sources.
i need to wrote two paragraph also incloude two citation for each one
.
In a minimum 200 word response explain the problems that law enforce.docxrock73
In a minimum 200 word response explain the problems that law enforcement officials have faced regarding the issues of federal, state, and local jurisdictions attempting to intervene in tribal policing. How has this issue contributed to confusion and discontent with law enforcement? Dempsey, J. S., & Forst, L. S. (2011, Pg. 22-25). Police. Clifton Park, NY: Delmar.
.
In a minimum 200 word response explain some of the reasons why, in.docxrock73
In a minimum 200 word response explain some of the reasons why, in the context of span of control, it is more beneficial to
limit the number of officers reporting to one supervisor.
What factors can affect how many employees are supervised at one time?
Dempsey, J. S., & Forst, L. S. (2011, Pg.
Pg. 35-40
).
Police
. Clifton Park, NY: Delmar.
.
In a maximum of 750 words, you are required to1. Summarize the ar.docxrock73
In a maximum of 750 words, you are required to:
1. Summarize the article (include all necessary background information);
2. Identify, discuss and analyze the main issue covered in the article, making links to all secondary
issues, theories and concepts;
3. Critique the actions taken by management and the union, (i.e., what did each do particularly
well or poorly); and
4. Discuss how the event in the article affects the lives of people other than those in management
or the union
.
in a two- to- three page paper (not including the title and referenc.docxrock73
in a two- to- three page paper (not including the title and reference pages), explain how Foreign Direct Investment (FDI) would cause an increase in the BRIC (Brazil, Russia, India, and China) countries’ Gross Domestic Product (GDP).
Your paper must be formatted according to APA Style and include at least two scholarly sources to support your assertions.
.
In a two- to three-page paper (not including the title and reference.docxrock73
In a two- to three-page paper (not including the title and reference pages), explain the purpose of a balance sheet and how it reflects the firm’s financial status. Analyze Ford Motor Company’s balance sheet from its
2012 Annual Report
.
Your paper must be formatted according to APA style and it must include citations and references for the text and at least two scholarly
.
In a group, take a look at the two student essays included in this f.docxrock73
In a group, take a look at the two student essays included in this folder. For each of these essays: (1) outline the organization of the components, (2) label the components, (3) name the audience and purpose, (4) decide if you found the organization of the components to be effective, and if the components themselves were well written or poorly written. You'll type your notes into a Microsoft Word document, include the names of all group members, and then upload the document individually to your own iLearn dropbox.
.
BASEBALLRuns Scored (X)Wins (Y)7086987590654797048078795730716678661963867976457455667707918559674381731946418965471735797357361556
Develop a position paper on best practices for teaching English Learners. This paper should contain the student’s personal beliefs about and the best models to practice. Statements must be supported with research data. There must be at least THREE references. The textbook may serve as ONE reference (Education English Learners for a Transformed World) The paper must be typed using APA style, double spaced, and with a title page and a reference page. The paper should be no less than three pages in length.
The positon paper: why two way is the best method in Bilingual Education
1) Please explain the components of the Prism Model and why these components are important in creating a welcoming school that promotes success for English Learners.
2) There have been many programs and ideas in the US Public schools for how best to serve English Learners and close the gap between those who enter school speaking English and those who have to learn English along the way.
Following is a list of Bilingual Education Models that have been tried. According to the text book and the research of Virginia Collier and Wayne Thomas, please rate the following programs from 1-6 with 1 being the most effective program for student success and 6 being the least effective program for learning English:
__________Maintenance Bilingual Ed., Self-Contained
__________Transitional Bilingual Ed.
__________One-way Dual Language
__________Pull-out Bilingual Ed.
__________Two-way Dual Language
__________Enrichment Bilingual Education (30 min. per day)
The following programs are designed for ELs who do not live in an area where bilingual ed. is available or do not qualify for bilingual education due to the language they speak. Please rate the following ESL programs on a scale of 1-4 with 1 being the most successful way to teach English and 4 being the least effective program:
__________ESL Pull-out
__________Sheltered Instruction in the regular classroom
__________Total emersion with no language support
__________English enrichment, 30 minutes per day, by classroom teacher
3) Please explain the difference between a 50/50 model and a 90/10 model of Dual Language Education.
4) Why does 2-way Dual Language Education usually have better results than 1-way Dual Language Education?
5) In order to have an effective Dual Language program, there are two important things teachers should not do. What are they?
6) What does it mean to see other cultures not as a deficit but as a difference? Why is this idea important to your classroom?
7) We are required to have many formal assessments in our educational curriculum. However, informal assessment can be much more informative to the teacher of language learners. Please explain why Informal Assessments might be a better way for the teacher to know the true level of the student.
...
Based on Santa Clara University Ethics DialogueEthics .docxrock73
Based on Santa Clara University Ethics Dialogue
Ethics case studies
This is an extra credit assignment that I am offering for the first time this term. In this booklet, you will find 38 separate case studies. You are free to respond to any or all of these cases.
You may earn up to 5 extra credit points per question, based on the complexity of the case and the logic of your response. You may not earn more than 100 points (10 percent of your final grade).
You may find it helpful to read the paper “Four Tough Ethical Dilemmas” prior to responding.
While these are your opinions, citations are not expected; however, if you make use of the work of others, include APA style citations for complete credit.
Either cut and paste the cases you select to a separate file or use this file for your submission. If you use this file to submit a response, please delete those cases to which you are not responding.
Dr. Frick
Case 1: Family Loyalty vs. Meritocracy
A man was appointed president of the newly-acquired Philippine subsidiary of a large American company. He was reviewing the organization with the company's head of human resources. One thing the president noted was that the same names reoccurred frequently in several departments. "It is our tradition," commented the HR head. "Families take care of their own. If one family member gets a good job in a Philippine company, other members of the family apply to join that company and the first member there can help the whole family become successful by helping them get hired and by coaching them to be successful. The company benefits. Our costs of recruiting are lower, we know more about the people we hire, and the commitment to family success results in fewer performance and discipline problems because family members want to please their older relatives."
The president wondered how these practices would be regarded in a large American firm, and whether or not he should take action to change them.
1. Nepotism is not illegal, but is it ethical?
2. If the business is family-owned, does that make a difference?
3. How does national culture affect this discussion?
Case 2: Is the Two-Tier System Ethically Problematic
Employees at a cereal makers plant were “locked-out” from their jobs producing cereal for over 3 months. Company management and the union representing the employees reached a stalemate in negotiations resulting in the lockout. The union claims that the primary issue is the company’s demand of dramatically increasing the number of temporary workers, who would earn $6 less per hour and receive fewer benefits. Critics claim this effectively creates a two-tier system at the plant. Under the current agreement, the company may use temporary workers for up to 30% of the workforce, but the union claims the company is now pushing for 100%. The workers, who have had their health insurance suspended, fear that their jobs will either be replaced entirely by temporary workers, or they will be f ...
Barbara Corcoran Learns Her Heart’s True Desires In her.docxrock73
Barbara Corcoran Learns Her Heart’s True Desires
In her hilarious and lighthearted book, Shark Tales: How I Turned $1,000 Into a
Billion Dollar Business, Barbara Corcoran demonstrates the importance of knowing what
you really want out of life (Corcoran & Littlefield, 2011). As her title suggests, Barbara
founded her real estate company, The Corcoran Group, with only $1,000 and some big
dreams. Shortly after founding the company, Barbara took out a piece of paper and wrote
down some big goals for herself and the company. In 1978, she had only 14 sales agents
working for her, who earned a total of $250,000 in commissions. She set a goal of
doubling the number of agents and the commissions every year. So she put down 28 sales
people for 1979, 56 for 1980, and so on, all the way up to 1,792 salespeople in 1985 with
total commissions of $32,000,000. Barbara was amazed when she saw the fantastic sums
projected for 1985, and of course many people, when they see such amazing sums, would
dismiss the calculations as fantasy But as Barbara put it, she went to work the next day
hustling hard for her $32 million.
Real estate agents are paid largely by commission, which is about as close as you
can get to a pure form of contingent reward for performance. However, Barbara didn’t
rely solely on the commissions to motivate her workers. She threw theme parties and held
numerous social events to build a committed workforce. Good sales agents could always
move to another firm, but not every firm had Barbara’s positive attitude and fun-filled
atmosphere. In the early years of the firm, when money was tight, Barbara and her
relatives did the cooking for the outings and parties, and she found clever ways to
entertain people with skating parties and other lively activities. As the firm became larger
and more profitable, she even hired professional entertainers for the company’s midweek
picnics, which included elephant shows, daring rides on hot air balloons, horses, or
Harley Davidsons, etc. Barbara stated “I built my company on pure fun, and believe that
fun is the most underutilized motivational tool in business today. All of my best ideas
came when I was playing outside the office with the people I worked with” (Corcoran &
Littlefield, 2011, p. 283). What did she get in return for the fun atmosphere? She had the
“most profitable real estate company per person in the United States” (p. 284). By the
time she sold her agency in 2001, she had 1,000 agents working for her, and she had the
largest real estate agency in New York – clearly her motivational strategies attracted a
large number of productive employees.
Barbara Corcoran had sold her firm for $66 million. She thought that would make
her happy, but instead, it made her sad. Although she pretended to be happy with her new
wealth and freedom, she was “secretly miserable” (Corcoran & Littlefield, 2011, p. 232).
She had lost her purpose ...
Bapsi Sidhwa’s Cracking India
1947 Partition
Deepa Mehta’s earth (1998)
Characters
Aamir Khan - Dil Navaz, the Ice Candy Man
Nandita Das - Shanta, the Ayah
Rahul Khanna - Hassan, the Masseur
Maia Sethna - Lenny Sethna
Shabana Azmi - older Lenny, narrator
Kitu Gidwani - Bunty Sethna
Arif Zakaria - Rustom Sethna
Kulbhushan Kharbanda - Imam Din
Kumar Rajendra - Refugee Police
Pavan Malhotra - Butcher
IN Deepa Mehta’s words
I wanted desperately to make CRACKING INDIA into a film, a particular film, EARTH, which would be the second in my trilogy of the elements of Fire, Earth and Water.
Tracing Bapsi was no easy task but persevere we did and soon I was talking to Bapsi on the phone, hoping that the film rights to her book were still available. Two months later, thanks to David Hamilton's unwavering belief in the project, we owned the rights, had development funds, and I was sitting at my kitchen table, writing the screenplay of EARTH.
David and Anne Masson and I had worked together on FIRE and we re-assembled the team to begin the detailed planning of the production.
During this phase Bapsi became a friend and was exceedingly generous with information and old photographs. She would talk with me for hours about what it was like growing up in Lahore during those times. Lenny, after all, was based on Bapsi. In fact, Lenny was Bapsi.
The irony of our situation hasn't escaped Bapsi or myself. Bapsi is from Pakistan and now a US citizen. I'm from India and now living in Canada. If neither of us had moved from our respective homelands, the film just wouldn't have been possible. Pakistan and India, since the Partition of 1947, are sworn enemies. Not only have they fought three major wars against each other, but also, as I write this, both countries talk blithely about their nuclear capabilities and continue their militant aggression against each other across the still- disputed Kashmir border.
Fallen Women in the novel and film
Abducted women like Ayah and Hamdia, Lenny’s new nanny are viewed with suspicion from Lenny.
Page 226
“It isn’t a jail, Lenny baby…it’s a camp for fallen women.”
“What are fallen women?”
“Hai! The questions you ask! Your mother won’t like such talk…Now keep quiet”
“Are you a fallen woman?”
Fallen women – Abducted and raped women
In the aftermath of the 1947 declaration of Indian independence, the roughly drawn new state boundaries triggered what may have been the biggest migration in human history.
Historical consensus supports a figure of 12 million people displaced, although the BBC suggests figures as high as 14.5 million people. An undeclared civil war erupted as communities of Hindus, Muslims, and Sikhs fought one another to establish their own identities in their redefined homelands. And, in the process, the Indian government estimates, 83,000 women were abused and abducted. Others put the number even higher.
“Rather than being raped and abandoned,” Yasmin Khan writes in The Great Partition: The ...
Barriers of therapeutic relationshipThe therapeutic relations.docxrock73
Barriers of therapeutic relationship:
The therapeutic relationship between patient and nurse is often filled with barriers that can generate obstacles for the relationship and, in the end, the health system as a whole (Sfoggia et al.,2014). There are many factors that hinder building a therapeutic relationship: language, professional jargon, communication impairment, and cultural diversity (ibid).
Language:
Language can be an obstacle to nurse-patient communication because a patient may not be able to speak the same language and therefore communication is not possible (Levin,2006). The best way to overcome this barrier is providing a translator who can explain a professional facilitator's message easily to the patient(ibid). For instance, if the nurse only speaks English but the patient is only able to speak Arabic, a translation to the patient of what the professional facilitator is saying leads to less chance of misunderstanding (ibid). Translation also allows a patient to feel comfortable through being able to speak in their own language (ibid).
Medical jargon:
Jargon is a technical language that is comprehended by people in a specific industry or area of work (Leblanc et al.,2014). Health professionals often use jargon to communicate with each other(ibid). For example, T.B. disease stands for tubercle bacillus and HIV stands for human immunodeficiency virus (Mccrary & Christensen,1993). Jargon often makes sense to health professionals but a patient who does not understand these acronyms will not understand such communication, leading to a barrier in therapeutic relationship between patient and health professional (Leblanc et al.,2014).
Communication impairment:
Patients with communication impairment such as blindness, deafness and speech impairment often feel isolated, frustrated and self-conscious (O’Halloran et al.,2009). Some patients are born with such disabilities or have developed them as a result of disease (ibid). Therefore, nurses should provide enough time in order to describe any issue to such patients so that they do not feel uncomfortable or censured by health professionals, who must remain impartial (ibid).
Cultural diversity:
Patients often have various differences (Leblanc et al.,2014).Some of these differences are due to a patient's illness, social status, economic class, education and personality(ibid). However, according to Kirkham (1998), the deepest differences might be cultural diversity. Beheri (2009) points out that many nurses believe if they just treat patients with respect, they will avoid most cultural issues. Nevertheless, avoiding misunderstanding can be achieved through some knowledge of cultural customs, which might help and enable nurses to provide better health care to patients (ibid).
Facilitators of therapeutic relationship:
UNCRPD (2006) states that the most fundamental human right in hospital is communication. Patients are required to be provided with an effective communication method by nurs ...
Barada 2Mohamad BaradaProfessor Andrew DurdinReligions of .docxrock73
Barada 2
Mohamad Barada
Professor Andrew Durdin
Religions of the World Hum 201-02
March 23rd, 2018
References:
1. Rachel. Rachel’s Musings: Buddhism is a Religion. Retrieved from https://www.rabe.org/thoughts-on-buddhism/buddhism-is-a-religion/
2. Winfield, Pamela. The Conversation: Why so many Americans think Buddhism is just a philosophy. Retrieved from https://theconversation.com/why-so-many-americans-think-buddhism-is-just-a-philosophy-89488
Critical Analysis of the religious nature of Buddhism
The religious community often debates on whether Buddhism is categorized as a religion or as philosophical teaching. The answer to the question varies depending on an individual’s point of view. There are three main types of Buddhism practices across the world with each of them having smaller branches with slights variances in their teachings and beliefs. The different styles of Buddhist mainly encompass Theravada Buddhism, Vajrayana Buddhism, and Mahayana Buddhism. The various forms often have deities that are worshipped while others do not. Some often have scriptures while others do not usually believe in any physical form of the Buddhist teachings. The first article is authored by Rachel, a blogger, presenting the argument that Buddhism is a religion (Rachel, 1). On the other hand, the second article authored by Pamela Winfield recognizes Buddhism as a philosophy. Analyzing and comparing the two pieces having divergent views on the religious nature of Buddhism is crucial for understanding whether it is a religion or philosophy.
Summary of the articles
Rachel in her article considers Buddhism as a religion. The author acknowledges the fact that Mahayana Buddhism which is often found in greater part of Asia that includes Japan, Korea, and China often teaches on attaining enlightenment (Rachel, 1). The Mahayana often accept that every individual wishes to ensure the effective attainment of enlightenment and thus end the cycle of rebirth which others recognize as “Karma.” The article proceeds to state that Buddha is the greatest of the deities but is not worshipped. Instead, Buddha often inspires all those who practice doing as he once did. The author states that Buddhism often requires that the individuals that choose the wrong path attempt to re-accomplish these tasks in their next life alongside other punishments imposed on them by karma. The characteristics of this type of Buddhism thus often play a significant role in showing the religious nature of Buddhism. The author concludes by stating that Buddhism often contains all the different elements of a religion. Moreover, the article associates Buddhism with fallacies that characterize other religions and just as dangerous as other religions as well. A quote proves the claim on the dangerous nature of Buddhism that the author uses to summarize the teachings of Buddhism.
On the other hand, Winfield tends to focus on enlightening the readers on some of the aspects of Buddhism that ensures its a ...
2024.06.01 Introducing a competency framework for languag learning materials ...Sandy Millin
http://sandymillin.wordpress.com/iateflwebinar2024
Published classroom materials form the basis of syllabuses, drive teacher professional development, and have a potentially huge influence on learners, teachers and education systems. All teachers also create their own materials, whether a few sentences on a blackboard, a highly-structured fully-realised online course, or anything in between. Despite this, the knowledge and skills needed to create effective language learning materials are rarely part of teacher training, and are mostly learnt by trial and error.
Knowledge and skills frameworks, generally called competency frameworks, for ELT teachers, trainers and managers have existed for a few years now. However, until I created one for my MA dissertation, there wasn’t one drawing together what we need to know and do to be able to effectively produce language learning materials.
This webinar will introduce you to my framework, highlighting the key competencies I identified from my research. It will also show how anybody involved in language teaching (any language, not just English!), teacher training, managing schools or developing language learning materials can benefit from using the framework.
Palestine last event orientationfvgnh .pptxRaedMohamed3
An EFL lesson about the current events in Palestine. It is intended to be for intermediate students who wish to increase their listening skills through a short lesson in power point.
Introduction to AI for Nonprofits with Tapp NetworkTechSoup
Dive into the world of AI! Experts Jon Hill and Tareq Monaur will guide you through AI's role in enhancing nonprofit websites and basic marketing strategies, making it easy to understand and apply.
Unit 8 - Information and Communication Technology (Paper I).pdfThiyagu K
This slides describes the basic concepts of ICT, basics of Email, Emerging Technology and Digital Initiatives in Education. This presentations aligns with the UGC Paper I syllabus.
How to Make a Field invisible in Odoo 17Celine George
It is possible to hide or invisible some fields in odoo. Commonly using “invisible” attribute in the field definition to invisible the fields. This slide will show how to make a field invisible in odoo 17.
Operation “Blue Star” is the only event in the history of Independent India where the state went into war with its own people. Even after about 40 years it is not clear if it was culmination of states anger over people of the region, a political game of power or start of dictatorial chapter in the democratic setup.
The people of Punjab felt alienated from main stream due to denial of their just demands during a long democratic struggle since independence. As it happen all over the word, it led to militant struggle with great loss of lives of military, police and civilian personnel. Killing of Indira Gandhi and massacre of innocent Sikhs in Delhi and other India cities was also associated with this movement.
Model Attribute Check Company Auto PropertyCeline George
In Odoo, the multi-company feature allows you to manage multiple companies within a single Odoo database instance. Each company can have its own configurations while still sharing common resources such as products, customers, and suppliers.
Francesca Gottschalk - How can education support child empowerment.pptxEduSkills OECD
Francesca Gottschalk from the OECD’s Centre for Educational Research and Innovation presents at the Ask an Expert Webinar: How can education support child empowerment?
Read| The latest issue of The Challenger is here! We are thrilled to announce that our school paper has qualified for the NATIONAL SCHOOLS PRESS CONFERENCE (NSPC) 2024. Thank you for your unwavering support and trust. Dive into the stories that made us stand out!
Assignment 2 Tests of SignificanceThroughout this assignment yo.docx
1. Assignment 2: Tests of Significance
Throughout this assignment you will review mock studies. You
will needs to follow the directions outlined in the section using
SPSS and decide whether there is significance between the
variables. You will need to list the five steps of hypothesis
testing (as covered in the lesson for Week 6) to see how every
question should be formatted. You will complete all of the
problems. Be sure to cut and past the appropriate test result
boxes from SPSS under each problem and explain what you will
do with your research hypotheses. All calculations should be
coming from your SPSS. You will need to submit the SPSS
output file to get credit for this assignment. This file will save
as a .spv file and will need to be in a single file. In other
words, you are not allowed to submit more than one output file
for this assignment.
The five steps of hypothesis testing when using SPSS are as
follows:
1. State your research hypothesis (H1) and null hypothesis (H0).
2. Identify your confidence interval (.05 or .01)
3. Conduct your analysis using SPSS.
4. Look for the valid score for comparison. This score is
usually under ‘Sig 2-tail’ or ‘Sig. 2’. We will call this “p”.
5. Compare the two and apply the following rule:
a. If “p” is < or = confidence interval, than you reject the null.
Be sure to explain to the reader what this means in regards to
your study. (Ex: will you recommend counseling services?)
2. * Be sure that your answers are clearly distinguishable. Perhaps
you bold your font or use a different color.
ASSIGNMENT 2(200) WORD MINIUM
1. They allow us to see if our relationship is "statistically
significant". (Remember that this only shows us that there is or
is not a relationship but does NOT show us if it is big, small, or
in-between.)
2. It let's us know if our findings can be generalized to the
population which our sample was selected from and represents.
This week you will decide which test of significance you will
use for your project. For this class your choices for tests will
include one of the following:
· Chi-square
· t Test
· ANOVA
We will be using a process for hypothesis testing which outlines
five steps researchers can follow to complete this process:
1. Write your research hypothesis (H1) and your null hypothesis
(H0).
2. Identify and record your confidence interval. These are
usually .05 (95%) or .01 (99%).
3. Complete the test using SPSS.
4. Identify the number under Sig. (2-tail). This will be
represented by "p".
5. Compare the numbers in steps 2 and 4 and apply the
following rule:
1. If p < or = confidence interval, than you reject the null
hypothesis
Determine what to do with your null and explain this to your
reader. Be sure to go beyond the phrase "reject or fail to reject
the null" and explain how that impacts your research and best
describes the relationship between variables.
TEST QUESTIONS-NEED FULL ANSWERS
Q1
3. Make up and discuss research examples corresponding to the
various techniques introduced throughout this course. Describe
a plausible study for each of the following statistical
procedures, indicating how it would apply and what results you
would predict. Also include information about the number of
participants you would assess and how you would go about
estimating effect size and statistical power (when relevant). You
will want to address the following: sample, recruitment of
participants, who the sample will represent (ie the population),
what tests will be necessary to explore in a comprehensive way,
and all explanations. You do not need to create actual data, but
will have to justify why you chose which statistical procedures.
Q2
Make up and discuss research examples corresponding to the
various techniques introduced throughout this course. Describe
a plausible study for each of the following statistical
procedures, indicating how it would apply and what results you
would predict. Also include information about the number of
participants you would assess and how you would go about
estimating effect size and statistical power (when relevant). You
will want to address the following: sample, recruitment of
participants, who the sample will represent (ie the population),
what tests will be necessary to explore in a comprehensive way,
and all explanations. You do not need to create actual data, but
will have to justify why you chose which statistical procedures.
Question 2 of 2
10.0 Points
t test for independent means
t Tests
t Test for a Single Sample (20 points)
4. Open SPSS
Enter the number of activities of daily living performed by the
depressed clients studied in #1 in the Data View window.
In the Variable View window, change the variable name to
“ADL” and set the decimals to zero.
Click Analyze ( Compare Means ( One-Sample T test ( the
arrow to move “ADL” to the Variable(s) window.
Enter the population mean (14) in the “Test Value” box.
Click OK.
1. Researches are interested in whether depressed people
undergoing group therapy will perform a different number of
activities of daily living after group therapy. The researchers
have randomly selected 12 depressed clients to undergo a 6-
week group therapy program.
Use the five steps of hypothesis testing to determine whether
the average number of activities of daily living (shown below)
obtained after therapy is significantly different from a mean
number of activities of 17 that is typical for depressed people.
(Clearly indicate each step).
Test the difference at the .05 level of significance and at the .01
level (in SPSS this means you change the “confidence level”
from 95% to 99%).
As part of Step 5, indicate whether the behavioral scientists
should recommend group therapy for all depressed people based
on evaluation of the null hypothesis at both levels of
significance and calculate the measure of association.
5. CLIENT
AFTER THERAPY
A
18
B
14
C
11
D
25
E
24
F
17
G
14
H
10
I
23
J
11
K
22
L
19
t Test for Dependent Means (20 points)
Open SPSS
Enter the number of activities of daily living performed by the
depressed clients studied in Problem 2 in the Data View
window. Be sure to enter the “before therapy” scores in the first
column and the “after therapy” scores in the second column.
In the Variable View window, change the variable name for the
first variable to “ADLPRE” and the variable name for the
6. second variable to “ADLPOST”. Set the decimals for both
variables to zero.
Click Analyze ( Compare Means (Paired-Samples T Test (the
arrow to move “ADLPRE” to the Paired Variable(s) window (
“ADLPOST” and then click the arrow to move the variable to
the Paired Variable(s) window.
Click OK.
2. Researchers are interested in whether depressed people
undergoing group therapy will perform a different number of
activities of daily living before and after group therapy. The
researchers have randomly selected 8 depressed clients in a 6-
week group therapy program.
Use the five steps of hypothesis testing to determine whether
the observed differences in numbers of activities of daily living
(shown below) obtained before and after therapy are
statistically significant at the .05 level of. (Clearly indicate
each step).
As part of Step 5, indicate whether the researchers should
recommend group therapy for all depressed people based on
evaluation of the null hypothesis at both levels of significance
and calculate the measure of association.
CLIENT
BEFORE THERAPY
AFTER THERAPY
A
11
17
B
7
12
7. C
10
12
D
13
21
E
9
16
F
8
17
G
13
17
H
12
8
The t Test for Independent Samples (20 points)
Once you have entered the data, click on Analyze, then on
Compare Means, and then click on Independent-Samples T
Test…
A dialog box will appear, with your variables (student,
condition, score) on the left. Your options are (a) move one or
more variables into the “Test Variable(s)” box to select your
dependent variables(s) and (b) move one of your variables into
the “Grouping Variable” box to select the independent variables
(or identify the groups to be compared).
Make “?” the dependent variable by moving it to the “Test
Variable(s)” box. Then make “?” your independent variable by
moving it to the “Grouping Variable” box. Now, the “Define
Groups” button is functioning, click on Define Groups and
another dialog box appears. Here you must specify the two
values of the condition variable that represent the two groups
8. you are comparing. Click in the box next to Group 1 and type
the number 1, then click in the box next to Group 2 and type the
number 2. Now you can click Continue to return to the
“Independent-Samples T Test” dialog box, and click on OK to
run the analysis.
1. Six months after an industrial accident, a researcher has been
asked to compare the job satisfaction of employees who
participated in counseling sessions with the satisfaction of
employees who chose not to participate.
The scores on a job satisfaction inventory for both groups are
listed in the table below.
Use the five steps of hypothesis testing to determine whether
the job satisfaction scores of the group that participated in
counseling are statistically higher than the scores of employees
who did not participate in counseling at the .01 level of
significance.
As part of Step 5, indicate whether the researcher should
recommend counseling as a method to improve job satisfaction
following industrial accidents based on evaluation of the null
hypothesis and calculate the measure of association. NOTE: Do
not forget to give a numeric value for those who participated in
counseling (e.g. 0) and those who did not participate in
counseling (e.g. 1).
PARTICIPATED IN COUNSELING
DID NOT PARTICIPATE IN COUNSELING
36
38
39
36
41
36
9. 36
32
37
30
35
39
37
41
39
35
42
33
ANOVA (20 points)
Open SPSS
Analyze the data for #1. Remember that SPSS assumes that all
the scores in a row are from the same participant. In this study,
there are 15 participants divided into three groups of five.
Therefore, each of the 15 participants will be described by two
variables, type of therapy and the number of activities of daily
living performed.
If “1” represents the group receiving individual therapy for 1
hour every 2 weeks, “2” represents the group receiving 1 hour
of individual therapy each week, and “3” indicates the group
receiving 2 hours of individual therapy each week, the first
participant will be described by entering “1” in the top cell of
the first column in the Data View window and “16” in the top
cell of the second column to indicate that the participant
underwent 1 hour of therapy every 2 weeks and performed 16
activities of daily living. The second participant will be
described by “1” and “15”, and the third by “1” and “18”.
When the two variables have been entered for the five
participants in this group, repeat the process for participants
who underwent 1 hour of individual therapy each week, using
10. “2” to describe their therapy group. When the two variables for
the five participants in this group have been entered, repeat the
process for Group 3, entering “3” in the first column. In the
Variable View window, change the first variable name to
“THERAPY” and the second to “ADL” and set the decimals for
both to zero.
Click Analyze ( Compare Means ( One-Way ANOVA (Since
“THERAPY” is already selected, you can click the arrow to
move the variable to the Factor window. Select “ADL” and
click the arrow to move the variable to the Dependent List
window, which instruct SPSS to conduct the analysis of
variance on the number of activities performed.
Click “Options” and click the box labeled “Descriptive” to
obtain descriptive statistics.
Click Continue.
Click OK.
1. Keep in mind that the clients in Group 1 will receive 1 hour
of therapy every 2 weeks, the clients in Group 2 will receive 1
hour of therapy every week, and the clients in Group 3 will
receive 2 hours of therapy every week.
Use the five steps of hypothesis testing to determine whether
the observed differences in the number of activities in the
following table performed by the three groups are statistically
significant at the .05 level of significance. Clearly indicate each
of the five steps.
CLIENT
GROUP 1
GROUP 2
GROUP 3
1
11. 16
21
24
2
15
20
21
3
18
17
25
4
21
23
20
5
19
19
22
2. Describe the circumstances under which you should use
ANOVA instead of t tests, and explain why t tests are
inappropriate in these circumstances.
Chi-Square (20 points)
Chi-Square
SPSS instructions:
Chi-Square Test for Goodness of Fit:
Open SPSS
Remember that SPSS assumes that all the scores in a row are
from the same participant. In the study presented in #1, there
are 20 students, some of whom have been suspended for
misbehavior. The primary conflict-resolution style used by each
student is also entered. [Ignore the first variable in this
analysis.]
12. When you have entered the data for all 20 students, move to the
Variable View window and change the first variable name to
“SUSPEND” and the second to “STYLE”. Set the number of
decimals for both variables to zero.
Click Analyze ( Non-Parametric Tests ( Chi-Square
Click the variable “STYLE” and then the arrow next to the box
labeled “Test Variable List” to indicate that the chi-square for
goodness of fit should be conducted on the conflict-resolution
style variable.
Note that “All categories equal” is the default selection in the
“Expected Values” box, which means that SPSS will conduct
the goodness of fit test using equal expected frequencies for
each of the four styles, in other words, SPSS will assume that
the proportions of students each style are equal.
Click OK.
Chi-Square Test for Independence:
Open SPSS
For #2, you need to add the variable “SUSPEND” to the
analysis. Remember that in this problem, we are interested in
whether there was an association between conflict-resolution
style and having been suspended from school for misbehavior.
Since the analysis will involve two nominal variables, the
appropriate test is a chi-square test for independence.
Click Analyze ( Descriptive Statistics ( Crosstabs
Since “SUSPEND” is already selected, click the arrow next to
the box labeled “Rows.”
13. Click the variable “STYLE” and click the arrow next to the box
labeled “Columns.”
Click “Statistics” and click the box labeled “Chi-Square.”
Click Continue.
Click “Cells” and click the box labeled “Expected.”
Click Continue.
Click OK.
1. The following table includes the primary method of conflict
resolution used by 20 students.
Method
Aggressive
Manipulative
Passive
Assertive
N of Students
8
2
2
8
a. Following the five steps of hypothesis testing, conduct the
appropriate chi-square test to determine whether the observed
frequencies are significantly different from the frequencies
expected by change at the .05 level of significance. Clearly
identify each of the five steps.
2. Next, researchers categorized the students based on the
primary method of conflict resolution used and whether the
student had been suspended from school for misbehavior. These
data are presented below.
15. conflict resolution, the researchers categorized students so that
the aggressive, manipulative, and passive categories were
combined. These data are presented in the table below.
Conflict Resolution
Suspension from School
Assertive
Other
Total
Yes
1
9
10
No
6
4
10
Total
7
13
20
a. Following the five steps of hypothesis testing, conduct the
appropriate chi-square test to determine whether the observed
frequencies are significantly different from the frequencies
expected by change at the .05 level of significance. Clearly
identify each of the five steps.
b. Explain your results.
This assignment is due no later than Sunday of Week 6 by 11:55
pm ET.
Save the file in the following format: [your last
name_SOCI332_A2].