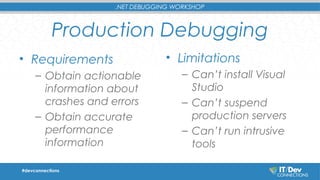
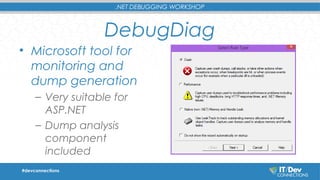
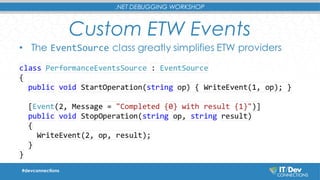
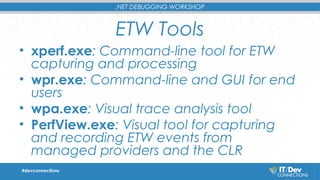
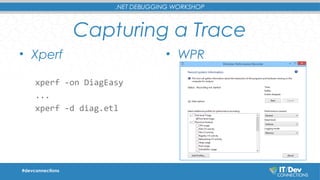
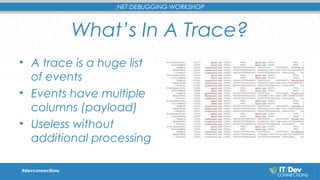
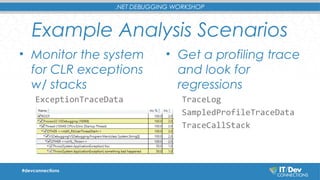
This document summarizes a workshop on .NET debugging techniques. The workshop covers debugging production issues, analyzing system and application performance, and automating debugging processes. It discusses tools like Procdump, DebugDiag, and Windows debugging tools. It also covers debugging techniques like generating dump files, using Event Tracing for Windows (ETW) to collect traces, and analyzing traces with tools like PerfView. The goal is to help integrate automatic error analysis and triage into development processes.
It's been three years since Netflix's Brendan Gregg described the Berkeley Packet Filter as "Superpowers for Linux". Since then there has been an explosion of capabilities and tools based on eBPF, so you've probably heard the term, but do you know what it is and how to use it? In this demo-rich talk we'll explore some of the powerful things we can do with this technology, especially in the context of containers.
How do you deal with issues that happen in production? Error and Event logs are helpful but often they provide little to no help with things like deadlocks and memory leaks.
In this session we'll explore some low level utilities that allow us to take snapshots of running code and bring it back in house for analysis.
In this talk, we look at WinDbg, a powerful debugger that can help resolve difficult errors in production environments. We use WinDbg to pinpoint stack traces given dump files generated in production, to find memory leak causes and inspect heap memory, and even to automatically walk objects and threads to find deadlocks.
XCon 2014 => http://xcon.xfocus.org/
In the past was quite common to exploit heap / pool manager vulnerabilities attacking its internal linked structures. However current memory management improve a lot and at current date it is quite ineffective to attack heap in this way. But still those techniques come into hand when we start to looking at linked structures widespread throughout kernel that are unfortunately not hardened enough.
In this presentation we will examine power of these vulnerabilities by famous example “CVE – 2013 - 3660”. Showing bypass on ‘lazy’ assertions of _LIST_ENTRY, present exploitation after party and teleport to kernel.
Visual studio is the one shop stop for most .NET developers; it’s a shame since there are other powerful tools out there.
WinDbg is such a tool – it can help analyze and solve bugs, memory issues, deadlocks and is crucial to solving bugs that are found on the client machines.
The problem is that WinDbg is not as friendly as Visual Studio (to say the least) – or is it?
In this talk I’ll show how a .NET developer can use WinDbg to crash bugs.
Devel::NYTProf v3 - 200908 (OUTDATED, see 201008)Tim Bunce
Slides of my talk on Devel::NYTProf and optimizing perl code at the Italian Perl Workshop (IPW09). It covers the new features in NYTProf v3 and a new section outlining a multi-phase approach to optimizing your perl code.
30 mins long plus 10 mins of questions. Best viewed fullscreen.
You didnt see it’s coming? "Dawn of hardened Windows Kernel" Peter Hlavaty
Past few years our team was focusing on different operating systems including Microsoft windows kernel. Honestly our first pwn at Windows kernel was not that challenging. Number of available targets with friendly environment for straightforward pwn, from user up to reliable kernel code execution.
However, step by step, security policies continue to evolve, and it becomes more troublesome to choose ideal attack surface from various sandboxes. In addition, what steps to follow for digging security holes is highly dependent upon the chosen target. In general, a few common strategies are available for researchers to choose: e.g choose “unknown” one which hasn’t been researched before; Select well fuzzed or well audited one, or research on kernel module internals to find “hidden” attack surfaces which are not explicitly interconnected. In the first part of the talk we introduce our methodology of selecting, alongside with cost of tricks around to choose seemingly banned targets, illustrated by notable examples.
After getting hands on potential bug available from targeted sandbox, it is time for Microsoft windows taking hardening efforts to put attacker into corner. Strong mitigations are being introduced more frequently than ever, with promising direction which cuts lots of attack surface off, and a several exploitation techniques being killed. We will show difficulties of developing universal exploitation techniques, and demonstrate needed technical level depending on code quality of target. We will examine how different it becomes with era of Redstone and following versions even with those techniques and good vulnerability in hand. How it changed attacker landscape and how it will (and will not) kill those techniques and applications. However will it really change the game or not?
In the past few years, the bar for exploitation was raised highly, and in the current state of software security it is harder and harder to make successful exploitation on newest operating systems.
But as some systems continue to evolve and introduce new mitigations, the others just freeze a few years behind. In our talk we will focus on rooting Android by two racing conditions vulnerabilities. We will show the differences between level of exploitation needed, and how some mobile vendors are killing offered security features.
This talk will cover how powerfull are buffer overflows, how weak are mitigations against them, why are buffer overflows still possible in those days, how generic are they, and example how useful is turn race conditions to buffer overflow. Race conditions are nice example for that, because they are one of the hardest to find and on of the easiest to make. example is on Linux kernel (droids included), but talk will be keeped for buffer overflows in general (mainly for windows & Linux kernel)
USENIX ATC 2017: Visualizing Performance with Flame GraphsBrendan Gregg
Talk by Brendan Gregg for USENIX ATC 2017.
"Flame graphs are a simple stack trace visualization that helps answer an everyday problem: how is software consuming resources, especially CPUs, and how did this change since the last software version? Flame graphs have been adopted by many languages, products, and companies, including Netflix, and have become a standard tool for performance analysis. They were published in "The Flame Graph" article in the June 2016 issue of Communications of the ACM, by their creator, Brendan Gregg.
This talk describes the background for this work, and the challenges encountered when profiling stack traces and resolving symbols for different languages, including for just-in-time compiler runtimes. Instructions will be included generating mixed-mode flame graphs on Linux, and examples from our use at Netflix with Java. Advanced flame graph types will be described, including differential, off-CPU, chain graphs, memory, and TCP events. Finally, future work and unsolved problems in this area will be discussed."
In order to prevent exploiting mistakes, introduced in developing process, are continuously implemented various security mitigations & hardening on application level and in operating system level as well.
Even when those mitigations highly increase difficulty of exploitation of common bugs in software / core, you should not rely solely on them. And it can help to know background and limits of those techniques, which protect your software directly or indirectly.
In this talk we will take a look at some of helpful mitigations & features introduces past years (x64 address space, SMAP & SMEP, CFG, ...) focusing from kernel point of view. Its benefits, and weak points same time.
In current era of exploitation it is coming more complex to develop even PoC for vulnerability, especially when it comes to more complicated one, like race conditions, sandbox escapes ...
And it seems that nowdays is still quite common write concept of exploitability for vendors, or even final code, in prehistoric way, and even using shellcoding.
We will show how vulnerability "design patterns" transform writing code, from current widespread form of magic black box, to developing software which breaks another one. We believe that developing is the way to go for boosting vulnerability research, for sake of security and your own time.
In order to harden kernel exploitation as much as possible was introduced variety of features including KASLR, SMEP and sometimes also SMAP.
Even those are powerful techniques their effectiveness rely on their cooperation, environment and their implementation.
We will present new and some not so new exploitation techniques, show ideas behind breaking trough before mentioned security features and why it is possible, and we will take a look at pool spraying on x64 as well.
Windows Kernel Exploitation : This Time Font hunt you down in 4 bytesPeter Hlavaty
In our recent work we targeted also win32k, what seems to be fruit giving target. @promised_lu made our own TTF-fuzzer which comes with bunch of results in form of gigabytes of crashes and various bugs. Fortunately windows make great work and in February most of our bugs was dead - patched, but not all of them…
Whats left were looking as seemingly unexploitable kernel bugs with ridiculous conditions. We decided to check it out, and finally combine it with our user mode bug & emet bypass. Through IE & flash we break down system and pointed out at weak points in defensive mechanism.
In this talk we will present our research dedicated for pwn2own event this year. We will describe kernel part of exploit in detail*, including bug description, resulting memory corruption conditions & caveats up to final pwn via one of our TTF bugs.
Throughout the talk we will describe how to break various exploit mitigations in windows kernel and why it is possible. We will introduce novel kernel exploitation techniques breaking all what stands { KASLR, SMEP, even imaginary SMAP or CFG } and bring you SYSTEM exec (from kernel driver to system calc).
* unfortunately bug was not fixed at the time of talk, so we do not exposed details about TTF vulnerability, and we skipped directly to some challenges during exploitation, and demonstrate how OS design can overpower introduced exploit mitigations.
Security research over Windows #defcon chinaPeter Hlavaty
Past several years Microsoft Windows undergo lot of fundamental security changes. Where one can argue still imperfect and bound to tons of legacy issues, on the other hand those changes made important shifts in attacker perspective. From tightened sandboxing, restricting attack surface, introducing mitigations, applying virtualization up to stronger focus even on win32k. In our talk we will go trough those changes, how it affects us and how we tackle them from choosing targets, finding bugs up to exploitation primitives we are using. While also empathize that windows research is not only about sandbox, and there are many more interesting target to look for.
Rainbow Over the Windows: More Colors Than You Could ExpectPeter Hlavaty
As time goes on operating systems keep evolving, like Microsoft Windows do, it ships new designs, features and codes from time to time. However sometimes it also ships more than bit of codes for complex subsystems residing in its kernel ... and at some future point it starts implementing new designs to prevent unnecessary access to it. However is it safe enough?
As we can see from security bulletins, win32k subsystem attracts lots of attention. It looks that with efforts of many security researchers who has dug into this area, finding bugs here shall becomes pretty tough and almost fruitless. But unfortunately this is not true, as win32k is backed up by very complex logic and large amount of code by nature..
We will present our point of view to Windows graphic subsystem, as well as schema of our fuzzing strategies. We will introduce some unusual areas of win32k, its extensions and how it can breaks even locked environments.
Part of our talk will be dedicated to CVE-2016-0176, the bug we used for this year's Pwn2Own Edge sandbox bypass, from its discovery to its exploitation techniques, which could serves as an example for universal DirectX escape which is independent of graphics vendors.
As computer systems become more sophisticated, process injection techniques also evolve. These techniques are notorious for their use by "malicious software" to hide code execution and avoid detection. In this presentation we dive deep into the Windows runtime and we demonstrate these techniques. Besides, we also learn how to code construction and design patterns that relate to perform hidden code can recognize.
As @nicowaisman mentioned in his talk Aleatory Persistent Threat, old school heap specific exploiting is dying. And with each windows SP or new version, is harder to attack heap itself. Heap management adapt quickly and include new mittigation techniques. But sometimes is better to rethink the idea of mittigation and do this technique properly even half version of it will cover all known heap exploit techniques…
At the event was discussed what the developer can use to repair an application or a game if it has graphic display problems. Also, speakers gave an overview of the Mesa library and its development process.
This presentation by Vadym Shovkoplias and Andrew Khulap (Senior Software Engineers, Consultants, GlobalLogic), was delivered at GlobalLogic Kharkiv Embedded TechTalk #2 on June 4, 2018.
Video: https://youtu.be/pT1Y81KGHkM
Slides for a college course at City College San Francisco. Based on "Practical Malware Analysis: The Hands-On Guide to Dissecting Malicious Software", by Michael Sikorski and Andrew Honig; ISBN-10: 1593272901.
Instructor: Sam Bowne
Class website: https://samsclass.info/126/126_S17.shtml
In the report were described approaches to testing Linux inside/outside and presented testing tools employed on the company projects. Also, it was showed how Linux can be deployed and tested automatically with the help of a continuous integration service.
This presentation by Dmytro Tokarskyy (Lead Test Engineer, Consultant, GlobalLogic), was delivered at GlobalLogic Kharkiv Embedded TechTalk #2 on June 4, 2018.
Video: https://youtu.be/oKc0WTpip40
Hot to build continuously processing for 24/7 real-time data streaming platform?GetInData
You can read our blog post about it here: https://getindata.com/blog/how-to-build-continuously-processing-for-24-7-real-time-data-streaming-platform/
Hot to build continuously processing for 24/7 real-time data streaming platform?
Atlanta Jenkins Area Meetup October 22nd 2015Kurt Madel
Jenkins Workflow is a game changing way to write automation jobs with Jenkins. Workflows can support simple, one-step hello-world type jobs to the most complex, parallel pipelines. Best of all, they support manual/automated intervention (eg: approvals) and also workflows survive Jenkins master restarts. Combining Jenkins Workflow with Docker can seriously reduce friction in your DevOps efforts. Come learn how.
Using Jenkins in nower days you have to learn all about using Pipelines. This presentation shows how to user Jenkins Pipelines inside Oracle Projects.
The Presentation was held on the DOAG Conference 2019 in nuremberg.
J1 2015 "Debugging Java Apps in Containers: No Heavy Welding Gear Required"Daniel Bryant
It’s easy to get seduced by being able to quickly deploy and scale applications by using containers. However, when things inevitably go wrong, how do you debug your application? This session covers various pro bug hunting tips and tricks. It shows live demos of tools such as the Docker stats API, Docker exec (and top, vmstat, and netstat), and how to use the ELK stack for centralized logging. It also dives into other more sophisticated tools that operate at the application and (micro)service layer, such as Twitter’s Zipkin tracing app, Spring Boot’s Actuator, and DropWizard’s Metrics library. Keep those container-based nightmares away by ensuring that when the worst does happen, you have the tools, info, and experience to debug containerized applications.
Presented at JavaOne 2015 with Steve Poole
When Node.js Goes Wrong: Debugging Node in Production
The event-oriented approach underlying Node.js enables significant concurrency using a deceptively simple programming model, which has been an important factor in Node's growing popularity for building large scale web services. But what happens when these programs go sideways? Even in the best cases, when such issues are fatal, developers have historically been left with just a stack trace. Subtler issues, including latency spikes (which are just as bad as correctness bugs in the real-time domain where Node is especially popular) and other buggy behavior often leave even fewer clues to aid understanding. In this talk, we will discuss the issues we encountered in debugging Node.js in production, focusing upon the seemingly intractable challenge of extracting runtime state from the black hole that is a modern JIT'd VM.
We will describe the tools we've developed for examining this state, which operate on running programs (via DTrace), as well as VM core dumps (via a postmortem debugger). Finally, we will describe several nasty bugs we encountered in our own production environment: we were unable to understand these using existing tools, but we successfully root-caused them using these new found abilities to introspect the JavaScript VM.
Exploring Java Heap Dumps (Oracle Code One 2018)Ryan Cuprak
Memory leaks are not always simple or easy to find. Heap dumps from production systems are often gigantic (4+ gigs) with millions of objects in memory. Simple spot checking with traditional tools is woefully inadequate in these situations, especially with real data. Leaks can be entire object graphs with enormous amounts of noise. This session will show you how to build custom tools using the Apache NetBeans Profiler/Heapwalker APIs. Using these APIs, you can read and analyze Java heaps programmatically to ask really hard questions. This gives you the power to analyze complex object graphs with tens of thousands of objects in seconds.
SenchaCon 2016: Develop, Test & Deploy with Docker - Jonas Schwabe Sencha
Have you ever heard the phrase: "Everything works fine on my machine?" Docker is here to rescue you. Running your toolchain, Ext JS application, back-end server, and even your database - all in a standardized container format that can be transported and reused, throughout your process. In this session, you will learn how to automate a typical workflow, including developing, testing, and deploying, by using Docker containers and common continuous integration solutions.
Performance Benchmarking: Tips, Tricks, and Lessons LearnedTim Callaghan
Presentation covering 25 years worth of lessons learned while performance benchmarking applications and databases. Presented at Percona Live London in November 2014.
En esta presentación se muestran un conjunto de librerías y frameworks en Python para poder realizar pruebas tanto funcionales com ono funcionales, a diferentes niveles (unitario, aceptación y e2)
Have you ever cried yourself to sleep unable to find the cause of a horrendous bug in your node app? Cry no more, your tears will be reshaped into blinding swords as we explore uncharted territories laced with mystical creatures.
JavaScript debugging is an often avoided topic due to the uncertainty of how best to accomplish it and the lack of powerful introspective tools. This talk will explore new territory and showcase tools that help you debug complex and difficult issues in your node or frontend app. Libraries and tools such as node-inspector, Time-Travel Debugging, Visual Studio Code, vorlon.js, Vantage and memory leak catchers will be used to slay dragons.
No more shall you fear building complex apps with JavaScript!
Here Be Dragons – Advanced JavaScript DebuggingFITC
Presented at Web Unleashed on September 16-17, 2015 in Toronto, Canada
More info at www.fitc.ca/webu
Here Be Dragons – Advanced JavaScript Debugging
with Rami Sayar
Have you ever cried yourself to sleep unable to find the cause of a horrendous bug in your node app? Cry no more, your tears will be reshaped into blinding swords as we explore uncharted territories laced with mystical creatures.
JavaScript debugging is an often avoided topic due to the uncertainty of how best to accomplish it and the lack of powerful introspective tools. This talk will explore new territory and showcase tools that help you debug complex and difficult issues in your node or frontend app. Libraries and tools such as node-debugger, Visual Studio Code, vorlon.js, and memory leak catchers will be used to slay dragons.
No more shall you fear building complex apps with JavaScript!
OBJECTIVE
Slaying dragons hiding in your JavaScript apps a.k.a. Advanced JavaScript Debugging
TARGET AUDIENCE
JavaScript Developers.
ASSUMED AUDIENCE KNOWLEDGE
JavaScript.
FIVE THINGS AUDIENCE MEMBERS WILL LEARN
Common causes of bugs in JavaScript
How to hunt for bugs using node-debugger
How to use introspective tools
How to debug your front-end with vorlon.js
Slaying dragons
O'Reilly Velocity New York 2016 presentation on modern Linux tracing tools and technology. Highlights the available tracing data sources on Linux (ftrace, perf_events, BPF) and demonstrates some tools that can be used to obtain traces, including DebugFS, the perf front-end, and most importantly, the BCC/BPF tool collection.
Imagine you're tackling one of these evasive performance issues in the field, and your go-to monitoring checklist doesn't seem to cut it. There are plenty of suspects, but they are moving around rapidly and you need more logs, more data, more in-depth information to make a diagnosis. Maybe you've heard about DTrace, or even used it, and are yearning for a similar toolkit, which can plug dynamic tracing into a system that wasn't prepared or instrumented in any way.
Hopefully, you won't have to yearn for a lot longer. eBPF (extended Berkeley Packet Filters) is a kernel technology that enables a plethora of diagnostic scenarios by introducing dynamic, safe, low-overhead, efficient programs that run in the context of your live kernel. Sure, BPF programs can attach to sockets; but more interestingly, they can attach to kprobes and uprobes, static kernel tracepoints, and even user-mode static probes. And modern BPF programs have access to a wide set of instructions and data structures, which means you can collect valuable information and analyze it on-the-fly, without spilling it to huge files and reading them from user space.
In this talk, we will introduce BCC, the BPF Compiler Collection, which is an open set of tools and libraries for dynamic tracing on Linux. Some tools are easy and ready to use, such as execsnoop, fileslower, and memleak. Other tools such as trace and argdist require more sophistication and can be used as a Swiss Army knife for a variety of scenarios. We will spend most of the time demonstrating the power of modern dynamic tracing -- from memory leaks to static probes in Ruby, Node, and Java programs, from slow file I/O to monitoring network traffic. Finally, we will discuss building our own tools using the Python and Lua bindings to BCC, and its LLVM backend.
eBPF (extended Berkeley Packet Filters) is a modern kernel technology that can be used to introduce dynamic tracing into a system that wasn't prepared or instrumented in any way. The tracing programs run in the kernel, are guaranteed to never crash or hang your system, and can probe every module and function -- from the kernel to user-space frameworks such as Node and Ruby.
In this workshop, you will experiment with Linux dynamic tracing first-hand. First, you will explore BCC, the BPF Compiler Collection, which is a set of tools and libraries for dynamic tracing. Many of your tracing needs will be answered by BCC, and you will experiment with memory leak analysis, generic function tracing, kernel tracepoints, static tracepoints in user-space programs, and the "baked" tools for file I/O, network, and CPU analysis. You'll be able to choose between working on a set of hands-on labs prepared by the instructors, or trying the tools out on your own test system.
Next, you will hack on some of the bleeding edge tools in the BCC toolkit, and build a couple of simple tools of your own. You'll be able to pick from a curated list of GitHub issues for the BCC project, a set of hands-on labs with known "school solutions", and an open-ended list of problems that need tools for effective analysis. At the end of this workshop, you will be equipped with a toolbox for diagnosing issues in the field, as well as a framework for building your own tools when the generic ones do not suffice.
Swift: Apple's New Programming Language for iOS and OS XSasha Goldshtein
Presentation from Software Architect 2014, covering Swift -- Apple's new programming language for iOS and OS X. The presentation focuses on Swift's language features, which make it so different from mainstream programming languages. Towards the end of the live talk, we also built an iOS app using Swift.
C# Everywhere: Cross-Platform Mobile Apps with XamarinSasha Goldshtein
Presentation from Software Architect 2014, covering Xamarin's offering for building cross-platform mobile applications in C# while using the native platform APIs. The live talk also covered Xamarin.Forms.
Presentation from Software Architect 2014, covering modern cloud backends for mobile apps with a focus on Microsoft Azure Mobile Services and Facebook Parse.
Delivering Millions of Push Notifications in MinutesSasha Goldshtein
Presentation from TechDays Netherlands 2014 on using Azure Notification Hubs to deliver millions of push notifications - through a Mobile Services backend or through an arbitrary backend including Node.js or .NET console apps.
Building Mobile Apps with a Mobile Services .NET BackendSasha Goldshtein
Presentation from TechDays Netherlands 2014 on using the newly announced .NET backend for Azure Mobile Services to build mobile applications, and on using the Offline Sync preview in Windows Store apps.
Presentation from DevWeek 2014 on task and data parallelism. This session explains the TPL APIs and then covers various scenarios for extracting concurrency, reducing synchronization, putting thresholds on parallelization, and other topics.
O'Reilly Fluent 2014 talk on attacking web applications. Showing practical demos of attacking web assets, including XSS, CSRF, insecure cookie placement, traffic manipulation, and other tactics.
Presentation from ConFoo 2014 on Windows Azure Mobile Services. Introducing the platform, building out an application that uses data storage, server-side scripts, custom API endpoints, push notifications, and client authentication. Source code is available on GitHub at http://github.com/goldshtn/rentahome
Presentation from ConFoo 2014 on Android development. Introducing the Android platform, discussing the major components in the ecosystem, and building a basic todo list manager app with Eclipse.
Presentation at ConFoo 2014 on iOS Development. Discussing the basic components of the iOS ecosystem and building a basic todo list manager app with Xcode and storyboards.
JavaScript, Meet Cloud: Node.js on Windows AzureSasha Goldshtein
Slides from a talk at the North Toronto .NET User Group. An introduction to Node.js and Express followed by a tour of Windows Azure and various hosting options for Node applications, including Windows Azure Web Sites, Windows Azure Mobile Services, and Windows Azure Virtual Machines.
Connector Corner: Automate dynamic content and events by pushing a buttonDianaGray10
Here is something new! In our next Connector Corner webinar, we will demonstrate how you can use a single workflow to:
Create a campaign using Mailchimp with merge tags/fields
Send an interactive Slack channel message (using buttons)
Have the message received by managers and peers along with a test email for review
But there’s more:
In a second workflow supporting the same use case, you’ll see:
Your campaign sent to target colleagues for approval
If the “Approve” button is clicked, a Jira/Zendesk ticket is created for the marketing design team
But—if the “Reject” button is pushed, colleagues will be alerted via Slack message
Join us to learn more about this new, human-in-the-loop capability, brought to you by Integration Service connectors.
And...
Speakers:
Akshay Agnihotri, Product Manager
Charlie Greenberg, Host
Accelerate your Kubernetes clusters with Varnish CachingThijs Feryn
A presentation about the usage and availability of Varnish on Kubernetes. This talk explores the capabilities of Varnish caching and shows how to use the Varnish Helm chart to deploy it to Kubernetes.
This presentation was delivered at K8SUG Singapore. See https://feryn.eu/presentations/accelerate-your-kubernetes-clusters-with-varnish-caching-k8sug-singapore-28-2024 for more details.
UiPath Test Automation using UiPath Test Suite series, part 3DianaGray10
Welcome to UiPath Test Automation using UiPath Test Suite series part 3. In this session, we will cover desktop automation along with UI automation.
Topics covered:
UI automation Introduction,
UI automation Sample
Desktop automation flow
Pradeep Chinnala, Senior Consultant Automation Developer @WonderBotz and UiPath MVP
Deepak Rai, Automation Practice Lead, Boundaryless Group and UiPath MVP
Securing your Kubernetes cluster_ a step-by-step guide to success !KatiaHIMEUR1
Today, after several years of existence, an extremely active community and an ultra-dynamic ecosystem, Kubernetes has established itself as the de facto standard in container orchestration. Thanks to a wide range of managed services, it has never been so easy to set up a ready-to-use Kubernetes cluster.
However, this ease of use means that the subject of security in Kubernetes is often left for later, or even neglected. This exposes companies to significant risks.
In this talk, I'll show you step-by-step how to secure your Kubernetes cluster for greater peace of mind and reliability.
Essentials of Automations: Optimizing FME Workflows with ParametersSafe Software
Are you looking to streamline your workflows and boost your projects’ efficiency? Do you find yourself searching for ways to add flexibility and control over your FME workflows? If so, you’re in the right place.
Join us for an insightful dive into the world of FME parameters, a critical element in optimizing workflow efficiency. This webinar marks the beginning of our three-part “Essentials of Automation” series. This first webinar is designed to equip you with the knowledge and skills to utilize parameters effectively: enhancing the flexibility, maintainability, and user control of your FME projects.
Here’s what you’ll gain:
- Essentials of FME Parameters: Understand the pivotal role of parameters, including Reader/Writer, Transformer, User, and FME Flow categories. Discover how they are the key to unlocking automation and optimization within your workflows.
- Practical Applications in FME Form: Delve into key user parameter types including choice, connections, and file URLs. Allow users to control how a workflow runs, making your workflows more reusable. Learn to import values and deliver the best user experience for your workflows while enhancing accuracy.
- Optimization Strategies in FME Flow: Explore the creation and strategic deployment of parameters in FME Flow, including the use of deployment and geometry parameters, to maximize workflow efficiency.
- Pro Tips for Success: Gain insights on parameterizing connections and leveraging new features like Conditional Visibility for clarity and simplicity.
We’ll wrap up with a glimpse into future webinars, followed by a Q&A session to address your specific questions surrounding this topic.
Don’t miss this opportunity to elevate your FME expertise and drive your projects to new heights of efficiency.
The Art of the Pitch: WordPress Relationships and SalesLaura Byrne
Clients don’t know what they don’t know. What web solutions are right for them? How does WordPress come into the picture? How do you make sure you understand scope and timeline? What do you do if sometime changes?
All these questions and more will be explored as we talk about matching clients’ needs with what your agency offers without pulling teeth or pulling your hair out. Practical tips, and strategies for successful relationship building that leads to closing the deal.
Slack (or Teams) Automation for Bonterra Impact Management (fka Social Soluti...Jeffrey Haguewood
Sidekick Solutions uses Bonterra Impact Management (fka Social Solutions Apricot) and automation solutions to integrate data for business workflows.
We believe integration and automation are essential to user experience and the promise of efficient work through technology. Automation is the critical ingredient to realizing that full vision. We develop integration products and services for Bonterra Case Management software to support the deployment of automations for a variety of use cases.
This video focuses on the notifications, alerts, and approval requests using Slack for Bonterra Impact Management. The solutions covered in this webinar can also be deployed for Microsoft Teams.
Interested in deploying notification automations for Bonterra Impact Management? Contact us at sales@sidekicksolutionsllc.com to discuss next steps.
Neuro-symbolic is not enough, we need neuro-*semantic*Frank van Harmelen
Neuro-symbolic (NeSy) AI is on the rise. However, simply machine learning on just any symbolic structure is not sufficient to really harvest the gains of NeSy. These will only be gained when the symbolic structures have an actual semantics. I give an operational definition of semantics as “predictable inference”.
All of this illustrated with link prediction over knowledge graphs, but the argument is general.
UiPath Test Automation using UiPath Test Suite series, part 4DianaGray10
Welcome to UiPath Test Automation using UiPath Test Suite series part 4. In this session, we will cover Test Manager overview along with SAP heatmap.
The UiPath Test Manager overview with SAP heatmap webinar offers a concise yet comprehensive exploration of the role of a Test Manager within SAP environments, coupled with the utilization of heatmaps for effective testing strategies.
Participants will gain insights into the responsibilities, challenges, and best practices associated with test management in SAP projects. Additionally, the webinar delves into the significance of heatmaps as a visual aid for identifying testing priorities, areas of risk, and resource allocation within SAP landscapes. Through this session, attendees can expect to enhance their understanding of test management principles while learning practical approaches to optimize testing processes in SAP environments using heatmap visualization techniques
What will you get from this session?
1. Insights into SAP testing best practices
2. Heatmap utilization for testing
3. Optimization of testing processes
4. Demo
Topics covered:
Execution from the test manager
Orchestrator execution result
Defect reporting
SAP heatmap example with demo
Speaker:
Deepak Rai, Automation Practice Lead, Boundaryless Group and UiPath MVP
Dev Dives: Train smarter, not harder – active learning and UiPath LLMs for do...UiPathCommunity
💥 Speed, accuracy, and scaling – discover the superpowers of GenAI in action with UiPath Document Understanding and Communications Mining™:
See how to accelerate model training and optimize model performance with active learning
Learn about the latest enhancements to out-of-the-box document processing – with little to no training required
Get an exclusive demo of the new family of UiPath LLMs – GenAI models specialized for processing different types of documents and messages
This is a hands-on session specifically designed for automation developers and AI enthusiasts seeking to enhance their knowledge in leveraging the latest intelligent document processing capabilities offered by UiPath.
Speakers:
👨🏫 Andras Palfi, Senior Product Manager, UiPath
👩🏫 Lenka Dulovicova, Product Program Manager, UiPath
Smart TV Buyer Insights Survey 2024 by 91mobiles.pdf91mobiles
91mobiles recently conducted a Smart TV Buyer Insights Survey in which we asked over 3,000 respondents about the TV they own, aspects they look at on a new TV, and their TV buying preferences.
Generating a custom Ruby SDK for your web service or Rails API using Smithyg2nightmarescribd
Have you ever wanted a Ruby client API to communicate with your web service? Smithy is a protocol-agnostic language for defining services and SDKs. Smithy Ruby is an implementation of Smithy that generates a Ruby SDK using a Smithy model. In this talk, we will explore Smithy and Smithy Ruby to learn how to generate custom feature-rich SDKs that can communicate with any web service, such as a Rails JSON API.
2. SESSION TITLE
#devconnections
Sasha Goldshtein
CTO, Sela Group
Microsoft C# MVP, Azure MRS
@goldshtn blog.sashag.net
#devconnections
3. .NET DEBUGGING WORKSHOP
In This Workshop…
• Debugging issues in production
environments
• Automating triage and analysis
processes
• Analyzing system and application
performance
#devconnections
4. .NET DEBUGGING WORKSHOP
Production Debugging
• Requirements
– Obtain actionable
information about
crashes and errors
– Obtain accurate
performance
information
• Limitations
– Can’t install Visual
Studio
– Can’t suspend
production servers
– Can’t run intrusive
tools
#devconnections
5. .NET DEBUGGING WORKSHOP
In the DevOps Process…
• Automatic build (CI)
• Automatic deployment (CD)
• Automatic monitoring
• Automatic error triage and analysis
• Automatic remediation
#devconnections
6. .NET DEBUGGING WORKSHOP
The Tools
• Sysinternals Procdump
• DebugDiag
• Windows SDK
– Debugging Tools for Windows
– Windows Performance Toolkit
• PerfView
#devconnections
8. .NET DEBUGGING WORKSHOP
Dump Files
• A user dump is a snapshot of a running
process
• A kernel dump is a snapshot of the entire
system
• Dump files are useful for post-mortem
diagnostics and for production debugging
– Anytime you can’t attach and start live
debugging, a dump might help
#devconnections
9. .NET DEBUGGING WORKSHOP
Limitations of Dump Files
• A dump file is a static snapshot
– You can’t debug a dump, just analyze it
– Sometimes a repro is required (or more
than one repro)
• Sometimes several dumps must be
compared
#devconnections
10. .NET DEBUGGING WORKSHOP
Taxonomy of Dumps
• Crash dumps are dumps generated
when an application crashes
• Hang dumps are dumps generated
on-demand at a specific moment
• These are just names; the contents of
the dump files are the same!
#devconnections
11. .NET DEBUGGING WORKSHOP
Generating a Hang Dump
• Task Manager, right-click
and choose
“Create Dump File”
– Creates a dump in
%LOCALAPPDATA
%Temp
#devconnections
13. .NET DEBUGGING WORKSHOP
Windows Error Reporting
• WER can create dumps automatically
– HKLMSoftwareMicrosoftWindows
Windows Error ReportingLocalDumps
– http://tinyurl.com/localdumps
• Can be application-specific, not
system-wide
#devconnections
14. .NET DEBUGGING WORKSHOP
DebugDiag
• Microsoft tool for
monitoring and
dump generation
– Very suitable for
ASP.NET
– Dump analysis
component
included
#devconnections
15. .NET DEBUGGING WORKSHOP
Debugging Symbols
• Debugging symbols link runtime
memory addresses to function names,
source file names and line numbers
– PDB files
– Required for proper debugging and
dump analysis
#devconnections
16. .NET DEBUGGING WORKSHOP
Symbols for Microsoft Binaries
• Microsoft has a public symbol server
with PDB files for Microsoft binaries
• Configure _NT_SYMBOL_PATH
environment variable
setx _NT_SYMBOL_PATH
srv*C:symbols*http://msdl.microsoft.com/download/symbols
#devconnections
17. .NET DEBUGGING WORKSHOP
Opening Dump Files
• Visual Studio can
open dump files
– For .NET, CLR 4.0+
and VS2010+
required
– VS2013
recommended
#devconnections
18. .NET DEBUGGING WORKSHOP
Opening Dump Files
• WinDbg is a free
lightweight
debugger
• No intrinsic .NET
support, but has
SOS debugging
extension
!analyze -v (CLR 4.0+)
.loadby sos clr
!printexception
!clrstack
#devconnections
19. .NET DEBUGGING WORKSHOP
Configuring LocalDumps
Obtaining and opening a dump file
TRY IT OUT
#devconnections
21. .NET DEBUGGING WORKSHOP
Basic Automation
• Run WinDbg automatically on a bunch
of files and log its output:
@echo off
for %%f in (.*.dmp) do (
echo Launching analysis of file %%f...
start "Analyzing %%f" "C:Program Files (x86)Windows
Kits8.1Debuggersx86cdb.exe" -z %%f -c ".logopen %%f.log;
!analyze -v; .logclose; qd"
)
#devconnections
22. .NET DEBUGGING WORKSHOP
Basic Automation
• Parse the results for interesting tokens:
for %%f in (.*.dmp.log) do (
echo In file %%f:
findstr "EXCEPTION_MESSAGE MANAGED_OBJECT_NAME" %%f
)
#devconnections
23. .NET DEBUGGING WORKSHOP
ClrMD
• Text-based analysis of debugger
command output is very fragile and
limited
• ClrMD is a .NET library for analyzing dump
files (and running processes)
– A managed API for interacting with the .NET
debugging runtime (“SOS API”)
– Distributed through NuGet (search “ClrMD”)
#devconnections
25. .NET DEBUGGING WORKSHOP
mscordacwks.dll
• Managed dump analysis requires
mscordacwks.dll matching the CLR
version
• It can be automatically downloaded
from the Microsoft symbol server in
most cases
#devconnections
29. .NET DEBUGGING WORKSHOP
Inspecting the Heap
• Enumerate all heap
objects and statistics
• Find specific objects
• Inspect GC
information (roots,
finalization queues,
etc.)
#devconnections
ClrHeap
EnumerateObjects
GetObjectType
EnumerateRoots
ClrType
GetSize
EnumerateRefsOfObject
GetFieldValue
30. .NET DEBUGGING WORKSHOP
Wait Information
• Threads have a list
of blocking objects,
which have owner
threads
• Wait analysis and
deadlock detection
is made possible
ClrThread
BlockingObjects
BlockingObject
Reason
Object
HasSingleOwner
Owner/Owners
Waiters
#devconnections
32. .NET DEBUGGING WORKSHOP
Event Tracing for Windows
• High-performance facility for emitting
100K+ log events per second with rich
payloads and stack trace support
• Used widely across Windows, .NET,
drivers, services, third party
components
#devconnections
33. .NET DEBUGGING WORKSHOP
ETW Participants
• A provider generates ETW events
• A controller starts and stops ETW
collection
• A consumer logs, analyzes, or
processes ETW events
#devconnections
34. .NET DEBUGGING WORKSHOP
ETW Scenarios
• Profile an app in sampling mode
• Perform wait-time analysis
• Log disk accesses including stacks
• Log GC and JIT events
• Log memory allocation statistics (C++)
• Custom application event log
#devconnections
36. .NET DEBUGGING WORKSHOP
ETW Tools
• xperf.exe: Command-line tool for ETW
capturing and processing
• wpr.exe: Command-line and GUI for end
users
• wpa.exe: Visual trace analysis tool
• PerfView.exe: Visual tool for capturing
and recording ETW events from
managed providers and the CLR
#devconnections
38. .NET DEBUGGING WORKSHOP
What’s In A Trace?
• A trace is a huge list
of events
• Events have multiple
columns (payload)
• Useless without
additional processing
#devconnections
39. .NET DEBUGGING WORKSHOP
Trace Processing with Xperf
• I/O summary report
per file
xperf -i fileio.etl
-o fileio.csv -a diskio
-summary
• Interactive profiling
report (for a specific
process)
xperf -i cpu.etl
-o cpu.html -symbols
-a stacks -process
app.exe -butterfly
#devconnections
40. .NET DEBUGGING WORKSHOP
Managed Stacks
• To display managed stack traces
correctly, additional CLR data is required
• WPR & PerfView take care of this
automatically
• If using Xperf, see:
http://
msdn.microsoft.com/en-us/library/windows/desktop/#devconnections
42. .NET DEBUGGING WORKSHOP
Trace Analysis with WPA
List of
graphs
List of
graphs
#devconnections
Graph
display
Graph
display
Ungrouped
Ungrouped
columns
Grouped columns
columns
Grouped
columns Grouping
Grouping
bar
bar
43. .NET DEBUGGING WORKSHOP
Stack Summaries
• Learn how to read
stack summaries
– Group by Stack
column
– Expand “hot path”,
like in profiler
• Stack resolution
requires symbols
(slow)
#devconnections
44. .NET DEBUGGING WORKSHOP
PerfView
• ETW collection and analysis tool tailored
for .NET applications (but not only)
• Can be used as a sampling profiler
• Can be used as an allocation profiler
• Can be used for heap snapshot analysis
#devconnections
45. .NET DEBUGGING WORKSHOP
Collecting Data w/ PerfView
• CLI
PerfView run app.exe
• GUI
#devconnections
46. .NET DEBUGGING WORKSHOP
PerfView Collection Options
Profiling wall-clock
time
time
CPU sampling
profiling
#devconnections
File/registry
accesses
File/registry
accesses
Allocation
profiling
Allocation
profiling
CPU sampling
profiling
48. .NET DEBUGGING WORKSHOP
Memory Leak Analysis
• PerfView can
generate heap
snapshots (smaller
than a dump),
analyze, and
compare them
• Can also import
dumps directly
#devconnections
50. .NET DEBUGGING WORKSHOP
Automatic ETW Analysis
• The TraceEvent
library provides an
API for ETW analysis
– Understands kernel
and CLR events
– Supports call stacks
(incl. managed)
#devconnections
51. .NET DEBUGGING WORKSHOP
Example Analysis Scenarios
• Monitor the system
for CLR exceptions
w/ stacks
ExceptionTraceData
• Get a profiling trace
and look for
regressions
TraceLog
SampledProfileTraceData
TraceCallStack
#devconnections
52. .NET DEBUGGING WORKSHOP
Summary
• Production debugging and
performance investigation is here, and
entirely possible thanks to dumps and
ETW traces
• Integrate automatic error analysis and
triage into your devops process
#devconnections
53. SESSION TITLE
Rate This Session Now!
#devconnections
Rate with Mobile App:
1. Select the session from the
Agenda or Speakers menus
2. Select the Actions tab
3. Click Rate Session
Rate Using Our Website:
1. Register at www.devconnections.com/logintoratesession
2. Go to www.devconnections.com/ratesession
3. Select this session from the list and rate it
Tell Us
What
You
Thought
of This
Session
Be Entered to WIN Prizes!