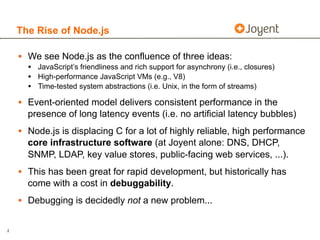
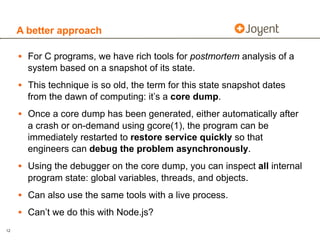
David Pacheco discusses the challenges of debugging Node.js applications in production, highlighting the power of Node.js alongside its debugging difficulties. He introduces postmortem techniques and tools like mdb_v8 and DTrace, which enable deeper insight into both running and crashed Node.js programs. These tools have evolved to allow engineers to quickly diagnose issues that previously required extensive logging and time to resolve.
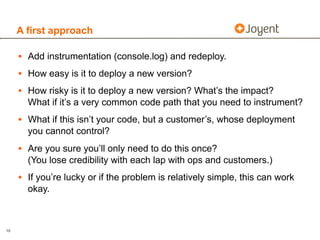

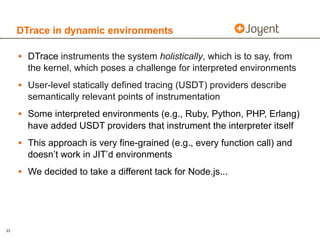
![DTrace example: Node GC time, per GC
#
dtrace –n ‘
node*:::gc-start { self->start = timestamp; }
node*:::gc-done/self->start/{
@[“microseconds”] = quantize((timestamp – self->start) / 1000);
self->start = 0;
}’
microseconds
value ------------- Distribution ------------- count
32 | 0
64 |@@@@@ 19
128 |@@ 6
256 |@@ 6
512 |@@@@ 13
1024 |@@@@@ 17
2048 |@@@@@@@ 24
4096 |@@@@@@@@ 29
8192 |@@@@@ 16
16384 |@ 5
32768 |@ 3
65536 | 1
131072 |@ 3
262144 | 0
25](https://image.slidesharecdn.com/surge2012-120927145536-phpapp02/85/Surge2012-25-320.jpg)


![[CCC-28c3] Post Memory Corruption Memory Analysis](https://cdn.slidesharecdn.com/ss_thumbnails/28c3-120107122834-phpapp02-thumbnail.jpg?width=640&height=640&fit=bounds)