Agenda
1. Prerequisites
○ Brief of Crash, Hang, Runtime error and Dump
○ Symbol Preparation
2. SOP
3. Case Study
○ COM crash
○ Thread safety
○ Hang problem
○ SQLite exception
○ Stack overflow
○ Insufficient Memory
○ Exception 0xC015000F
4. FAQ
5. Q & A
3.
What's CRASH
● Anapplication typically crashes when it performs an operation
which is not allowed by the operating system. The operating
system then triggers an exception or signal in the application.
● Unhanded SEH exception
○ Access violation
○ Divide by zero
○ Stack overflow
○ Float overflow/underflow
○ Illegal instruction
● C++/CLR exception
What's HANG
● Theprocess doesn't
have any response for
UI operation or other
process/thread. It
usually caused by
deadlock or infinite job.
● For example
○ Infinite loop
○ Infinite waiting
○ Deadlock
6.
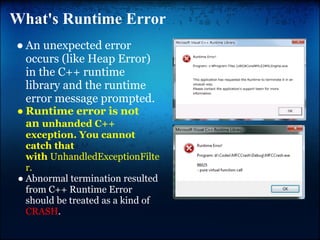
What's Runtime Error
●An unexpected error
occurs (like Heap Error)
in the C++ runtime
library and the runtime
error message prompted.
● Runtime error is not
an unhanded C++
exception. You cannot
catch that
with UnhandledExceptionFilte
r.
● Abnormal termination resulted
from C++ Runtime Error
should be treated as a kind of
CRASH.
7.
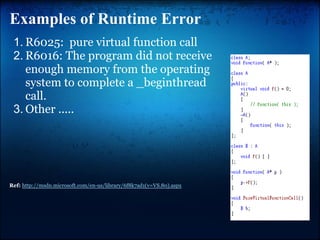
Examples of RuntimeError
1. R6025: pure virtual function call
2. R6016: The program did not receive
enough memory from the operating
system to complete a _beginthread
call.
3. Other .....
Ref: http://msdn.microsoft.com/en-us/library/6f8k7ad1(v=VS.80).aspx
8.
About Memory Dump
●What's a memory dump file
A memory dump is a snapshot of what the system had in
memory and copied to a file. This file is usually created at
the critical point of an error and can be used to debug the
problem.
● Why needs the dump file
Some crashes happen unpredictably (randomly) and vary in
different machines or scenarios. By capturing the memory
snapshot at the point, we could send that dump file
to engineer for the postmortem analysis.
9.
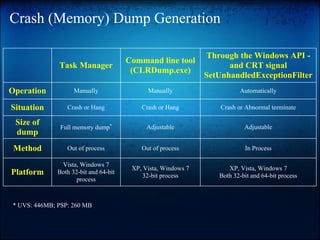
Crash (Memory) DumpGeneration
Through the Windows API -
Command line tool
Task Manager and CRT signal
(CLRDump.exe)
SetUnhandledExceptionFilter
Operation Manually Manually Automatically
Situation Crash or Hang Crash or Hang Crash or Abnormal terminate
Size of
Full memory dump* Adjustable Adjustable
dump
Method Out of process Out of process In Process
Vista, Windows 7
XP, Vista, Windows 7 XP, Vista, Windows 7
Platform Both 32-bit and 64-bit
32-bit process Both 32-bit and 64-bit process
process
* UVS: 446MB; PSP: 260 MB
10.
Agenda
1. Prerequisites
○ Brief of Crash, Hang, Runtime error and Dump
○ Symbol Preparation
2. SOP
3. Case Study
○ COM crash
○ Thread safety
○ Hang problem
○ SQLite exception
○ Stack overflow
○ Insufficient Memory
○ Exception 0xC015000F
4. FAQ
5. Q & A
About PDB Symbols...
1.Executable and symbol file is one-on-one mapping.
Even without code change and rebuild again, the new
symbol file can't be used in the old executable
and vice versa
○ Keep the symbol for each release build is important for
the postmortem debug.
2. Symbol server is recommended.
○ Microsoft already publishes all windows DLL symbol
files to http://msdl.microsoft.com/download/symbols
13.
Symbol Deployment (1)
1.Use the symstore.exe (a tool of Debugging Tools for
Windows) for symbol server deployment (or maintenance).
○ Available at http://msdn.microsoft.com/en-
us/windows/hardware/gg463009
2. Steps for symbol deployment
○ Configure all project setting with debug symbol enabled in
release build.
○ Gather all PDBs to a single folder
○ Run symstore to deploy the symbols to server.
■ It's nice to have permanent storage server for symbol
files.
○ Run symstore to deploy the executables as well.
14.
Symbol Deployment (2)
1.Symstore
Usage:
symstore add [/r] [/p] [/l] /f File /s Store /t Product [/v Version]
[/c Comment] [/d LogFile] [/compress]
symstore add [/r] [/p] [/l] [/q] /g Share /f File /x IndexFile [/a] [/d LogFile]
symstore del /i ID /s Store [/d LogFile]
add Add files to server or create an index file.
del Delete a transaction from the server.
query Check if file(s) are indexed on the server.
/f File Network path of files or directories to add.
If the named file begins with an '@' symbol, it is treated
as a response file which is expected to contain a list of
files (path and filename, 1 entry per line) to be stored.
/r Add files or directories recursively.
/s Store Root directory for the symbol store.
/t Product Name of the product.
/v Version Version of the product.
/c Comment Comment for the transaction.
/compress When storing files, store compressed files on the server. Ignored
when storing pointers.
15.
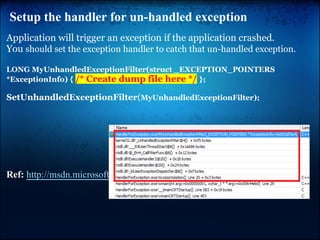
Setup the handlerfor un-handled exception
Application will trigger an exception if the application crashed.
You should set the exception handler to catch that un-handled exception.
LONG MyUnhandledExceptionFilter(struct _EXCEPTION_POINTERS
*ExceptionInfo) { /* Create dump file here */ };
SetUnhandledExceptionFilter(MyUnhandledExceptionFilter);
Ref: http://msdn.microsoft.com/en-us/library/ms680634(v=vs.85).aspx
16.
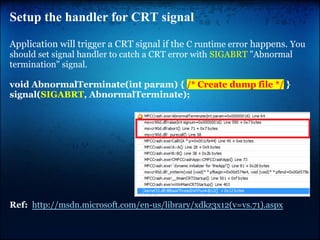
Setup the handlerfor CRT signal
Application will trigger a CRT signal if the C runtime error happens. You
should set signal handler to catch a CRT error with SIGABRT "Abnormal
termination" signal.
void AbnormalTerminate(int param) { /* Create dump file */ }
signal(SIGABRT, AbnormalTerminate);
Ref: http://msdn.microsoft.com/en-us/library/xdkz3x12(v=vs.71).aspx
17.
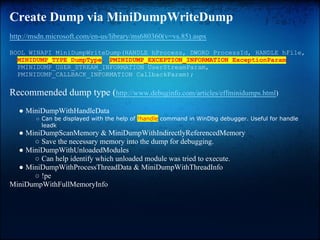
Create Dump viaMiniDumpWriteDump
http://msdn.microsoft.com/en-us/library/ms680360(v=vs.85).aspx
BOOL WINAPI MiniDumpWriteDump(HANDLE hProcess, DWORD ProcessId, HANDLE hFile,
MINIDUMP_TYPE DumpType, PMINIDUMP_EXCEPTION_INFORMATION ExceptionParam,
PMINIDUMP_USER_STREAM_INFORMATION UserStreamParam,
PMINIDUMP_CALLBACK_INFORMATION CallbackParam);
Recommended dump type (http://www.debuginfo.com/articles/effminidumps.html)
● MiniDumpWithHandleData
○ Can be displayed with the help of !handle command in WinDbg debugger. Useful for handle
leadk
● MiniDumpScanMemory & MiniDumpWithIndirectlyReferencedMemory
○ Save the necessary memory into the dump for debugging.
● MiniDumpWithUnloadedModules
○ Can help identify which unloaded module was tried to execute.
● MiniDumpWithProcessThreadData & MiniDumpWithThreadInfo
○ !pe
MiniDumpWithFullMemoryInfo
18.
General consideration forUnhandled
exception handler
1. Crash dump generation
○ Memory is too low to create dump?
○ In process/Out-of-process
2. Gather the necessary information
○ Registry/Screen capture/User comment?
3. Workflow for gathering the dump
4. Close the application gracefully.
5. Application recovery
19.
Agenda
1. Prerequisites
○ Brief of Crash, Hang, Runtime error and Dump
○ Symbol Preparation
2. SOP
3. Case Study
○ COM crash
○ Thread safety
○ Hang problem
○ SQLite exception
○ Stack overflow
○ Insufficient Memory
○ Exception 0xC015000F
4. FAQ
5. Q & A
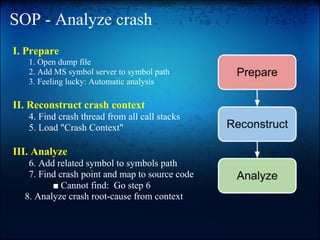
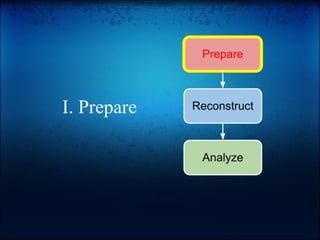
20.
SOP - Analyzecrash
I. Prepare
1. Open dump file
2. Add MS symbol server to symbol path
3. Feeling lucky: Automatic analysis
II. Reconstruct crash context
4. Find crash thread from all call stacks
5. Load "Crash Context"
III. Analyze
6. Add related symbol to symbols path
7. Find crash point and map to source code
■ Cannot find: Go step 6
8. Analyze crash root-cause from context
Step 1 Opendump file (1/2)
WinDbg is a powerful debugger that wraps NTSD and KD with a
better UI. You can download it from http://msdn.microsoft.com/en-
us/windows/hardware/gg463009 [13.8~17.5 MB]
The 32-bit version of Debugging Tools for Windows is the best
choice, unless you are debugging an x64 application on a 64-bit
processor.
Open a dump file: Launch WinDbg -> File -> "Open Crash Dump..."
23.
Step 1 Opendump file (2/2)
Case 1: In-of-process dump - Generated by x86 application itself
Loading Dump File [G:Upload121942MLE2 2011-03-22 11-43-40.dmp]
Executable search path is:
Windows 7 Version 7601 (Service Pack 1) MP (2 procs) Free x86 compatible
Product: WinNt, suite: SingleUserTS Personal
Machine Name:
Debug session time: Tue Mar 22 11:10:47.000 2011 (GMT+8)
System Uptime: not available
Process Uptime: 0 days 0:27:07.000
.................................................
This dump file has an exception of interest stored in it.
The stored exception information can be accessed via .ecxr.
Case 2: Out-of-process dump - Generated by x64 Task manager
Loading Dump File [G:Upload121942MLEngine.DMP]
User Mini Dump File with Full Memory: Only application data is available
(cut for clarity)
Executable search path is: Create x64 Task x86 Task
Windows 7 Version 7600 MP (4 procs) Free x64 dump manager manager
Product: WinNt, suite: SingleUserTS
Machine Name:
Debug session time: Tue Feb 22 12:07:12.000 2011 (GMT+8) x86 App Case 2 OK
System Uptime: 0 days 19:46:41.095
x64 App OK N/A
0:000> !wow64exts.sw /*switch from x64 to wow64*/
Switched to 32bit mode
0:000:x86>
24.
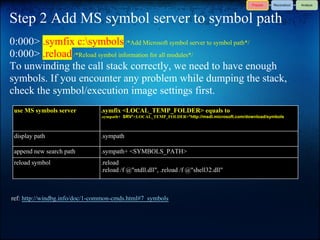
Step 2 AddMS symbol server to symbol path
0:000> .symfix c:symbols /*Add Microsoft symbol server to symbol path*/
0:000> .reload /*Reload symbol information for all modules*/
To unwinding the call stack correctly, we need to have enough
symbols. If you encounter any problem while dumping the stack,
check the symbol/execution image settings first.
use MS symbols server .symfix <LOCAL_TEMP_FOLDER> equals to
.sympath+ SRV*<LOCAL_TEMP_FOLDER>*http://msdl.microsoft.com/download/symbols
display path .sympath
append new search path .sympath+ <SYMBOLS_PATH>
reload symbol .reload
.reload /f @"ntdll.dll", .reload /f @"shell32.dll"
ref: http://windbg.info/doc/1-common-cmds.html#7_symbols
25.
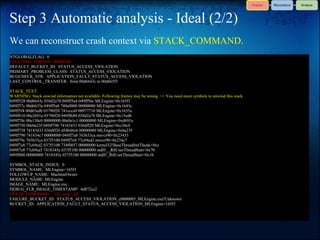
Step 3 Automaticanalysis - Ideal (1/2)
1. Ideal case
0:000> !analyze -v /* Display information about the current exception or bug check */
FAULTING_IP:
MLEngine+165f3
00d665f3 6683382f cmp word ptr [eax],2Fh
EXCEPTION_RECORD: ffffffff -- (.exr 0xffffffffffffffff)
ExceptionAddress: 00d665f3 (MLEngine+0x000165f3)
ExceptionCode: c0000005 (Access violation)
ExceptionFlags: 00000000
NumberParameters: 2
Parameter[0]: 00000000
Parameter[1]: 00000000
Attempt to read from address 00000000
PROCESS_NAME: MLEngine.exe
ERROR_CODE: (NTSTATUS) 0xc0000005 - The instruction at 0x%08lx referenced memory at 0x%08lx. The memory could not be %s.
EXCEPTION_CODE: (NTSTATUS) 0xc0000005 - The instruction at 0x%08lx referenced memory at 0x%08lx. The memory could not be
%s.
EXCEPTION_PARAMETER1: 00000000
EXCEPTION_PARAMETER2: 00000000
READ_ADDRESS: 00000000
FOLLOWUP_IP:
MLEngine+165f3
00d665f3 6683382f cmp word ptr [eax],2Fh
26.
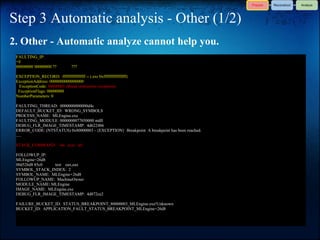
Step 3 Automaticanalysis - Ideal (2/2)
We can reconstruct crash context via STACK_COMMAND.
NTGLOBALFLAG: 0
FAULTING_THREAD: 000003d4
DEFAULT_BUCKET_ID: STATUS_ACCESS_VIOLATION
PRIMARY_PROBLEM_CLASS: STATUS_ACCESS_VIOLATION
BUGCHECK_STR: APPLICATION_FAULT_STATUS_ACCESS_VIOLATION
LAST_CONTROL_TRANSFER: from 00d6643c to 00d665f3
STACK_TEXT:
WARNING: Stack unwind information not available. Following frames may be wrong. <= You need more symbols to unwind this stack.
049ff528 00d6643c 038d2a70 049ff5a4 049ff56c MLEngine+0x165f3
049ff57c 00d6635a 049ff5a0 740e0000 00000000 MLEngine+0x1643c
049ff5f4 00d65edb 03790f20 741ccca9 00977710 MLEngine+0x1635a
049ff610 00e2691a 03790f20 049ff680 038d2a70 MLEngine+0x15edb
049ff70c 00e130c0 00000000 00e0a1c1 00000000 MLEngine+0xd691a
049ff750 00e0a23f 049ff790 74183433 036dff20 MLEngine+0xc30c0
049ff758 74183433 036dff20 d54b46c6 00000000 MLEngine+0xba23f
049ff790 741834c7 00000000 049ff7a8 765b33ca msvcr90+0x23433
049ff79c 765b33ca 037f5100 049ff7e8 77c69ed2 msvcr90+0x234c7
049ff7a8 77c69ed2 037f5100 734f0857 00000000 kernel32!BaseThreadInitThunk+0xe
049ff7e8 77c69ea5 7418345e 037f5100 00000000 ntdll!__RtlUserThreadStart+0x70
049ff800 00000000 7418345e 037f5100 00000000 ntdll!_RtlUserThreadStart+0x1b
SYMBOL_STACK_INDEX: 0
SYMBOL_NAME: MLEngine+165f3
FOLLOWUP_NAME: MachineOwner
MODULE_NAME: MLEngine
IMAGE_NAME: MLEngine.exe
DEBUG_FLR_IMAGE_TIMESTAMP: 4d872ce2
STACK_COMMAND: ~12s; .ecxr ; kb
FAILURE_BUCKET_ID: STATUS_ACCESS_VIOLATION_c0000005_MLEngine.exe!Unknown
BUCKET_ID: APPLICATION_FAULT_STATUS_ACCESS_VIOLATION_MLEngine+165f3
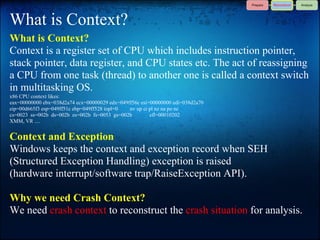
What is Context?
Whatis Context?
Context is a register set of CPU which includes instruction pointer,
stack pointer, data register, and CPU states etc. The act of reassigning
a CPU from one task (thread) to another one is called a context switch
in multitasking OS.
x86 CPU context likes:
eax=00000000 ebx=038d2a74 ecx=00000029 edx=049ff56c esi=00000000 edi=038d2a70
eip=00d665f3 esp=049ff51c ebp=049ff528 iopl=0 nv up ei pl nz na po nc
cs=0023 ss=002b ds=002b es=002b fs=0053 gs=002b efl=00010202
XMM, VR ....
Context and Exception
Windows keeps the context and exception record when SEH
(Structured Exception Handling) exception is raised
(hardware interrupt/software trap/RaiseException API).
Why we need Crash Context?
We need crash context to reconstruct the crash situation for analysis.
31.
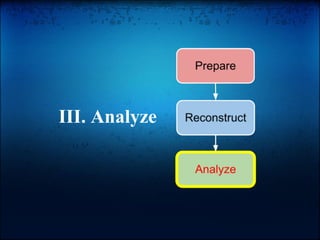
Step 4&5 Findcrash thread and load context - Ideal
A. Ideal - Minidump has an exception context
1. Find "STACK_COMMAND: ~12s; .ecxr ; kb" from result of "!Analyze -v"
2. Switch to crash thread and load execution context
0:000> ~12s /* switch thread to #12 */
0:012> .ecxr /* load exception context associated with the current exception */
eax=03011102 ebx=00000000 ecx=c4ff0111 edx=0000007f esi=033ed740 edi=00a40000
eip=77304efd esp=03f2f700 ebp=03f2f7e0 iopl=0 nv up ei pl zr na pe nc
cs=0023 ss=002b ds=002b es=002b fs=0053 gs=002b efl=00010246
ntdll!RtlpFreeHeap+0xa0a:
77304efd 8b11 mov edx,dword ptr [ecx] ds:002b:c4ff0111=????????
0:012> kb /* dump stack with arguments Stack length: the default is 20 */
*** Stack trace for last set context - .thread/.cxr resets it
ChildEBP RetAddr Args to Child
WARNING: Stack unwind information not available. Following frames may be wrong.
049ff528 00d6643c 038d2a70 049ff5a4 049ff56c MLEngine+0x165f3
049ff57c 00d6635a 049ff5a0 740e0000 00000000 MLEngine+0x1643c
049ff5f4 00d65edb 03790f20 741ccca9 00977710 MLEngine+0x1635a
049ff610 00e2691a 03790f20 049ff680 038d2a70 MLEngine+0x15edb
049ff70c 00e130c0 00000000 00e0a1c1 00000000 MLEngine+0xd691a
049ff750 00e0a23f 049ff790 74183433 036dff20 MLEngine+0xc30c0
*** WARNING: Unable to verify timestamp for msvcr90.dll
*** ERROR: Module load completed but symbols could not be loaded for msvcr90.dll
...
049ff7a8 77c69ed2 037f5100 734f0857 00000000 kernel32!BaseThreadInitThunk+0xe
049ff7e8 77c69ea5 7418345e 037f5100 00000000 ntdll!__RtlUserThreadStart+0x70
049ff800 00000000 7418345e 037f5100 00000000 ntdll!_RtlUserThreadStart+0x1b
32.
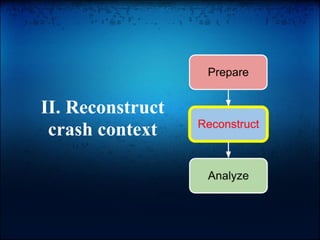
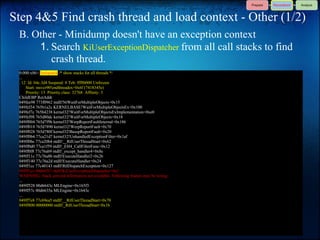
Step 4&5 Findcrash thread and load context - Other (1/2)
B. Other - Minidump doesn't have an exception context
1. Search KiUserExceptionDispatcher from all call stacks to find
crash thread.
0:000:x86> !uniqstack /* show stacks for all threads */
...
. 12 Id: b4c.3d4 Suspend: 0 Teb: fff8b000 Unfrozen
Start: msvcr90!endthreadex+0x6f (7418345e)
Priority: 15 Priority class: 32768 Affinity: 3
ChildEBP RetAddr
049fee98 773f0962 ntdll!NtWaitForMultipleObjects+0x15
049fef34 765b1a2c KERNELBASE!WaitForMultipleObjectsEx+0x100
049fef7c 765b4238 kernel32!WaitForMultipleObjectsExImplementation+0xe0
049fef98 765d80dc kernel32!WaitForMultipleObjects+0x18
049ff004 765d7f9b kernel32!WerpReportFaultInternal+0x186
049ff018 765d7890 kernel32!WerpReportFault+0x70
049ff028 765d780f kernel32!BasepReportFault+0x20
049ff0b4 77ca21d7 kernel32!UnhandledExceptionFilter+0x1af
049ff0bc 77ca20b4 ntdll!__RtlUserThreadStart+0x62
049ff0d0 77ca1f59 ntdll!_EH4_CallFilterFunc+0x12
049ff0f8 77c76ab9 ntdll!_except_handler4+0x8e
049ff11c 77c76a8b ntdll!ExecuteHandler2+0x26
049ff140 77c76a2d ntdll!ExecuteHandler+0x24
049ff1cc 77c40143 ntdll!RtlDispatchException+0x127
049ff1cc 00d665f3 ntdll!KiUserExceptionDispatcher+0xf
WARNING: Stack unwind information not available. Following frames may be wrong.
...
049ff528 00d6643c MLEngine+0x165f3
049ff57c 00d6635a MLEngine+0x1643c
...
049ff7e8 77c69ea5 ntdll!__RtlUserThreadStart+0x70
049ff800 00000000 ntdll!_RtlUserThreadStart+0x1b
33.
Step 4&5 Findcrash thread and load context - Other (2/2)
2. Find exception record and load context
The prototype of KiUserExceptionDispatcher is
KiUserExceptionDispatcher(EXCEPTION_RECORD* pExcptRec, CONTEXT *pContext)
and the calling convention is _stdcall. Hence, the argument-passing order is right
to left. You can load execution context from pContext.
0:000> ~12s /* switch thread to #12 */
0:012> kb /* dump stack with arguments Stack length: the default is 20 */
ChildEBP RetAddr Args to Child
...
049ff1cc 00d665f3 009ff1e4 049ff234 049ff1e4 ntdll!KiUserExceptionDispatcher+0xf
...
0:012> .exr 049FF1E4 /* display exception (or dt EXCEPTION_RECORD 049ff1e4 */
)
ExceptionAddress: 00d665f3 (MLEngine+0x000165f3)
ExceptionCode: c0000005 (Access violation)
ExceptionFlags: 00000000
NumberParameters: 2
Parameter[0]: 00000000
Parameter[1]: 00000000
Attempt to read from address 00000000
0:012> .cxr 049FF234 /* load context to thread #12 */
eax=00000000 ebx=038d2a74 ecx=00000029 edx=049ff56c esi=00000000 edi=038d2a70
eip=00d665f3 esp=049ff51c ebp=049ff528 iopl=0 nv up ei pl nz na po nc
cs=0023 ss=002b ds=002b es=002b fs=0053 gs=002b efl=00010202
MLEngine+0x165f3:
00d665f3 6683382f cmp word ptr [eax],2Fh ds:002b:00000000=????
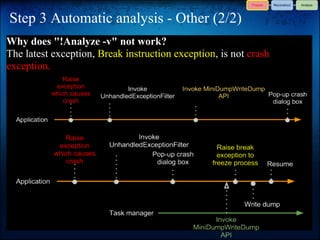
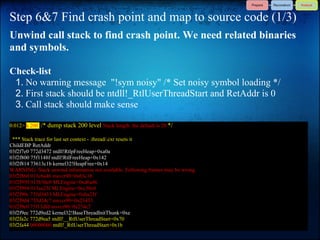
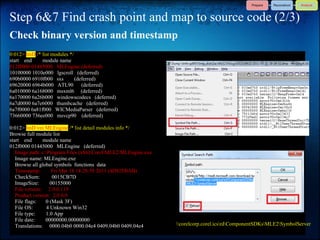
Step 6&7 Findcrash point and map to source code (1/3)
Unwind call stack to find crash point. We need related binaries
and symbols.
Check-list
1. No warning message "!sym noisy" /* Set noisy symbol loading */
2. First stack should be ntdll!_RtlUserThreadStart and RetAddr is 0
3. Call stack should make sense
0:012> k 200 /* dump stack 200 level Stack length: the default is 20 */
*** Stack trace for last set context - .thread/.cxr resets it
ChildEBP RetAddr
03f2f7e0 772d3472 ntdll!RtlpFreeHeap+0xa0a
03f2f800 75f1148f ntdll!RtlFreeHeap+0x142
03f2f814 73613c1b kernel32!HeapFree+0x14
WARNING: Stack unwind information not available. Following frames may be wrong.
03f2f860 013c6a46 msvcr90+0x63c1b
03f2f950 013b30c0 MLEngine+0xd6a46
03f2f994 013aa23f MLEngine+0xc30c0
03f2f99c 735d3433 MLEngine+0xba23f
03f2f9d4 735d34c7 msvcr90+0x23433
03f2f9e0 75f13dfd msvcr90+0x234c7
03f2f9ec 772d9ed2 kernel32!BaseThreadInitThunk+0xe
03f2fa2c 772d9ea5 ntdll!__RtlUserThreadStart+0x70
03f2fa44 00000000 ntdll!_RtlUserThreadStart+0x1b
38.
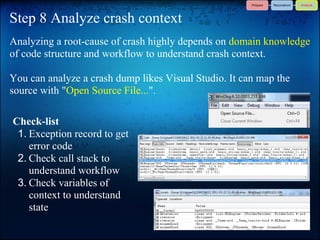
Step 6&7 Findcrash point and map to source code (2/3)
Check binary version and timestamp
0:012> lmD /* list modules */
start end module name
012f0000 01445000 MLEngine (deferred)
10100000 1010e000 lgscroll (deferred)
690b0000 6910f000 sxs (deferred)
69620000 6964b000 ATL90 (deferred)
6a010000 6a168000 msxml6 (deferred)
6a170000 6a26b000 windowscodecs (deferred)
6a7d0000 6a7e6000 thumbcache (deferred)
6a7f0000 6a81f000 WICMediaParser (deferred)
73660000 736ee000 msvcp90 (deferred)
0:012> lmD vm MLEngine /* list detail modules info */
Browse full module list
start end module name
012f0000 01445000 MLEngine (deferred)
Image path: c:Program Files (x86)CorelMLE2MLEngine.exe
Image name: MLEngine.exe
Browse all global symbols functions data
Timestamp: Fri Mar 18 14:28:59 2011 (4D82FBAB)
CheckSum: 0015CB7D
ImageSize: 00155000
File version: 2.0.0.119
Product version: 2.0.0.0
File flags: 0 (Mask 3F)
File OS: 4 Unknown Win32
File type: 1.0 App
File date: 00000000.00000000
Translations: 0000.04b0 0000.04e4 0409.04b0 0409.04e4 corelcorp.corel.icsrdComponentSDKsMLE2SymbolServer
39.
Step 6&7 Findcrash point and map to source code (3/3)
Map to source code
0:012> lmD /* list modules */
start end module name
012f0000 01445000 MLEngine T (private pdb symbols) C:Program Files (x86)Debugging Tools for Windows (x86)
symMLEngine.pdb4EC89C52E43647339825CF2D6F9D73F91MLEngine.pdb
10100000 1010e000 lgscroll T (no symbols)
....
0:012> k 200 /* dump stack 200 level */
*** Stack trace for last set context - .thread/.cxr resets it
ChildEBP RetAddr
049ff528 00d6643c MLEngine!boost::filesystem::detail::first_element<std::basic_string<wchar_t,std::char_traits<wchar_t>,std::
allocator<wchar_t> >,boost::filesystem::wpath_traits>+0x53 [e:usrcomsdk-mle2p4sdkmle2boost_1_42_0boostfilesystempath.
hpp @ 828]
049ff57c 00d6635a MLEngine!boost::filesystem::basic_path<std::basic_string<wchar_t,std::char_traits<wchar_t>,std::
allocator<wchar_t>
...
MLEngine!std::_Tree<std::_Tmap_traits<boost::filesystem::basic_path<std::basic_string<wchar_t,std::char_traits<wchar_t>,
std::allocator<wchar_t> >,boost::filesystem::wpath_traits>,void *,std::less<boost::filesystem::basic_path<std::basic_string<wchar_t,
std::char_traits<wchar_t>,std::allocator<wchar_t> >,boost::filesystem::wpath_traits> >,std::allocator<std::pair<boost::filesystem::
basic_path<std::basic_string<wchar_t,std::char_traits<wchar_t>,std::allocator<wchar_t> >,boost::filesystem::wpath_traits> const ,void
*> >,0> >::_Eqrange+0x2b [c:program filesmicrosoft visual studio 9.0vcincludextree @ 1138]
049ff70c 00e130c0 MLEngine!MLEngine::CFolderWatcher::MonitorThread+0x5ba [e:usrcomsdk-
mle2p4sdkmle2mainmlenginefolderwatcher.cpp @ 344]
049ff79c 765b33ca MLEngine!DOL::DSystem::DThreads::DThreadCallback::ThreadFunction+0x10 [e:usrcomsdk-
mle2p4shared2libsl_dolsourcedoldsystemdthreadsdthreadcallback.cpp @ 51]
049ff7a8 77c69ed2 kernel32!BaseThreadInitThunk+0xe
049ff7e8 77c69ea5 ntdll!__RtlUserThreadStart+0x70
049ff800 00000000 ntdll!_RtlUserThreadStart+0x1b
40.
Step 8 Analyzecrash context
Analyzing a root-cause of crash highly depends on domain knowledge
of code structure and workflow to understand crash context.
You can analyze a crash dump likes Visual Studio. It can map the
source with "Open Source File...".
Check-list
1. Exception record to get
error code
2. Check call stack to
understand workflow
3. Check variables of
context to understand
state
41.
Agenda
1. Prerequisites
○ Brief of Crash, Hang, Runtime error and Dump
○ Symbol Preparation
2. SOP
3. Case Study
○ COM crash
○ Thread safety
○ Hang problem
○ SQLite exception
○ Stack overflow
○ Insufficient Memory
○ Exception 0xC015000F
4. FAQ
5. Q & A
Case Study -Thread safety problem
Thread safety problem causes
● Unexpected state (race condition)
● Strange behavior
Crash is not inevitable result for thread safety problem. However, dump
is a state snapshot of crashed program. It can provide clues.
0:012> k 200
*** Stack trace for last set context - .thread/.cxr resets it
ChildEBP RetAddr
049ff528 00d6643c
...
MLEngine!std::_Tree<std::_Tmap_traits<boost::filesystem::basic_path<std::basic_string<wchar_t,std::char_traits<wchar_t>
,std::allocator<wchar_t> >,boost::filesystem::wpath_traits>,void *,std::less<boost::filesystem::basic_path<std::basic_string<wchar_t,
std::char_traits<wchar_t>,std::allocator<wchar_t> >,boost::filesystem::wpath_traits> >,std::allocator<std::pair<boost::filesystem::
basic_path<std::basic_string<wchar_t,std::char_traits<wchar_t>,std::allocator<wchar_t> >,boost::filesystem::wpath_traits> const ,
void *> >,0> >::_Eqrange+0x2b [c:program filesmicrosoft visual studio 9.0vcincludextree @ 1138]
049ff70c 00e130c0 MLEngine!MLEngine::CFolderWatcher::MonitorThread+0x5ba [e:usrcomsdk-
mle2p4sdkmle2mainmlenginefolderwatcher.cpp @ 344]
049ff79c 765b33ca MLEngine!DOL::DSystem::DThreads::DThreadCallback::ThreadFunction+0x10 [e:usrcomsdk-
mle2p4shared2libsl_dolsourcedoldsystemdthreadsdthreadcallback.cpp @ 51]
049ff7a8 77c69ed2 kernel32!BaseThreadInitThunk+0xe
049ff7e8 77c69ea5 ntdll!__RtlUserThreadStart+0x70
049ff800 00000000 ntdll!_RtlUserThreadStart+0x1b
44.
Case Study -Hang problem
Hang problem can be
● Infinite loop
● Infinite waiting
● Livelock
● Deadlock
A context of a hang problem can cross many threads, and it can be
static or very dynamic. A dump file is a snapshot of hang situation.
0:004> k 200
...
02bbf0b0 010c03fe kernel32!WaitForSingleObject+0x12
02bbf0f8 0102644f MLEngine!DOL::DSystem::DThreads::DSemaphore::Wait+0x1e
02bbf13c 010c92f0 MLEngine!DOL::DSystem::DThreads::DTimerQueue<MLEngine::CTaskBase *,6>::Enqueue+0x4f
02bbf374 010db822 MLEngine!MLEngine::CTaskScheduler::EnqueueForegroundQueue+0x120
02bbf724 010dbc28 MLEngine!MLEngine::CCheckChangeTask::ExecuteCheckChange+0x842
02bbf76c 010c881d MLEngine!MLEngine::CCheckChangeTask::Execute+0xf8
02bbf894 01026c49 MLEngine!MLEngine::CTaskScheduler::ForegroundHandler+0x7d
02bbf8e4 6ca43c1b MLEngine!DOL::DSystem::DThreads::DTimerQueue<MLEngine::CTaskBase *,6>::THandlerAdapter+0x189
...
02bbf9c0 77c2b468 ntdll!__RtlUserThreadStart+0x70
02bbf9d8 00000000 ntdll!_RtlUserThreadStart+0x1b
45.
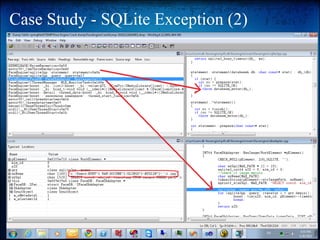
Case Study -SQLite Exception (1)
EXCEPTION_RECORD: ffffffff -- (.exr 0xffffffffffffffff)
ExceptionAddress: 75c19617 (KERNELBASE!RaiseException+0x00000058)
ExceptionCode: e06d7363 (C++ EH exception)
ExceptionFlags: 00000001
NumberParameters: 3 The initial "E" standing for "exception"
Parameter[0]: 19930520 The final 3 bytes (0x6D7363) representing the
Parameter[1]: 02f5d964 ASCII values of "msc"
Parameter[2]: 00f55828
...
0:010> k /* dump the call stack */
*** Stack trace for last set context - .thread/.cxr resets it
ChildEBP RetAddr
02f5d914 720cdbf9 KERNELBASE!RaiseException+0x58
02f5d94c 00f3982a msvcr90!_CxxThrowException+0x48
02f5d99c 00f3a197 FaceEngine!sqlite3pp::statement::statement+0x8a [e:usrcomsdk-
faceenginep4sdkfaceenginemainfaceenginesqlite3pp.cpp @ 186]
02f5d9b0 00f0bd92 FaceEngine!sqlite3pp::query::query+0x17 [e:usrcomsdk-
faceenginep4sdkfaceenginemainfaceenginesqlite3pp.cpp @ 452]
02f5de54 00f1bc3e FaceEngine!FaceDB::FaceDbAdapter::HasImage+0x132 [e:usrcomsdk-
faceenginep4sdkfaceenginemainfaceenginedbadapter.cpp @ 398]
02f5f9c8 00f37e8f FaceEngine!CThreadManager::MLE_MonitorTask+0x148e [e:usrcomsdk-
faceenginep4sdkfaceenginemainfaceenginethreadmanager.cpp @ 202]
02f5f9dc 00f37e40 FaceEngine!boost::_bi::list2<boost::_bi::value<ATL::CComPtr<IMediaLibraryClient> >,boost::_bi::
value<CFaceClientCore *> >::operator()<void (__cdecl*)(IMediaLibraryClient *,CFaceClientCore *),boost::_bi::list0>+0x3f [e:
usrcomsdk-faceenginep4sdkmle2boost_1_42_0boostbindbind.hpp @ 313]
...
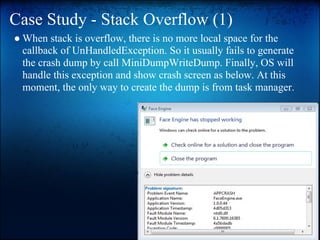
Case Study -Stack Overflow (1)
● When stack is overflow, there is no more local space for the
callback of UnHandledException. So it usually fails to generate
the crash dump by call MiniDumpWriteDump. Finally, OS will
handle this exception and show crash screen as below. At this
moment, the only way to create the dump is from task manager.
48.
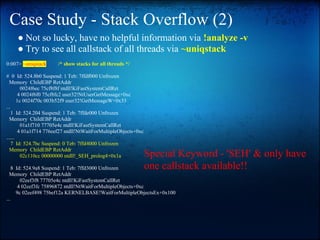
Case Study -Stack Overflow (2)
● Not so lucky, have no helpful information via !analyze -v
● Try to see all callstack of all threads via ~uniqstack
0:007> ~uniqstack /* show stacks for all threads */
# 0 Id: 524.8b0 Suspend: 1 Teb: 7ffdf000 Unfrozen
Memory ChildEBP RetAddr
0024f6ec 75cf8f8f ntdll!KiFastSystemCallRet
4 0024f6f0 75cf8fc2 user32!NtUserGetMessage+0xc
1c 0024f70c 003b52f9 user32!GetMessageW+0x33
...
1 Id: 524.204 Suspend: 1 Teb: 7ffde000 Unfrozen
Memory ChildEBP RetAddr
01a1f710 77705e4c ntdll!KiFastSystemCallRet
4 01a1f714 776eef27 ntdll!NtWaitForMultipleObjects+0xc
......
7 Id: 524.7bc Suspend: 0 Teb: 7ffd4000 Unfrozen
Memory ChildEBP RetAddr
02c110cc 00000000 ntdll!_SEH_prolog4+0x1a Special Keyword - 'SEH' & only have
8 Id: 524.9a8 Suspend: 1 Teb: 7ffd3000 Unfrozen one callstack available!!
Memory ChildEBP RetAddr
02eef3f8 77705e4c ntdll!KiFastSystemCallRet
4 02eef3fc 75896872 ntdll!NtWaitForMultipleObjects+0xc
9c 02eef498 75bef12a KERNELBASE!WaitForMultipleObjectsEx+0x100
...
49.
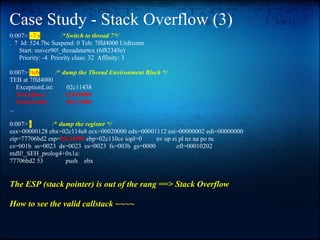
Case Study -Stack Overflow (3)
0:007> ~7 s /*Switch to thread 7*/
. 7 Id: 524.7bc Suspend: 0 Teb: 7ffd4000 Unfrozen
Start: msvcr90!_threadstartex (6f82345e)
Priority: -4 Priority class: 32 Affinity: 3
0:007> !teb /* dump the Thread Environment Block */
TEB at 7ffd4000
ExceptionList: 02c11438
StackBase: 02d10000
StackLimit: 02c11000
...
0:007> r /* dump the register */
eax=00000128 ebx=02c114a8 ecx=00020000 edx=00001112 esi=00000002 edi=00000000
eip=77706bd2 esp=02c10f94 ebp=02c110cc iopl=0 nv up ei pl nz na po nc
cs=001b ss=0023 ds=0023 es=0023 fs=003b gs=0000 efl=00010202
ntdll!_SEH_prolog4+0x1a:
77706bd2 53 push ebx
The ESP (stack pointer) is out of the rang ==> Stack Overflow
How to see the valid callstack ~~~~
50.
Case Study -Stack Overflow (4)
What's Stack Pointer & Frame Pointer
51.
Case Study -Stack Overflow (5)
● Try to correct the frame pointer to see the callstack
0:007> dd ebp /* Dump the last frame pointer */
02c110cc 02c11448 777203a9 75e80000 0019d000
...
0:007> k = 02c11448 20 /* Dump the callstack with last correct frame pointer */
...
02c12238 003b456b dbghelp!MiniDumpWriteDump+0xf2
02c1228c 003b43b8 FaceEngine!SFUnhandledExceptionFilter::CreateMiniDump+0xab
02c12b40 75c02c2a FaceEngine!SFUnhandledExceptionFilter::UnhandledExceptionFilter+0x138
...
0:007> .frame /c = 02c1228c /* Set the local frame context and check the local variable */
52.
Case Study -Insufficient Memory
● If full dump is available and the file size is up to 1.5G, then we almost think the process is out of memory. But
how to prove it?
0:000> !address -summary
ProcessParametrs 004311c8 in range 00430000 00530000
Environment 0eb2e050 in range 0e8d0000 0ecd0000
-------------------- Usage SUMMARY --------------------------
TotSize ( KB) Pct(Tots) Pct(Busy) Usage
78df000 ( 123772) : 05.90% 00.00% : RegionUsageFree
125d2000 ( 300872) : 14.35% 15.25% : RegionUsageImage
930e000 ( 150584) : 07.18% 07.63% : RegionUsageStack
8b000 ( 556) : 00.03% 00.03% : RegionUsageTeb
3cfde000 ( 999288) : 47.65% 50.64% : RegionUsageHeap
1000 ( 4) : 00.00% 00.00% : RegionUsagePeb
Tot: 7fff0000 (2097088 KB) Busy: 78711000 (1973316 KB)
-------------------- Type SUMMARY --------------------------
TotSize ( KB) Pct(Tots) Usage
78df000 ( 123772) : 05.90% : <free>
13307000 ( 314396) : 14.99% : MEM_IMAGE
8c7b000 ( 143852) : 06.86% : MEM_MAPPED
5c78f000 ( 1515068) : 72.25% : MEM_PRIVATE
-------------------- State SUMMARY --------------------------
TotSize ( KB) Pct(Tots) Usage
64bb7000 ( 1650396) : 78.70% : MEM_COMMIT
78df000 ( 123772) : 05.90% : MEM_FREE
13b5a000 ( 322920) : 15.40% : MEM_RESERVE
Largest free region: Base 3da36000 - Size 0018a000 (1576 KB)
53.
Case Study -Exception 0xc015000f (1)
0:001> !analyze -v
FAULTING_IP:
ntdll!RtlDeactivateActivationContext+154
771e45c1 8b36 mov esi,dword ptr [esi]
EXCEPTION_RECORD: ffffffff -- (.exr 0xffffffffffffffff)
ExceptionAddress: 771e45c1 (ntdll!RtlDeactivateActivationContext+0x00000154)
ExceptionCode: c015000f
...
PROCESS_NAME: Corel PaintShop Photo Pro.exe
ERROR_CODE: (NTSTATUS) 0xc015000f - The activation context being deactivated is not the most recently activated one.
EXCEPTION_CODE: (NTSTATUS) 0xc015000f - The activation context being deactivated is not the most recently activated one.
...
ntdll!RtlDeactivateActivationContext+0x154
kernel32!DeactivateActCtx+0x31
mfc90u!AFX_MAINTAIN_STATE2::~AFX_MAINTAIN_STATE2+0x1c
mfc90u!AfxWndProcBase+0x66
user32!InternalCallWinProc+0x23
user32!UserCallWinProcCheckWow+0x109
user32!DispatchMessageWorker+0x3bc
user32!DispatchMessageW+0xf
mfc90u!AfxInternalPumpMessage+0x40
mfc90u!CWinThread::Run+0x5b
Corel_PaintShop_Photo_Pro!CPSPApp::Run+0x18
54.
Case Study -Exception 0xc015000f (2)
● The easiest steps to re-gen this issue are
1. Windows x64
2. MFC based
3. Make the app crash in OnCreate
4. http://connectppe.microsoft.com/VisualStudio/feedback/details/563622/mfc-
default-exception-handling-causes-problems-with-activation-context#details
● So what's 0xc015000f?
○ http://support.microsoft.com/kb/976038
Consider the following scenario:
● You run an application on a 64-bit version of Windows Server 2008, Windows Vista, Windows Server 2008 R2, or Windows 7.
● An exception that is thrown in a callback routine runs in the user mode.
In this scenario, this exception does not cause the application to crash. Instead, the application enters into an
inconsistent state. Then, the application throws a different exception and crashes.
A user mode callback function is typically an application-defined function that is called by a kernel mode
component. Examples of user mode callback functions are Windows procedures and hook procedures. These
functions are called by Windows to process Windows messages or to process Windows hook events.
55.
Agenda
1. Prerequisites
○ Brief of Crash, Hang, Runtime error and Dump
○ Symbol Preparation
2. SOP
3. Case Study
○ COM crash
○ Thread safety
○ Hang problem
○ SQLite exception
○ Stack overflow
○ Insufficient Memory
○ Exception 0xC015000F
4. FAQ
5. Q & A
56.
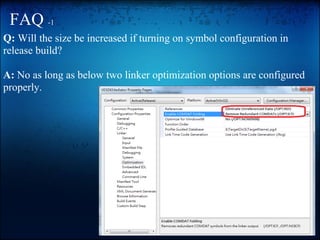
FAQ -1
Q: Willthe size be increased if turning on symbol configuration in
release build?
A: No as long as below two linker optimization options are configured
properly.
57.
FAQ -2
Q: Howto do the dump analysis in case the symbol file was lost.
A: Rebuild the source code to have the corresponding symbol and
turn on SYMOPT_LOAD_ANYTHING (via .symopt +0x04) to
ingore mismatch symbol error. But it's highly suggested to keep each
major release symbol, since we can't make sure if the build machine
configuration (e.x. VS service pack) still same with the old one.
Q: Is there any limitation for a dump which is generated from a TR
protected program?
A: So far, NO. The callstack should be able to see as other non-TR
dump. But some data might be protected and can't see from the
dump.
58.
FAQ -3
Q: CanI use Visual Studio to analyze the dump? Is there any
difference between WinDbg & VS regarding Postmortem debug?
A: Yes as long as you can get the useful information. Actually, in
some case, VS could provide faster and easier analysis. However,
WinDbg provide more powerful & flexible commands to analyze the
dump. Besides, WinDbg supports script capability, it'll be much
helpful to do the batch analysis.
Q: Is there any code to reference?
A: Yes, the project - crashrpt (Ref: http://code.google.
com/p/crashrpt/) provides a good example for all kinds runtime error
and SH exception. It also demonstrates the workflow to gather the
crash dump.
59.
FAQ -4
Q: Debuggingsymbols for msvcr90.dll not found on microsoft
symbol server
A: Yes that is the problem. All I needed to do was make a folder that
corresponded to the location of msvcr90.dll on the original machine
that produced the minidump file, put the DLL in it, and the DLL was
found by the debugger. Then its symbols were found.
http://social.msdn.microsoft.
com/Forums/en/vcgeneral/thread/47de00bd-af5b-44d8-9565-
40973993a079
http://connect.microsoft.
com/VisualStudio/feedback/details/559824/visual-studio-2008-sp1-
crt-dlls-are-missing-symbols-on-the-symbol-server
60.
Agenda
1. Prerequisites
○ Brief of Crash, Hang, Runtime error and Dump
○ Symbol Preparation
2. SOP
3. Case Study
○ COM crash
○ Thread safety
○ Hang problem
○ SQLite exception
○ Stack overflow
○ Insufficient Memory
○ Exception 0xC015000F
4. FAQ
5. Q & A

![Symbol Deployment (2)
1. Symstore
Usage:
symstore add [/r] [/p] [/l] /f File /s Store /t Product [/v Version]
[/c Comment] [/d LogFile] [/compress]
symstore add [/r] [/p] [/l] [/q] /g Share /f File /x IndexFile [/a] [/d LogFile]
symstore del /i ID /s Store [/d LogFile]
add Add files to server or create an index file.
del Delete a transaction from the server.
query Check if file(s) are indexed on the server.
/f File Network path of files or directories to add.
If the named file begins with an '@' symbol, it is treated
as a response file which is expected to contain a list of
files (path and filename, 1 entry per line) to be stored.
/r Add files or directories recursively.
/s Store Root directory for the symbol store.
/t Product Name of the product.
/v Version Version of the product.
/c Comment Comment for the transaction.
/compress When storing files, store compressed files on the server. Ignored
when storing pointers.](https://image.slidesharecdn.com/crashdumpanalysisexperiencesharing-130110101204-phpapp01/85/Crash-dump-analysis-experience-sharing-14-320.jpg)
![Step 1 Open dump file (1/2)
WinDbg is a powerful debugger that wraps NTSD and KD with a
better UI. You can download it from http://msdn.microsoft.com/en-
us/windows/hardware/gg463009 [13.8~17.5 MB]
The 32-bit version of Debugging Tools for Windows is the best
choice, unless you are debugging an x64 application on a 64-bit
processor.
Open a dump file: Launch WinDbg -> File -> "Open Crash Dump..."](https://image.slidesharecdn.com/crashdumpanalysisexperiencesharing-130110101204-phpapp01/85/Crash-dump-analysis-experience-sharing-22-320.jpg)
![Step 1 Open dump file (2/2)
Case 1: In-of-process dump - Generated by x86 application itself
Loading Dump File [G:Upload121942MLE2 2011-03-22 11-43-40.dmp]
Executable search path is:
Windows 7 Version 7601 (Service Pack 1) MP (2 procs) Free x86 compatible
Product: WinNt, suite: SingleUserTS Personal
Machine Name:
Debug session time: Tue Mar 22 11:10:47.000 2011 (GMT+8)
System Uptime: not available
Process Uptime: 0 days 0:27:07.000
.................................................
This dump file has an exception of interest stored in it.
The stored exception information can be accessed via .ecxr.
Case 2: Out-of-process dump - Generated by x64 Task manager
Loading Dump File [G:Upload121942MLEngine.DMP]
User Mini Dump File with Full Memory: Only application data is available
(cut for clarity)
Executable search path is: Create x64 Task x86 Task
Windows 7 Version 7600 MP (4 procs) Free x64 dump manager manager
Product: WinNt, suite: SingleUserTS
Machine Name:
Debug session time: Tue Feb 22 12:07:12.000 2011 (GMT+8) x86 App Case 2 OK
System Uptime: 0 days 19:46:41.095
x64 App OK N/A
0:000> !wow64exts.sw /*switch from x64 to wow64*/
Switched to 32bit mode
0:000:x86>](https://image.slidesharecdn.com/crashdumpanalysisexperiencesharing-130110101204-phpapp01/85/Crash-dump-analysis-experience-sharing-23-320.jpg)
![Step 3 Automatic analysis - Ideal (1/2)
1. Ideal case
0:000> !analyze -v /* Display information about the current exception or bug check */
FAULTING_IP:
MLEngine+165f3
00d665f3 6683382f cmp word ptr [eax],2Fh
EXCEPTION_RECORD: ffffffff -- (.exr 0xffffffffffffffff)
ExceptionAddress: 00d665f3 (MLEngine+0x000165f3)
ExceptionCode: c0000005 (Access violation)
ExceptionFlags: 00000000
NumberParameters: 2
Parameter[0]: 00000000
Parameter[1]: 00000000
Attempt to read from address 00000000
PROCESS_NAME: MLEngine.exe
ERROR_CODE: (NTSTATUS) 0xc0000005 - The instruction at 0x%08lx referenced memory at 0x%08lx. The memory could not be %s.
EXCEPTION_CODE: (NTSTATUS) 0xc0000005 - The instruction at 0x%08lx referenced memory at 0x%08lx. The memory could not be
%s.
EXCEPTION_PARAMETER1: 00000000
EXCEPTION_PARAMETER2: 00000000
READ_ADDRESS: 00000000
FOLLOWUP_IP:
MLEngine+165f3
00d665f3 6683382f cmp word ptr [eax],2Fh](https://image.slidesharecdn.com/crashdumpanalysisexperiencesharing-130110101204-phpapp01/85/Crash-dump-analysis-experience-sharing-25-320.jpg)
![Step 4&5 Find crash thread and load context - Ideal
A. Ideal - Minidump has an exception context
1. Find "STACK_COMMAND: ~12s; .ecxr ; kb" from result of "!Analyze -v"
2. Switch to crash thread and load execution context
0:000> ~12s /* switch thread to #12 */
0:012> .ecxr /* load exception context associated with the current exception */
eax=03011102 ebx=00000000 ecx=c4ff0111 edx=0000007f esi=033ed740 edi=00a40000
eip=77304efd esp=03f2f700 ebp=03f2f7e0 iopl=0 nv up ei pl zr na pe nc
cs=0023 ss=002b ds=002b es=002b fs=0053 gs=002b efl=00010246
ntdll!RtlpFreeHeap+0xa0a:
77304efd 8b11 mov edx,dword ptr [ecx] ds:002b:c4ff0111=????????
0:012> kb /* dump stack with arguments Stack length: the default is 20 */
*** Stack trace for last set context - .thread/.cxr resets it
ChildEBP RetAddr Args to Child
WARNING: Stack unwind information not available. Following frames may be wrong.
049ff528 00d6643c 038d2a70 049ff5a4 049ff56c MLEngine+0x165f3
049ff57c 00d6635a 049ff5a0 740e0000 00000000 MLEngine+0x1643c
049ff5f4 00d65edb 03790f20 741ccca9 00977710 MLEngine+0x1635a
049ff610 00e2691a 03790f20 049ff680 038d2a70 MLEngine+0x15edb
049ff70c 00e130c0 00000000 00e0a1c1 00000000 MLEngine+0xd691a
049ff750 00e0a23f 049ff790 74183433 036dff20 MLEngine+0xc30c0
*** WARNING: Unable to verify timestamp for msvcr90.dll
*** ERROR: Module load completed but symbols could not be loaded for msvcr90.dll
...
049ff7a8 77c69ed2 037f5100 734f0857 00000000 kernel32!BaseThreadInitThunk+0xe
049ff7e8 77c69ea5 7418345e 037f5100 00000000 ntdll!__RtlUserThreadStart+0x70
049ff800 00000000 7418345e 037f5100 00000000 ntdll!_RtlUserThreadStart+0x1b](https://image.slidesharecdn.com/crashdumpanalysisexperiencesharing-130110101204-phpapp01/85/Crash-dump-analysis-experience-sharing-31-320.jpg)
![Step 4&5 Find crash thread and load context - Other (2/2)
2. Find exception record and load context
The prototype of KiUserExceptionDispatcher is
KiUserExceptionDispatcher(EXCEPTION_RECORD* pExcptRec, CONTEXT *pContext)
and the calling convention is _stdcall. Hence, the argument-passing order is right
to left. You can load execution context from pContext.
0:000> ~12s /* switch thread to #12 */
0:012> kb /* dump stack with arguments Stack length: the default is 20 */
ChildEBP RetAddr Args to Child
...
049ff1cc 00d665f3 009ff1e4 049ff234 049ff1e4 ntdll!KiUserExceptionDispatcher+0xf
...
0:012> .exr 049FF1E4 /* display exception (or dt EXCEPTION_RECORD 049ff1e4 */
)
ExceptionAddress: 00d665f3 (MLEngine+0x000165f3)
ExceptionCode: c0000005 (Access violation)
ExceptionFlags: 00000000
NumberParameters: 2
Parameter[0]: 00000000
Parameter[1]: 00000000
Attempt to read from address 00000000
0:012> .cxr 049FF234 /* load context to thread #12 */
eax=00000000 ebx=038d2a74 ecx=00000029 edx=049ff56c esi=00000000 edi=038d2a70
eip=00d665f3 esp=049ff51c ebp=049ff528 iopl=0 nv up ei pl nz na po nc
cs=0023 ss=002b ds=002b es=002b fs=0053 gs=002b efl=00010202
MLEngine+0x165f3:
00d665f3 6683382f cmp word ptr [eax],2Fh ds:002b:00000000=????](https://image.slidesharecdn.com/crashdumpanalysisexperiencesharing-130110101204-phpapp01/85/Crash-dump-analysis-experience-sharing-33-320.jpg)
![Step 4&5 Find crash thread and load context - Misc
C Runtime Error - 1
Microsoft Visual C++ unhanded exception
CRT registers a default exception filter, __CxxUnhandledExceptionFilter, for
C++ unhanded exception.
0:000:x86> !uniqstack /* show stacks for all threads */
Processing 1 threads, please wait
. 0 Id: 2120.1e34 Suspend: 0 Teb: 00000000`7efdb000 Unfrozen
Start: MFCCrash!wWinMainCRTStartup (00000000`01188025)
Priority: 0 Priority class: 32 Affinity: f
ChildEBP RetAddr
...
001df158 7483beae msvcr90!abort+0x26 [f:ddvctoolscrt_bldself_x86crtsrcabort.c @ 59]
001df188 01188243 msvcr90!terminate+0x33 [f:ddvctoolscrt_bldself_x86crtprebuildehhooks.cpp @ 130]
001df190 76869d57 MFCCrash!__CxxUnhandledExceptionFilter+0x3c [f:ddvctoolscrt_bldself_x86crtprebuildehunhandld.cpp @ 72]
001df218 773706e7 kernel32!UnhandledExceptionFilter+0x127
...
001df350 7541b727 ntdll_77300000!KiUserExceptionDispatcher+0xf
001df6d0 7483df60 KERNELBASE!RaiseException+0x58
001df708 0118471c msvcr90!_CxxThrowException+0x48 [f:ddvctoolscrt_bldself_x86crtprebuildehthrow.cpp @ 161]
001df72c 74802201 MFCCrash!CMFCCrashApp::CMFCCrashApp+0x5c [d:codesmfccrashmfccrashmfccrash.cpp @ 72]
001df738 01187e25 msvcr90!_initterm+0x13 [f:ddvctoolscrt_bldself_x86crtsrccrt0dat.c @ 903]
001df7c4 76843677 MFCCrash!__tmainCRTStartup+0xc0 [f:ddvctoolscrt_bldself_x86crtsrccrtexe.c @ 501]
001df7d0 77339d42 kernel32!BaseThreadInitThunk+0xe
001df810 77339d15 ntdll_77300000!__RtlUserThreadStart+0x70
001df828 00000000 ntdll_77300000!_RtlUserThreadStart+0x1b](https://image.slidesharecdn.com/crashdumpanalysisexperiencesharing-130110101204-phpapp01/85/Crash-dump-analysis-experience-sharing-34-320.jpg)
![Step 4&5 Find crash thread and load context - Misc
C Runtime Error - 2
Not all C runtime errors are SEH exceptions.
0:000:x86> !uniqstack /* show stacks for all threads */
Processing 1 threads, please wait
. 0 Id: 2e1c.214c Suspend: 0 Teb: 00000000`7efdb000 Unfrozen
Start: MFCCrash!wWinMainCRTStartup (00000000`00168054)
Priority: 0 Priority class: 32 Affinity: f
ChildEBP RetAddr
002ef4a4 74f62674 user32!NtUserWaitMessage+0x15
002ef4e0 74f6288a user32!DialogBox2+0x222
002ef50c 74f9f8d0 user32!InternalDialogBox+0xe5
002ef5c0 74f9fbac user32!SoftModalMessageBox+0x757
002ef718 74f9fcaf user32!MessageBoxWorker+0x269
002ef784 74f9fd2e user32!MessageBoxTimeoutW+0x52
002ef7b8 74f9fe81 user32!MessageBoxTimeoutA+0x76
002ef7d8 74f9fec6 user32!MessageBoxExA+0x1b
002ef7f4 7484daa8 user32!MessageBoxA+0x18
002ef82c 74802675 msvcr90!__crtMessageBoxA+0x160 [f:ddvctoolscrt_bldself_x86crtsrccrtmbox.c @ 158]
002ef854 748519d0 msvcr90!_NMSG_WRITE+0x16f [f:ddvctoolscrt_bldself_x86crtsrccrt0msg.c @ 242]
002ef85c 001647bb msvcr90!_purecall+0x19 [f:ddvctoolscrt_bldself_x86crtsrcpurevirt.c @ 56]
002ef878 00169745 MFCCrash!CMFCCrashApp::CMFCCrashApp+0x6b [d:codesmfccrashmfccrashmfccrash.cpp @ 74]
002ef87c 74802201 MFCCrash!`dynamic initializer for 'theApp''+0x5 [d:codesmfccrashmfccrashmfccrash.cpp @ 82]
002ef888 00167e55 msvcr90!_initterm+0x13 [f:ddvctoolscrt_bldself_x86crtsrccrt0dat.c @ 903]
002ef914 76843677 MFCCrash!__tmainCRTStartup+0xc0 [f:ddvctoolscrt_bldself_x86crtsrccrtexe.c @ 501]
002ef920 77339d42 kernel32!BaseThreadInitThunk+0xe
002ef960 77339d15 ntdll_77300000!__RtlUserThreadStart+0x70
002ef978 00000000 ntdll_77300000!_RtlUserThreadStart+0x1b](https://image.slidesharecdn.com/crashdumpanalysisexperiencesharing-130110101204-phpapp01/85/Crash-dump-analysis-experience-sharing-35-320.jpg)
![Step 6&7 Find crash point and map to source code (3/3)
Map to source code
0:012> lmD /* list modules */
start end module name
012f0000 01445000 MLEngine T (private pdb symbols) C:Program Files (x86)Debugging Tools for Windows (x86)
symMLEngine.pdb4EC89C52E43647339825CF2D6F9D73F91MLEngine.pdb
10100000 1010e000 lgscroll T (no symbols)
....
0:012> k 200 /* dump stack 200 level */
*** Stack trace for last set context - .thread/.cxr resets it
ChildEBP RetAddr
049ff528 00d6643c MLEngine!boost::filesystem::detail::first_element<std::basic_string<wchar_t,std::char_traits<wchar_t>,std::
allocator<wchar_t> >,boost::filesystem::wpath_traits>+0x53 [e:usrcomsdk-mle2p4sdkmle2boost_1_42_0boostfilesystempath.
hpp @ 828]
049ff57c 00d6635a MLEngine!boost::filesystem::basic_path<std::basic_string<wchar_t,std::char_traits<wchar_t>,std::
allocator<wchar_t>
...
MLEngine!std::_Tree<std::_Tmap_traits<boost::filesystem::basic_path<std::basic_string<wchar_t,std::char_traits<wchar_t>,
std::allocator<wchar_t> >,boost::filesystem::wpath_traits>,void *,std::less<boost::filesystem::basic_path<std::basic_string<wchar_t,
std::char_traits<wchar_t>,std::allocator<wchar_t> >,boost::filesystem::wpath_traits> >,std::allocator<std::pair<boost::filesystem::
basic_path<std::basic_string<wchar_t,std::char_traits<wchar_t>,std::allocator<wchar_t> >,boost::filesystem::wpath_traits> const ,void
*> >,0> >::_Eqrange+0x2b [c:program filesmicrosoft visual studio 9.0vcincludextree @ 1138]
049ff70c 00e130c0 MLEngine!MLEngine::CFolderWatcher::MonitorThread+0x5ba [e:usrcomsdk-
mle2p4sdkmle2mainmlenginefolderwatcher.cpp @ 344]
049ff79c 765b33ca MLEngine!DOL::DSystem::DThreads::DThreadCallback::ThreadFunction+0x10 [e:usrcomsdk-
mle2p4shared2libsl_dolsourcedoldsystemdthreadsdthreadcallback.cpp @ 51]
049ff7a8 77c69ed2 kernel32!BaseThreadInitThunk+0xe
049ff7e8 77c69ea5 ntdll!__RtlUserThreadStart+0x70
049ff800 00000000 ntdll!_RtlUserThreadStart+0x1b](https://image.slidesharecdn.com/crashdumpanalysisexperiencesharing-130110101204-phpapp01/85/Crash-dump-analysis-experience-sharing-39-320.jpg)
![Case Study - A cross apartment COM crash
0:000> k 200 /* dump stack of caller thread */
ChildEBP RetAddr
0034f1f0 75420962 ntdll!ZwWaitForMultipleObjects+0x15
...
0034f354 74b236a5 ole32!CCliModalLoop::BlockFn+0xa1
0034f37c 74b1daa0 ole32!ModalLoop+0x5b
0034f38c 74c3a91b ole32!SwitchSTA+0x21
...
0034f5a4 755a414b ole32!NdrExtpProxySendReceive+0x49
0034f5b0 75620149 RPCRT4!NdrpProxySendReceive+0xe
0034f9c4 74c3ba02 RPCRT4!NdrClientCall2+0x1a6
0034f9e4 74b2c95d ole32!ObjectStublessClient+0xa2
0034f9f4 001f1060 ole32!ObjectStubless+0xf
0034fa10 001f120f COMClient!wmain+0x60 [d:codesproblemcomcomclientcomclient.cpp @ 16]
0034fa54 76843677 COMClient!__tmainCRTStartup+0x10f [f:ddvctoolscrt_bldself_x86crtsrccrtexe.c @ 583]
0034fa60 77339d42 kernel32!BaseThreadInitThunk+0xe
0034faa0 77339d15 ntdll!__RtlUserThreadStart+0x70
0034fab8 00000000 ntdll!_RtlUserThreadStart+0x1b
0:006> k 200 /* dump stack of callee thread */
ChildEBP RetAddr
026ff3f0 755a586c ProblemCOM!CCrashCOM::Crash+0x2 [d:codesproblemcomproblemcomcrashcom.cpp @ 13]
026ff408 756205f1 RPCRT4!Invoke+0x2a
026ff80c 74c3b23c RPCRT4!NdrStubCall2+0x2ea
026ff854 7508ffd3 ole32!CStdStubBuffer_Invoke+0x3c
026ff878 74c3d9c6 OLEAUT32!CUnivStubWrapper::Invoke+0xcb
026ff8c0 74c3df1f ole32!SyncStubInvoke+0x3c
...
026ffb7c 76843677 ole32!CRpcThreadCache::RpcWorkerThreadEntry+0x16
026ffb88 77339d42 kernel32!BaseThreadInitThunk+0xe
026ffbc8 77339d15 ntdll!__RtlUserThreadStart+0x70
026ffbe0 00000000 ntdll!_RtlUserThreadStart+0x1b](https://image.slidesharecdn.com/crashdumpanalysisexperiencesharing-130110101204-phpapp01/85/Crash-dump-analysis-experience-sharing-42-320.jpg)
![Case Study - Thread safety problem
Thread safety problem causes
● Unexpected state (race condition)
● Strange behavior
Crash is not inevitable result for thread safety problem. However, dump
is a state snapshot of crashed program. It can provide clues.
0:012> k 200
*** Stack trace for last set context - .thread/.cxr resets it
ChildEBP RetAddr
049ff528 00d6643c
...
MLEngine!std::_Tree<std::_Tmap_traits<boost::filesystem::basic_path<std::basic_string<wchar_t,std::char_traits<wchar_t>
,std::allocator<wchar_t> >,boost::filesystem::wpath_traits>,void *,std::less<boost::filesystem::basic_path<std::basic_string<wchar_t,
std::char_traits<wchar_t>,std::allocator<wchar_t> >,boost::filesystem::wpath_traits> >,std::allocator<std::pair<boost::filesystem::
basic_path<std::basic_string<wchar_t,std::char_traits<wchar_t>,std::allocator<wchar_t> >,boost::filesystem::wpath_traits> const ,
void *> >,0> >::_Eqrange+0x2b [c:program filesmicrosoft visual studio 9.0vcincludextree @ 1138]
049ff70c 00e130c0 MLEngine!MLEngine::CFolderWatcher::MonitorThread+0x5ba [e:usrcomsdk-
mle2p4sdkmle2mainmlenginefolderwatcher.cpp @ 344]
049ff79c 765b33ca MLEngine!DOL::DSystem::DThreads::DThreadCallback::ThreadFunction+0x10 [e:usrcomsdk-
mle2p4shared2libsl_dolsourcedoldsystemdthreadsdthreadcallback.cpp @ 51]
049ff7a8 77c69ed2 kernel32!BaseThreadInitThunk+0xe
049ff7e8 77c69ea5 ntdll!__RtlUserThreadStart+0x70
049ff800 00000000 ntdll!_RtlUserThreadStart+0x1b](https://image.slidesharecdn.com/crashdumpanalysisexperiencesharing-130110101204-phpapp01/85/Crash-dump-analysis-experience-sharing-43-320.jpg)
![Case Study - SQLite Exception (1)
EXCEPTION_RECORD: ffffffff -- (.exr 0xffffffffffffffff)
ExceptionAddress: 75c19617 (KERNELBASE!RaiseException+0x00000058)
ExceptionCode: e06d7363 (C++ EH exception)
ExceptionFlags: 00000001
NumberParameters: 3 The initial "E" standing for "exception"
Parameter[0]: 19930520 The final 3 bytes (0x6D7363) representing the
Parameter[1]: 02f5d964 ASCII values of "msc"
Parameter[2]: 00f55828
...
0:010> k /* dump the call stack */
*** Stack trace for last set context - .thread/.cxr resets it
ChildEBP RetAddr
02f5d914 720cdbf9 KERNELBASE!RaiseException+0x58
02f5d94c 00f3982a msvcr90!_CxxThrowException+0x48
02f5d99c 00f3a197 FaceEngine!sqlite3pp::statement::statement+0x8a [e:usrcomsdk-
faceenginep4sdkfaceenginemainfaceenginesqlite3pp.cpp @ 186]
02f5d9b0 00f0bd92 FaceEngine!sqlite3pp::query::query+0x17 [e:usrcomsdk-
faceenginep4sdkfaceenginemainfaceenginesqlite3pp.cpp @ 452]
02f5de54 00f1bc3e FaceEngine!FaceDB::FaceDbAdapter::HasImage+0x132 [e:usrcomsdk-
faceenginep4sdkfaceenginemainfaceenginedbadapter.cpp @ 398]
02f5f9c8 00f37e8f FaceEngine!CThreadManager::MLE_MonitorTask+0x148e [e:usrcomsdk-
faceenginep4sdkfaceenginemainfaceenginethreadmanager.cpp @ 202]
02f5f9dc 00f37e40 FaceEngine!boost::_bi::list2<boost::_bi::value<ATL::CComPtr<IMediaLibraryClient> >,boost::_bi::
value<CFaceClientCore *> >::operator()<void (__cdecl*)(IMediaLibraryClient *,CFaceClientCore *),boost::_bi::list0>+0x3f [e:
usrcomsdk-faceenginep4sdkmle2boost_1_42_0boostbindbind.hpp @ 313]
...](https://image.slidesharecdn.com/crashdumpanalysisexperiencesharing-130110101204-phpapp01/85/Crash-dump-analysis-experience-sharing-45-320.jpg)
![Case Study - Exception 0xc015000f (1)
0:001> !analyze -v
FAULTING_IP:
ntdll!RtlDeactivateActivationContext+154
771e45c1 8b36 mov esi,dword ptr [esi]
EXCEPTION_RECORD: ffffffff -- (.exr 0xffffffffffffffff)
ExceptionAddress: 771e45c1 (ntdll!RtlDeactivateActivationContext+0x00000154)
ExceptionCode: c015000f
...
PROCESS_NAME: Corel PaintShop Photo Pro.exe
ERROR_CODE: (NTSTATUS) 0xc015000f - The activation context being deactivated is not the most recently activated one.
EXCEPTION_CODE: (NTSTATUS) 0xc015000f - The activation context being deactivated is not the most recently activated one.
...
ntdll!RtlDeactivateActivationContext+0x154
kernel32!DeactivateActCtx+0x31
mfc90u!AFX_MAINTAIN_STATE2::~AFX_MAINTAIN_STATE2+0x1c
mfc90u!AfxWndProcBase+0x66
user32!InternalCallWinProc+0x23
user32!UserCallWinProcCheckWow+0x109
user32!DispatchMessageWorker+0x3bc
user32!DispatchMessageW+0xf
mfc90u!AfxInternalPumpMessage+0x40
mfc90u!CWinThread::Run+0x5b
Corel_PaintShop_Photo_Pro!CPSPApp::Run+0x18](https://image.slidesharecdn.com/crashdumpanalysisexperiencesharing-130110101204-phpapp01/85/Crash-dump-analysis-experience-sharing-53-320.jpg)


![[OOP - Lec 19] Static Member Functions](https://cdn.slidesharecdn.com/ss_thumbnails/lecture-19staticmemberfunctions-160705095235-thumbnail.jpg?width=640&height=640&fit=bounds)