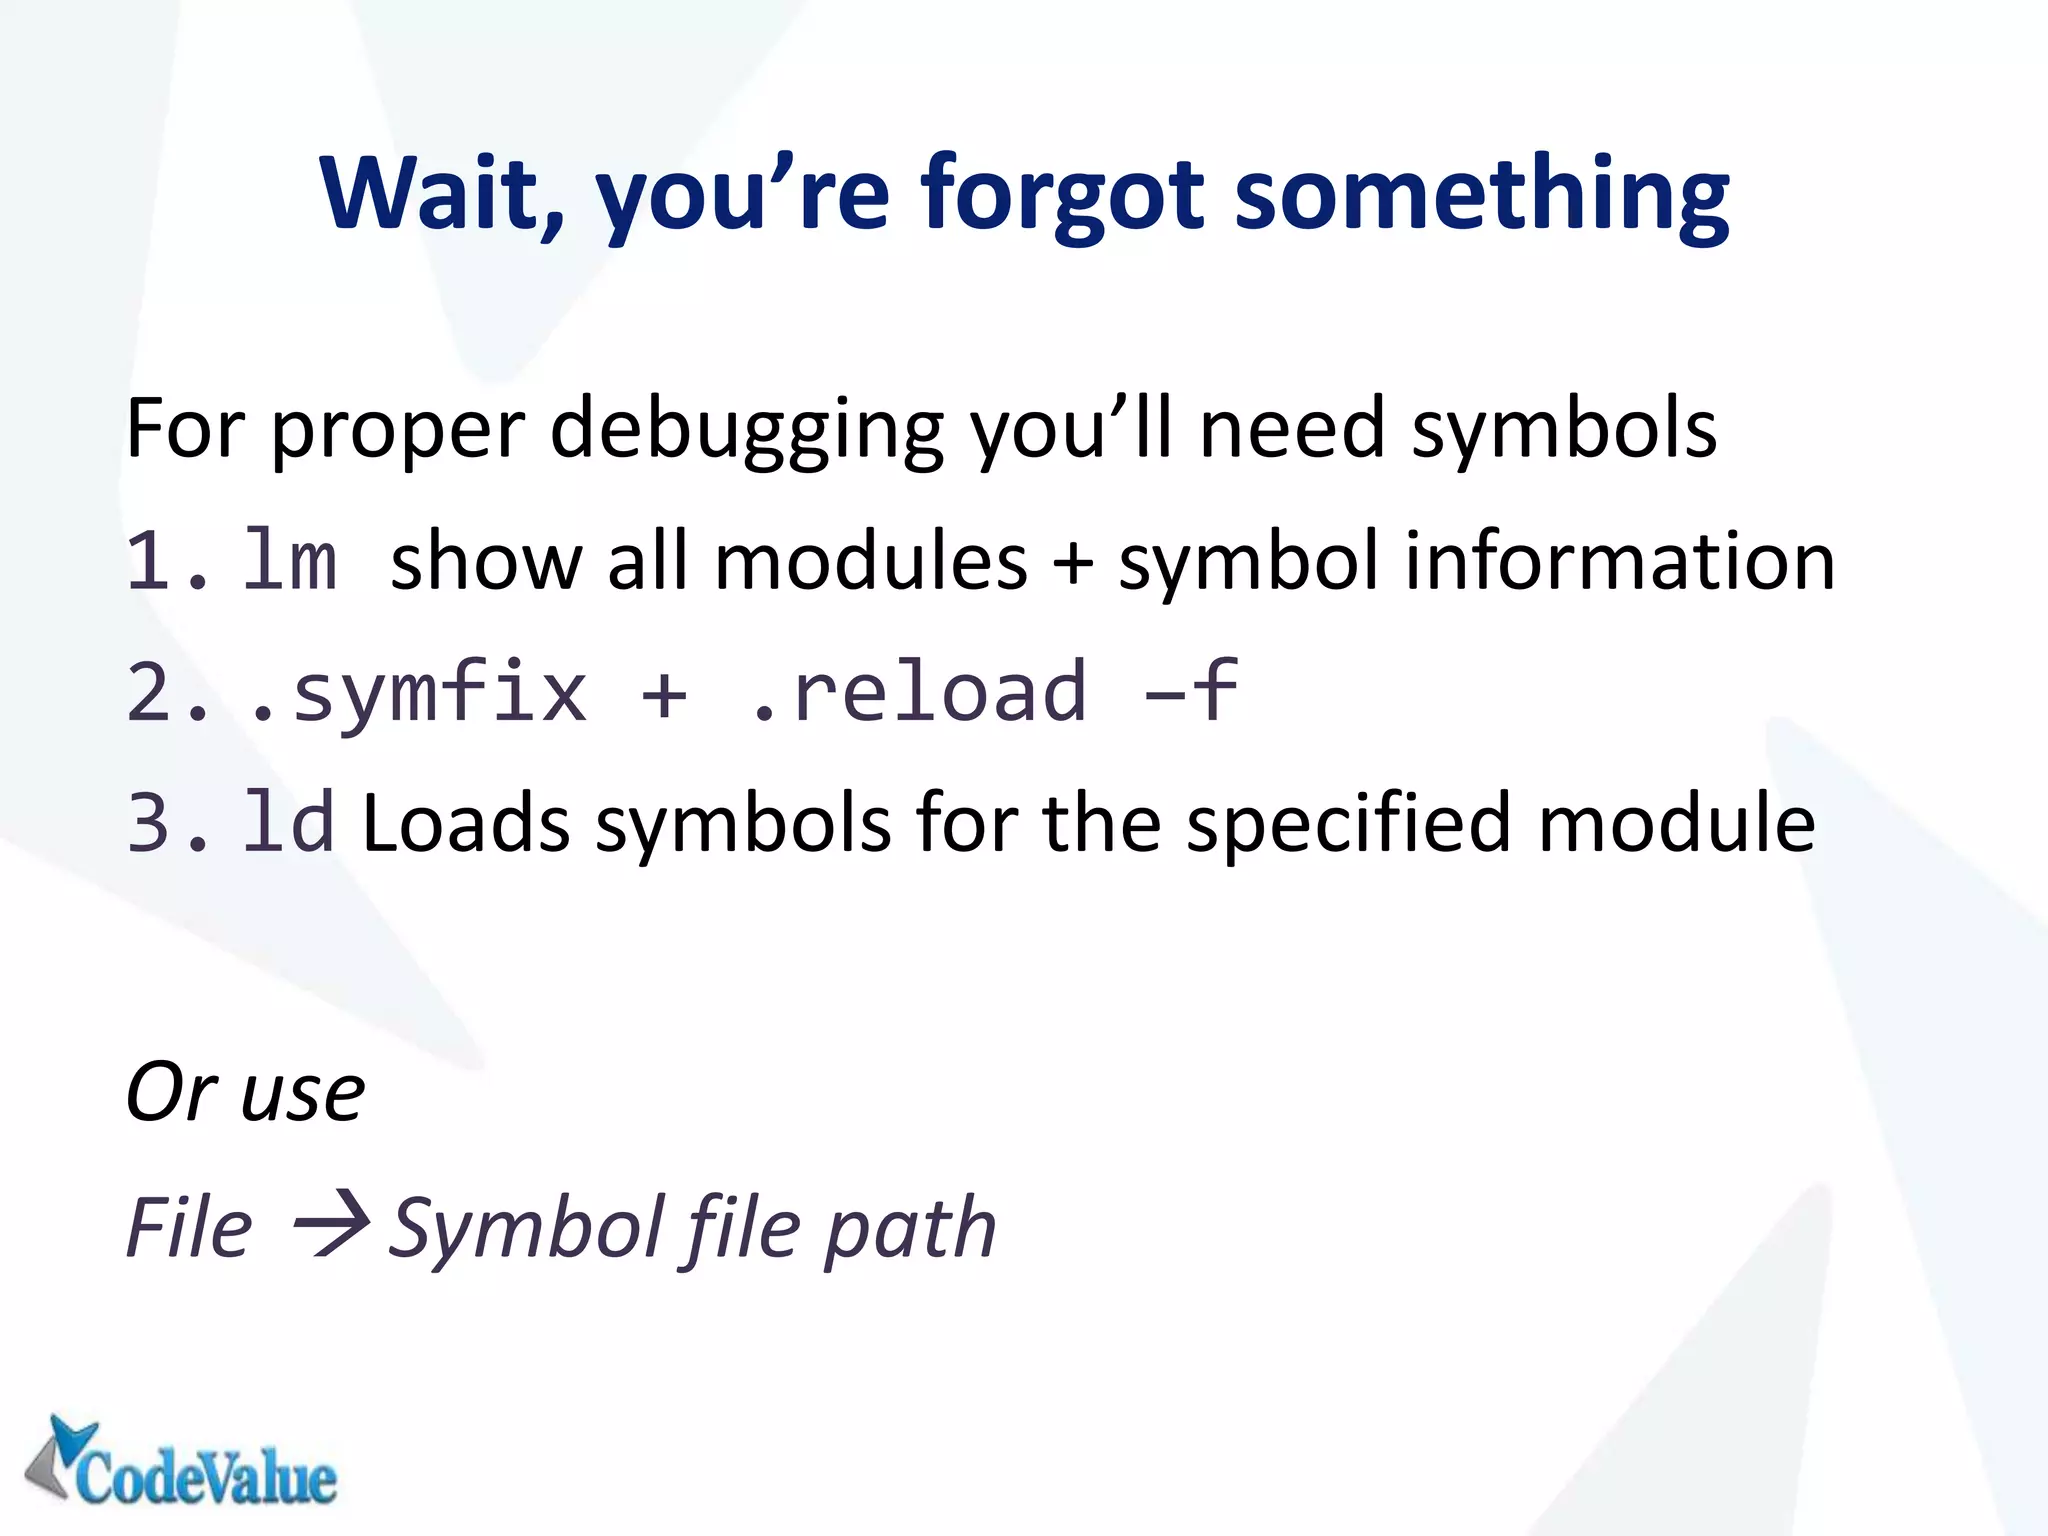
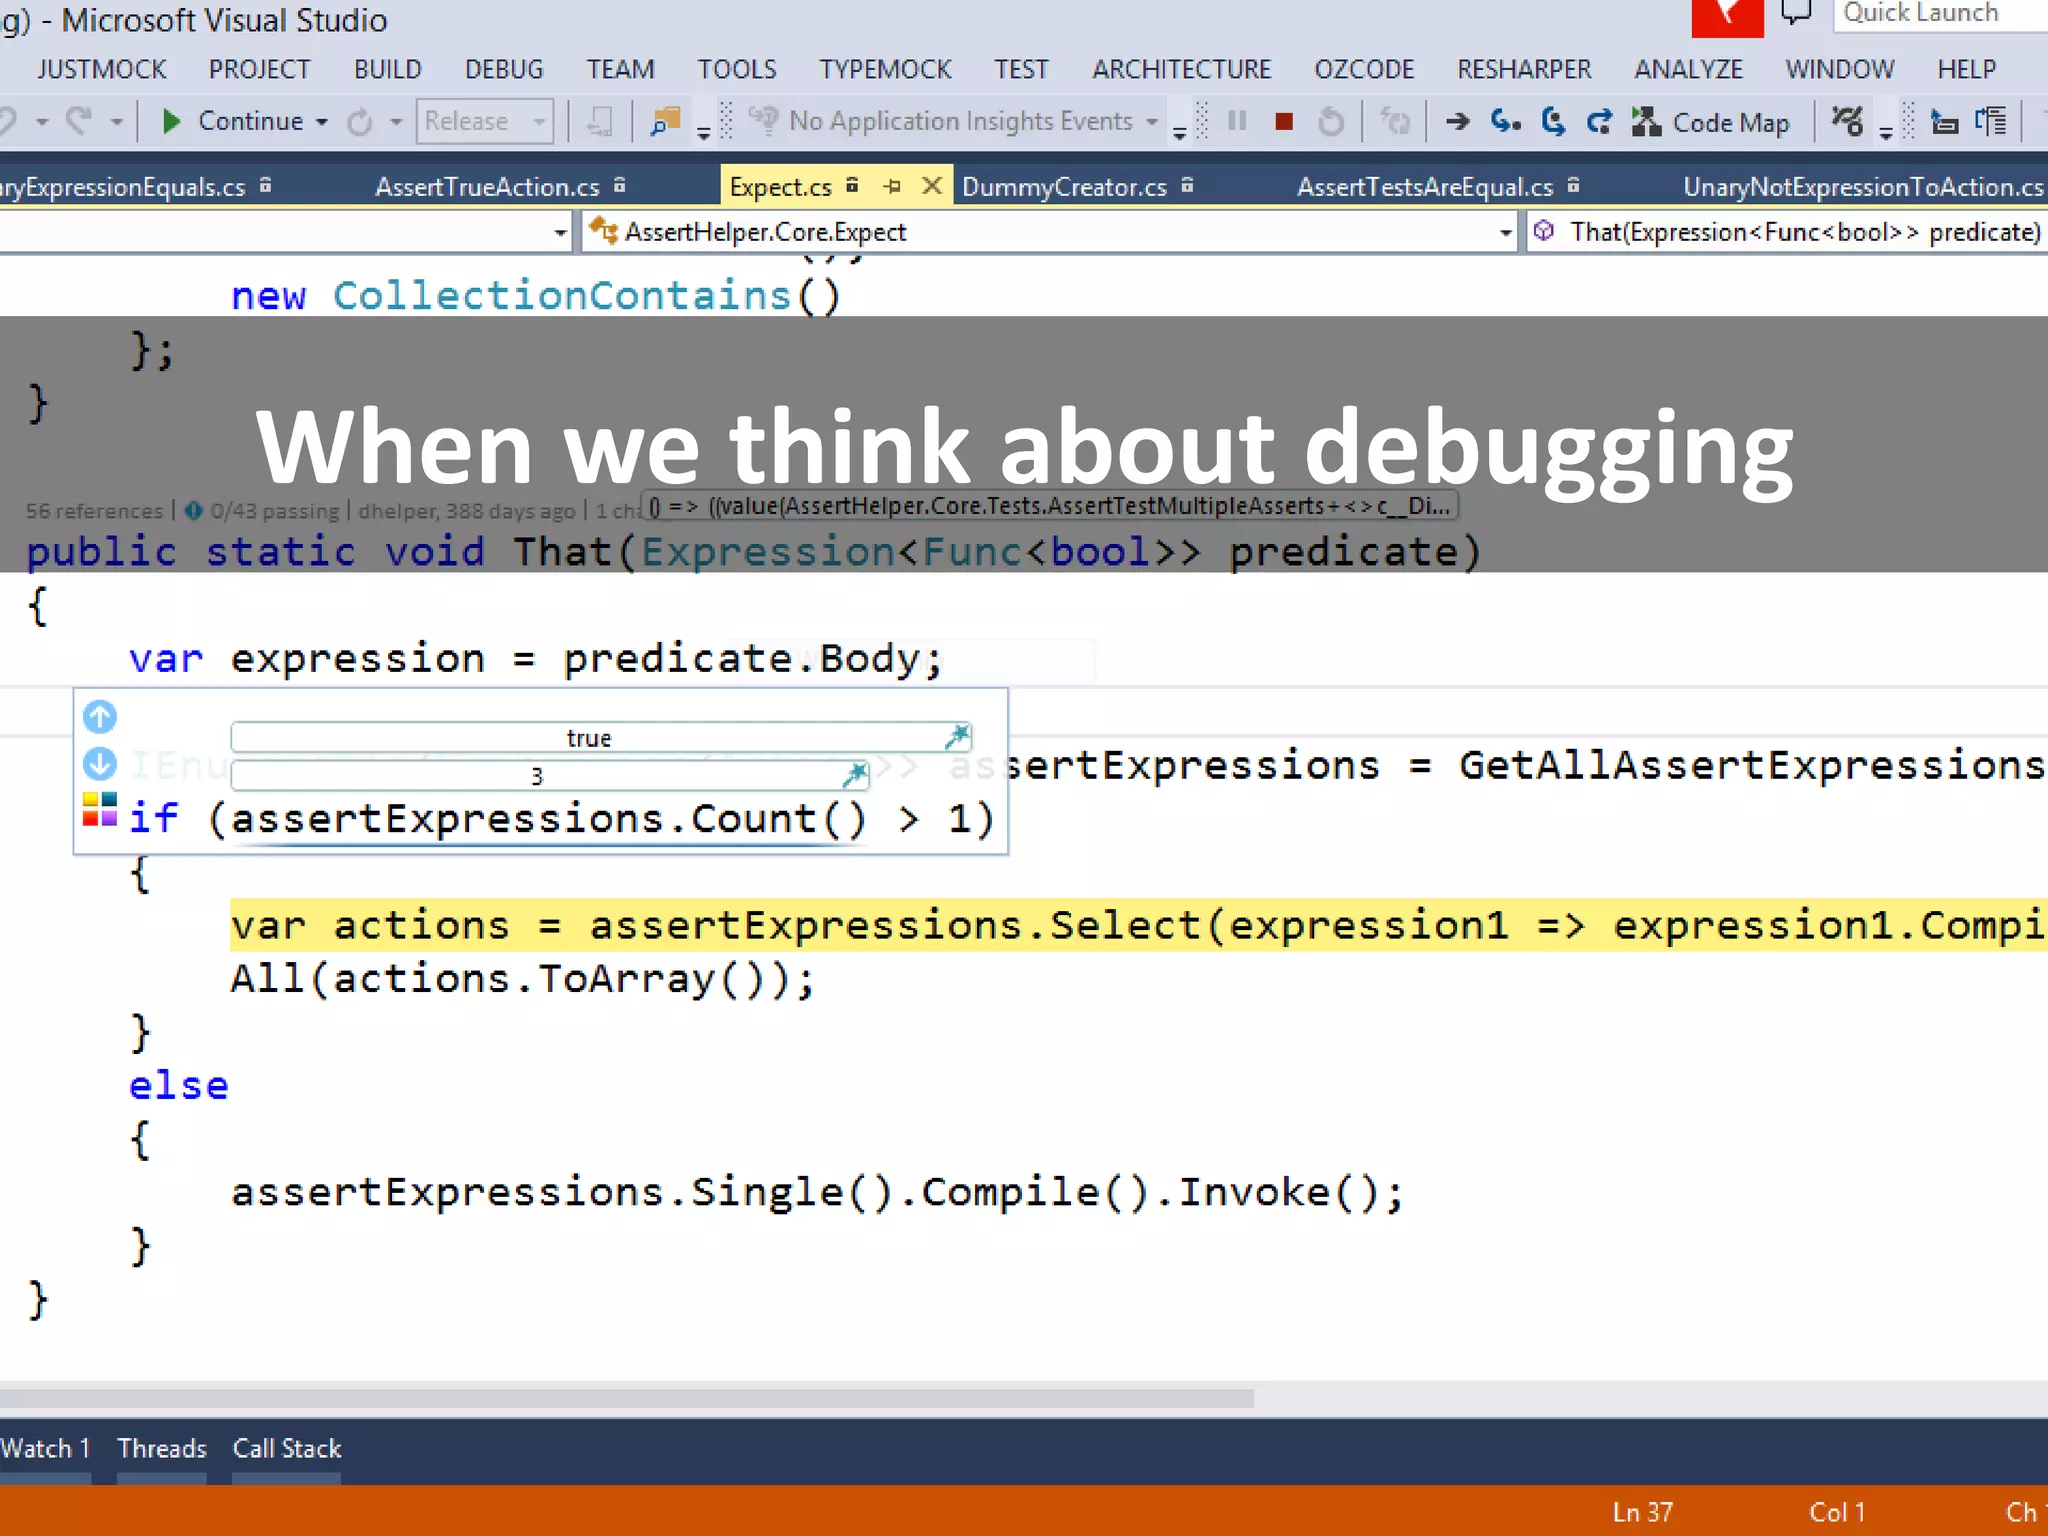
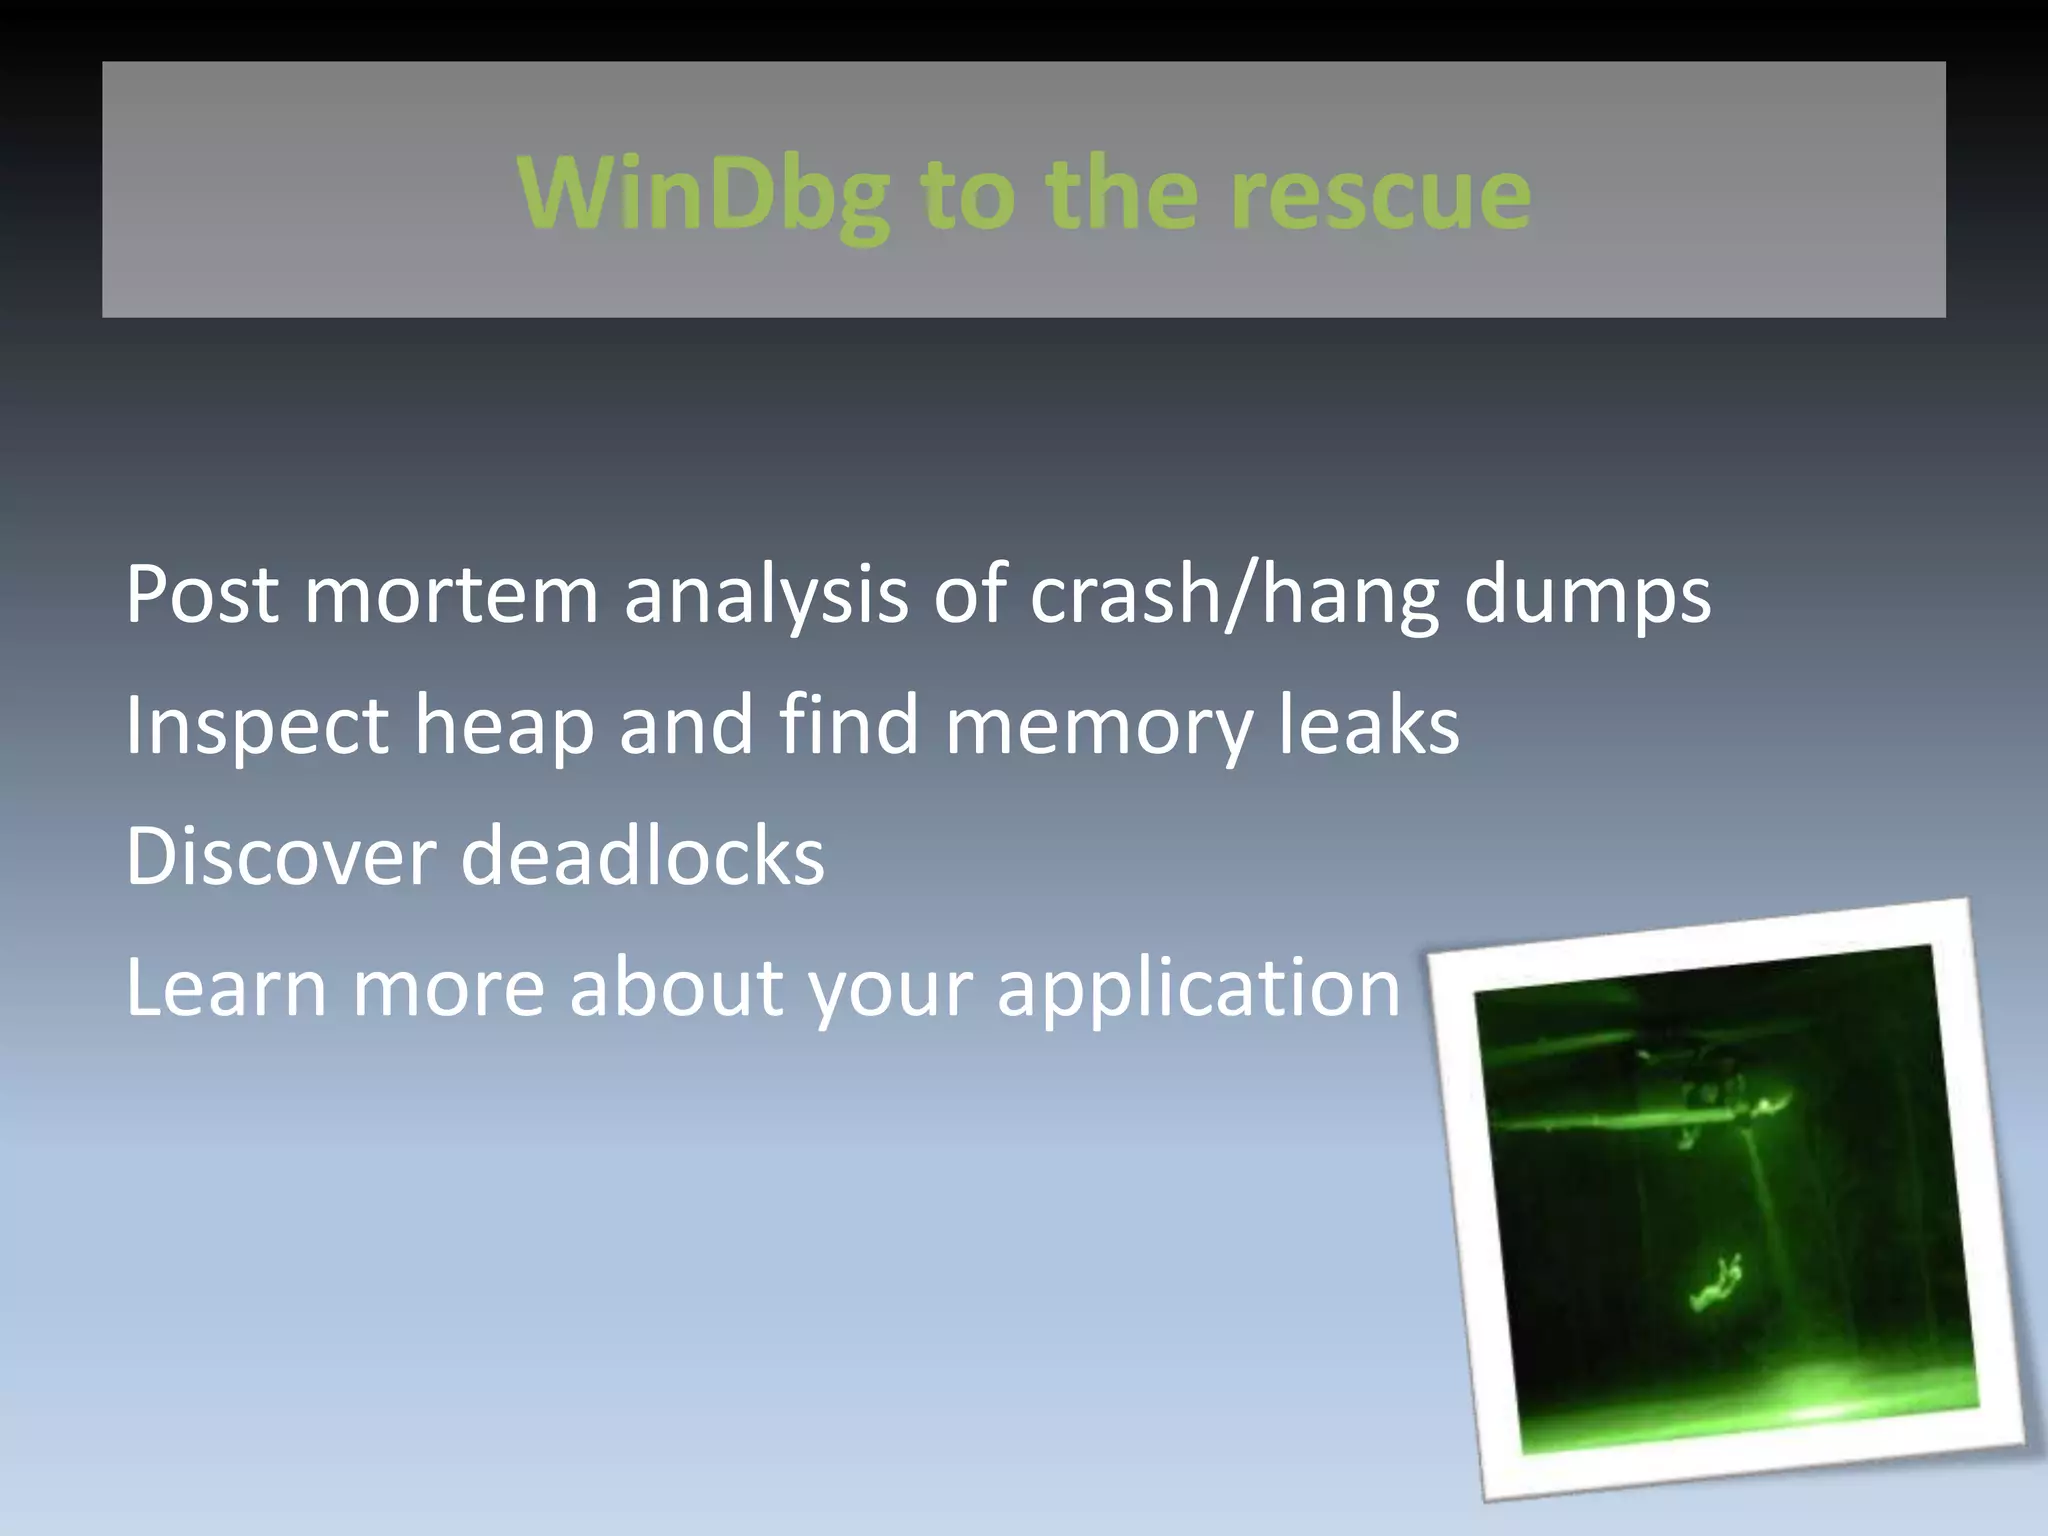
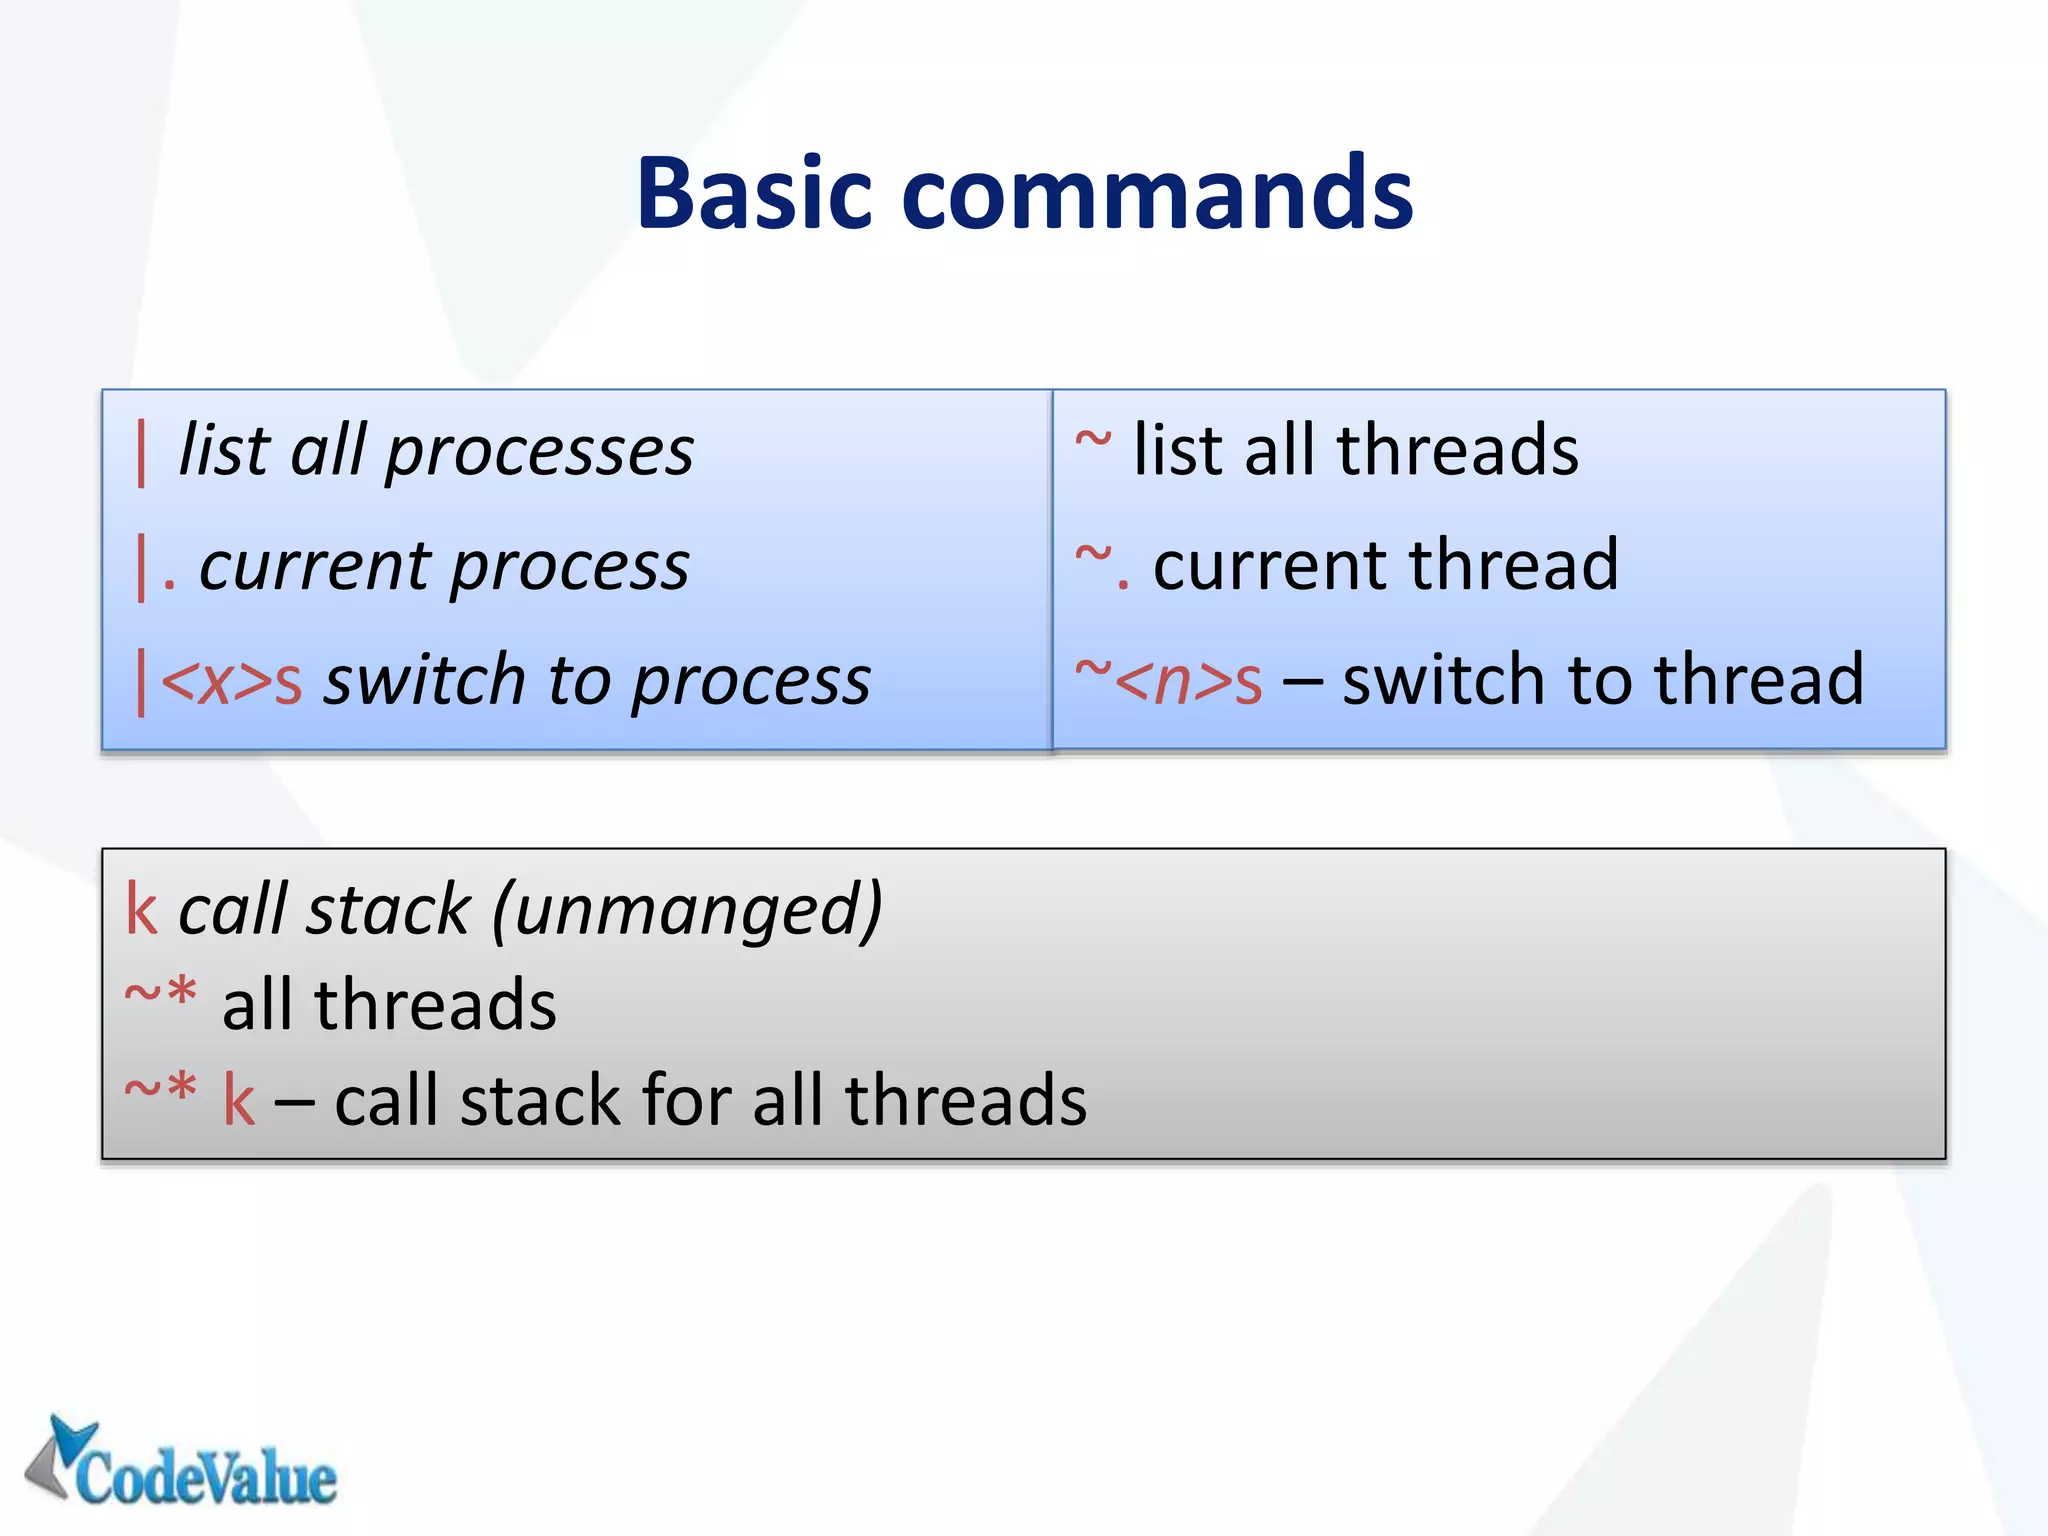
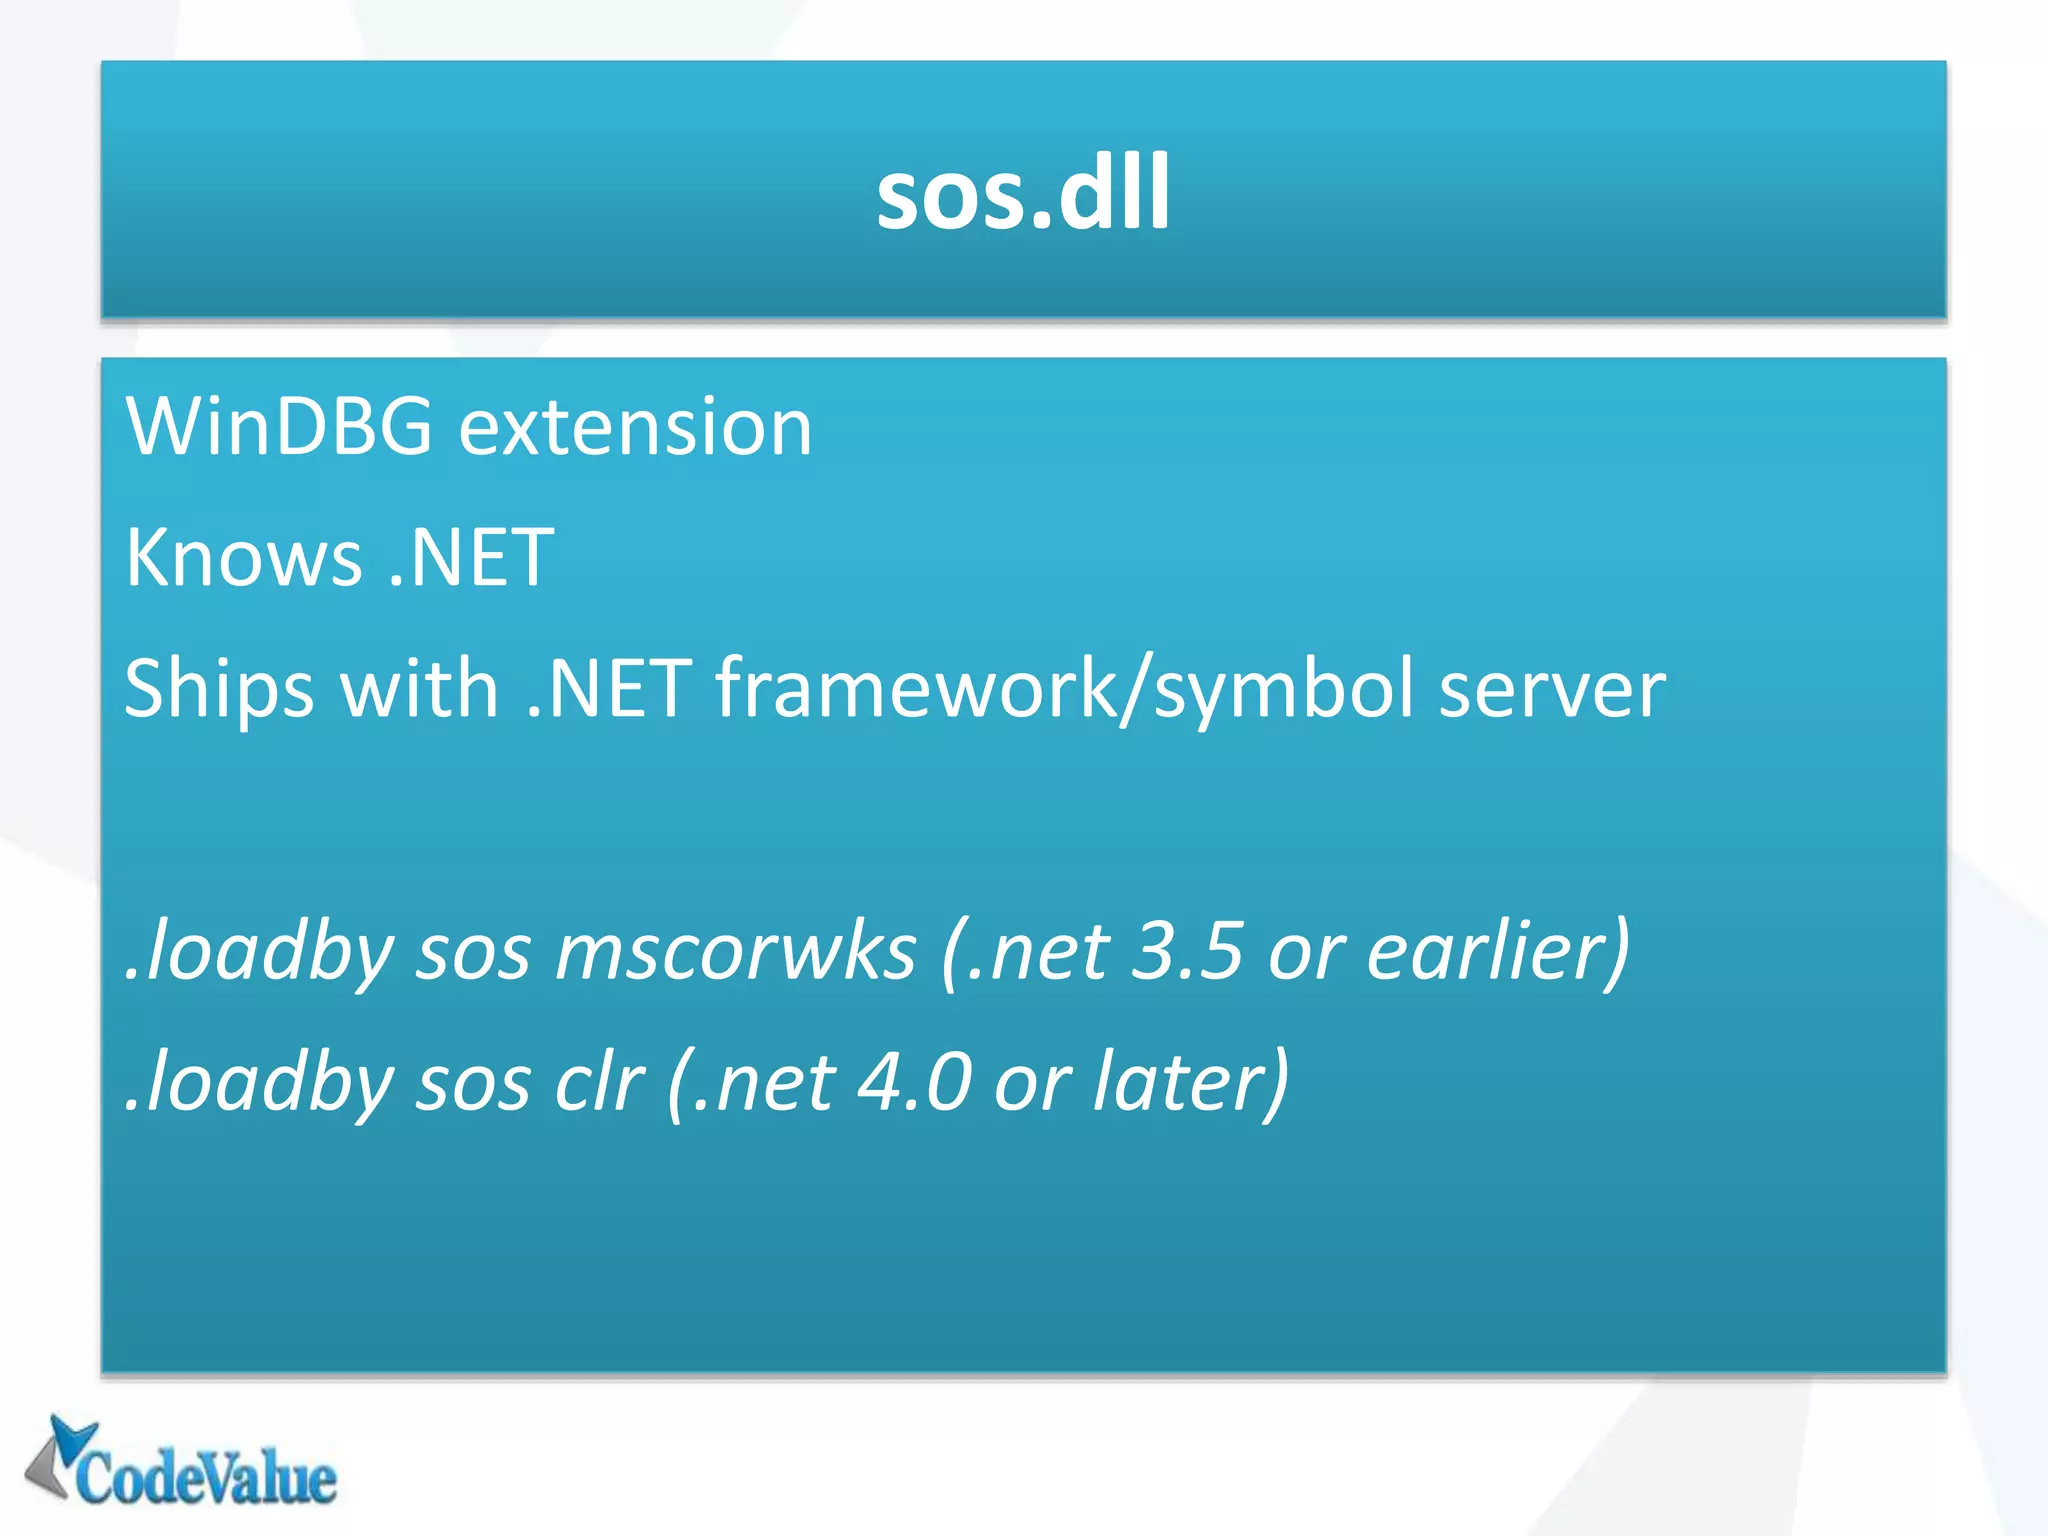
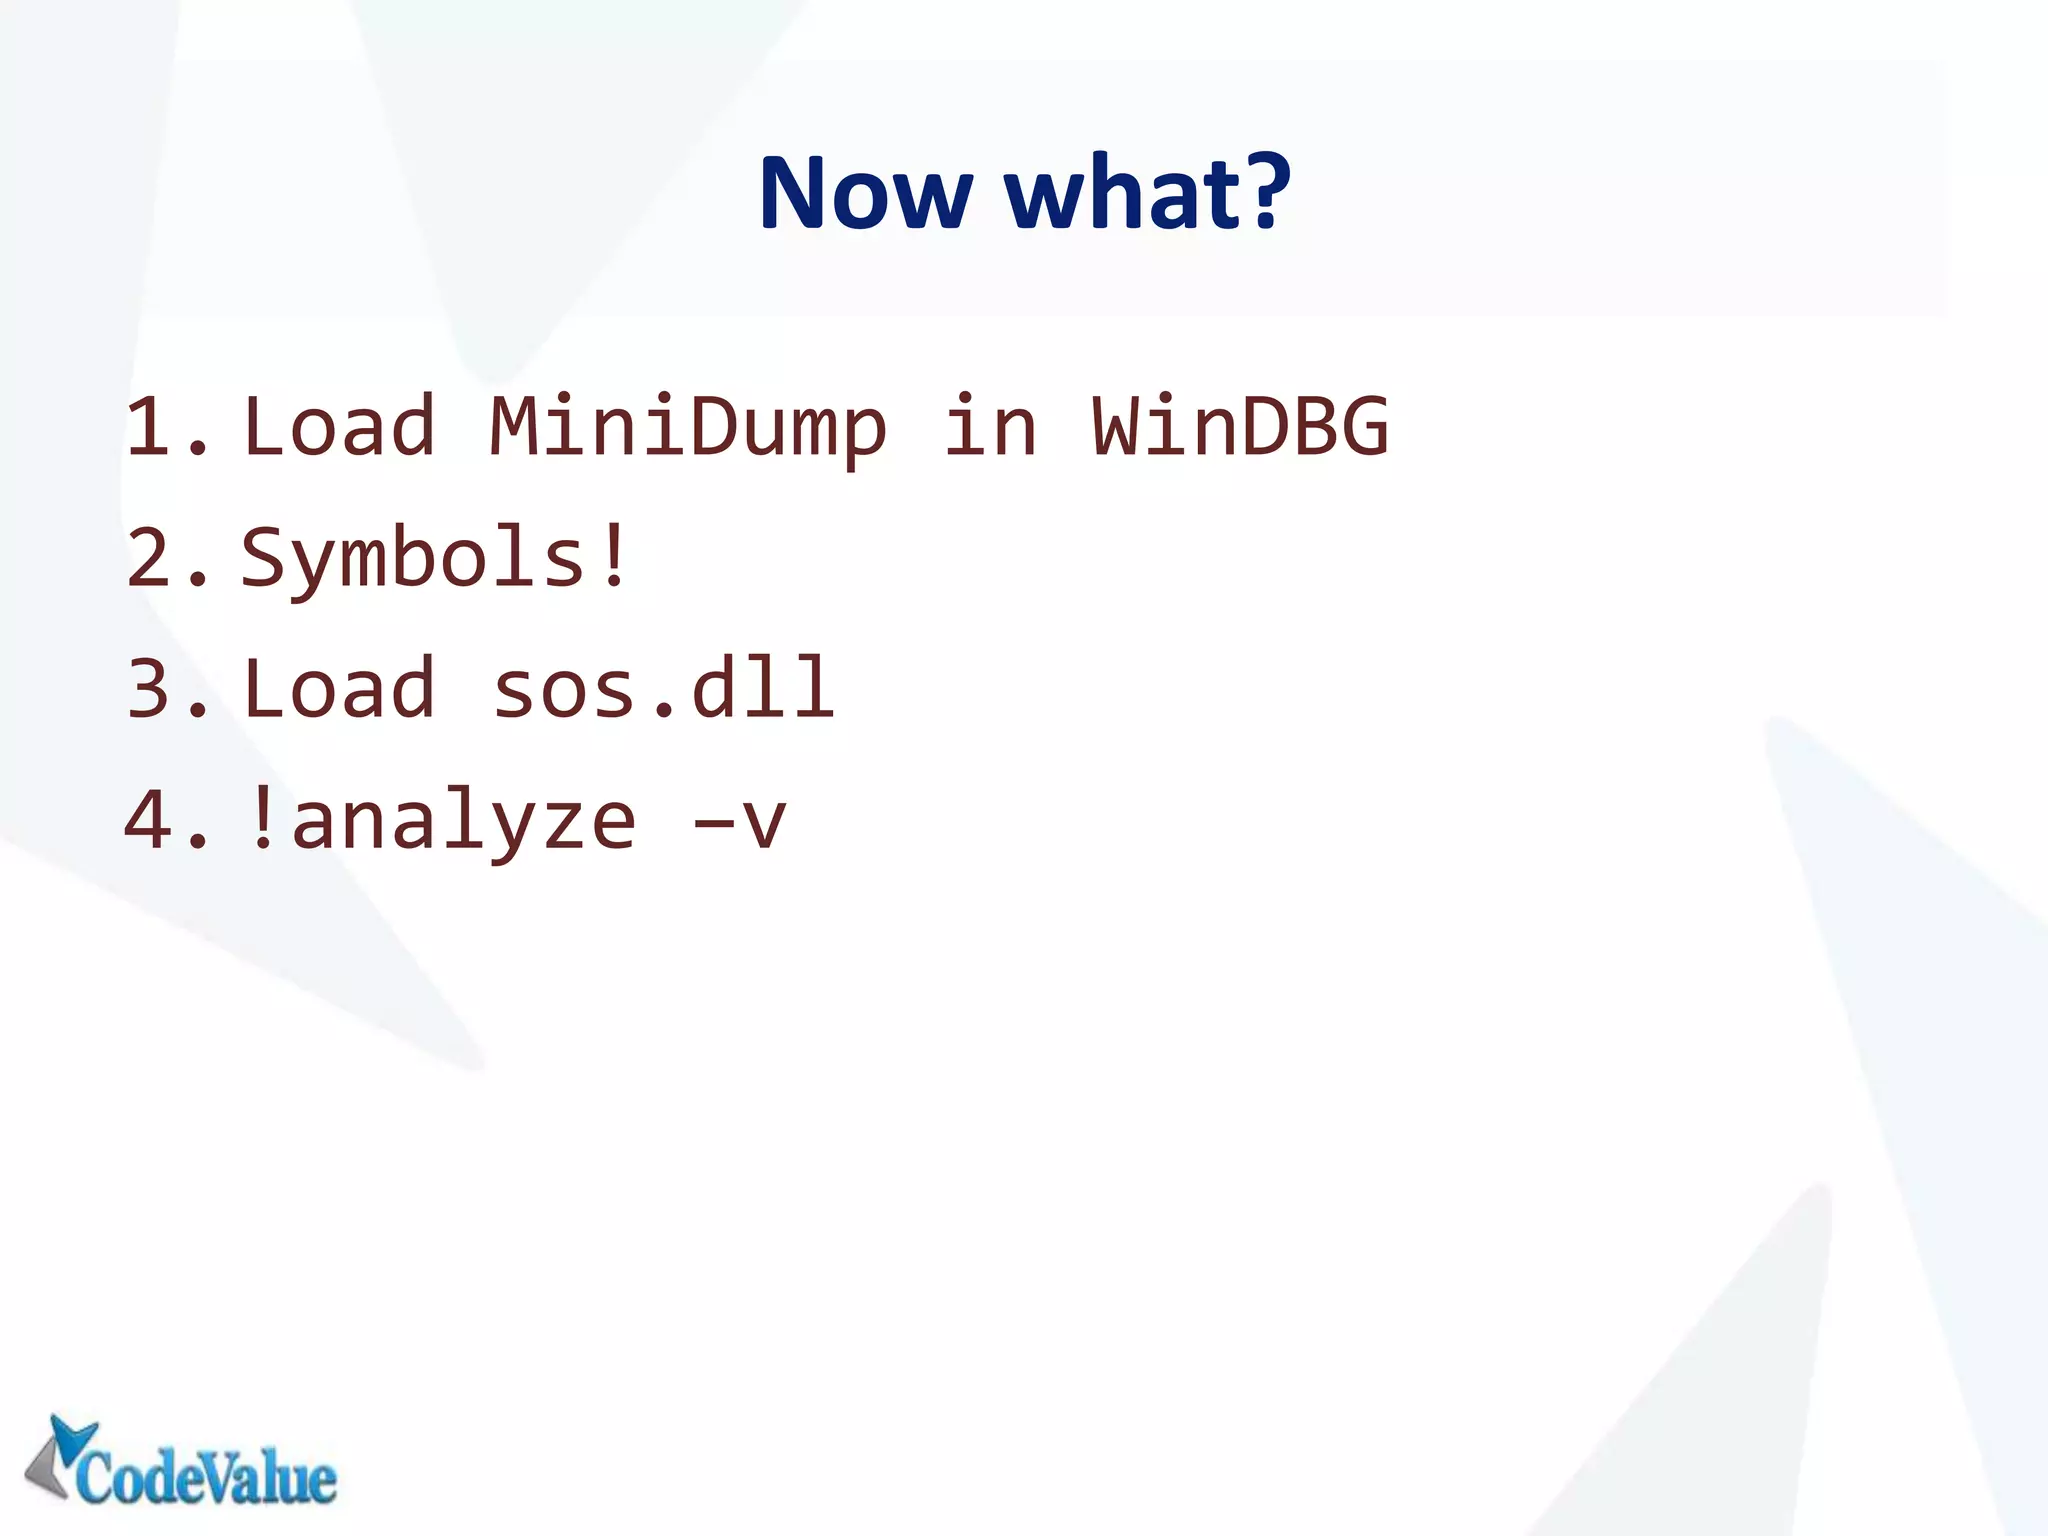
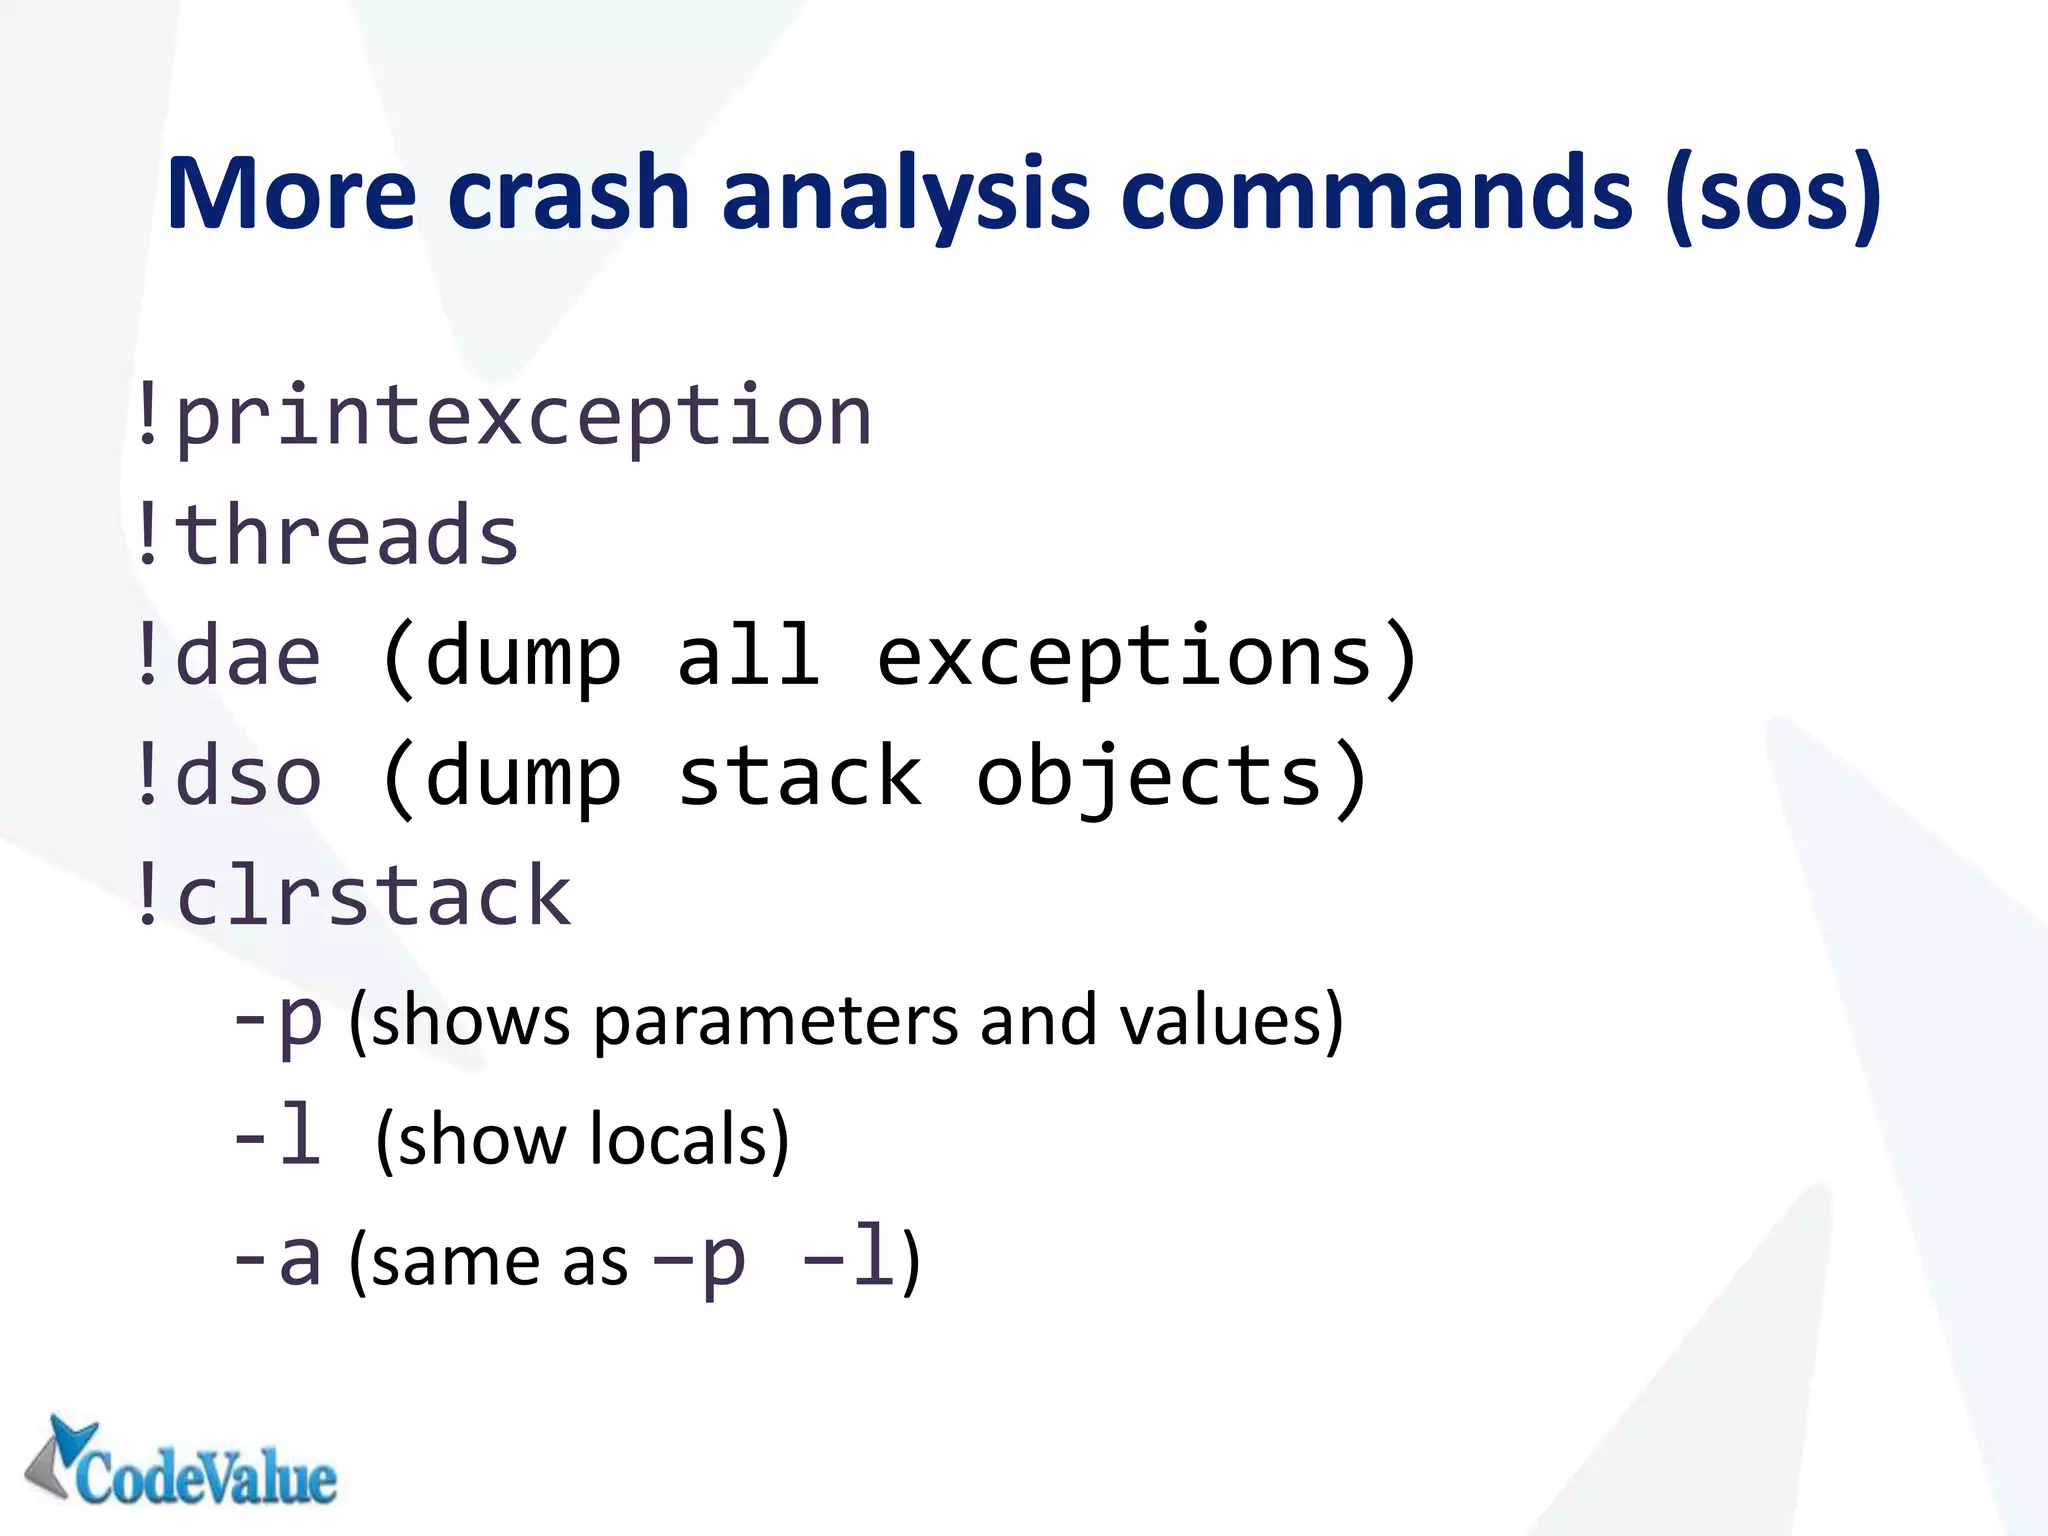
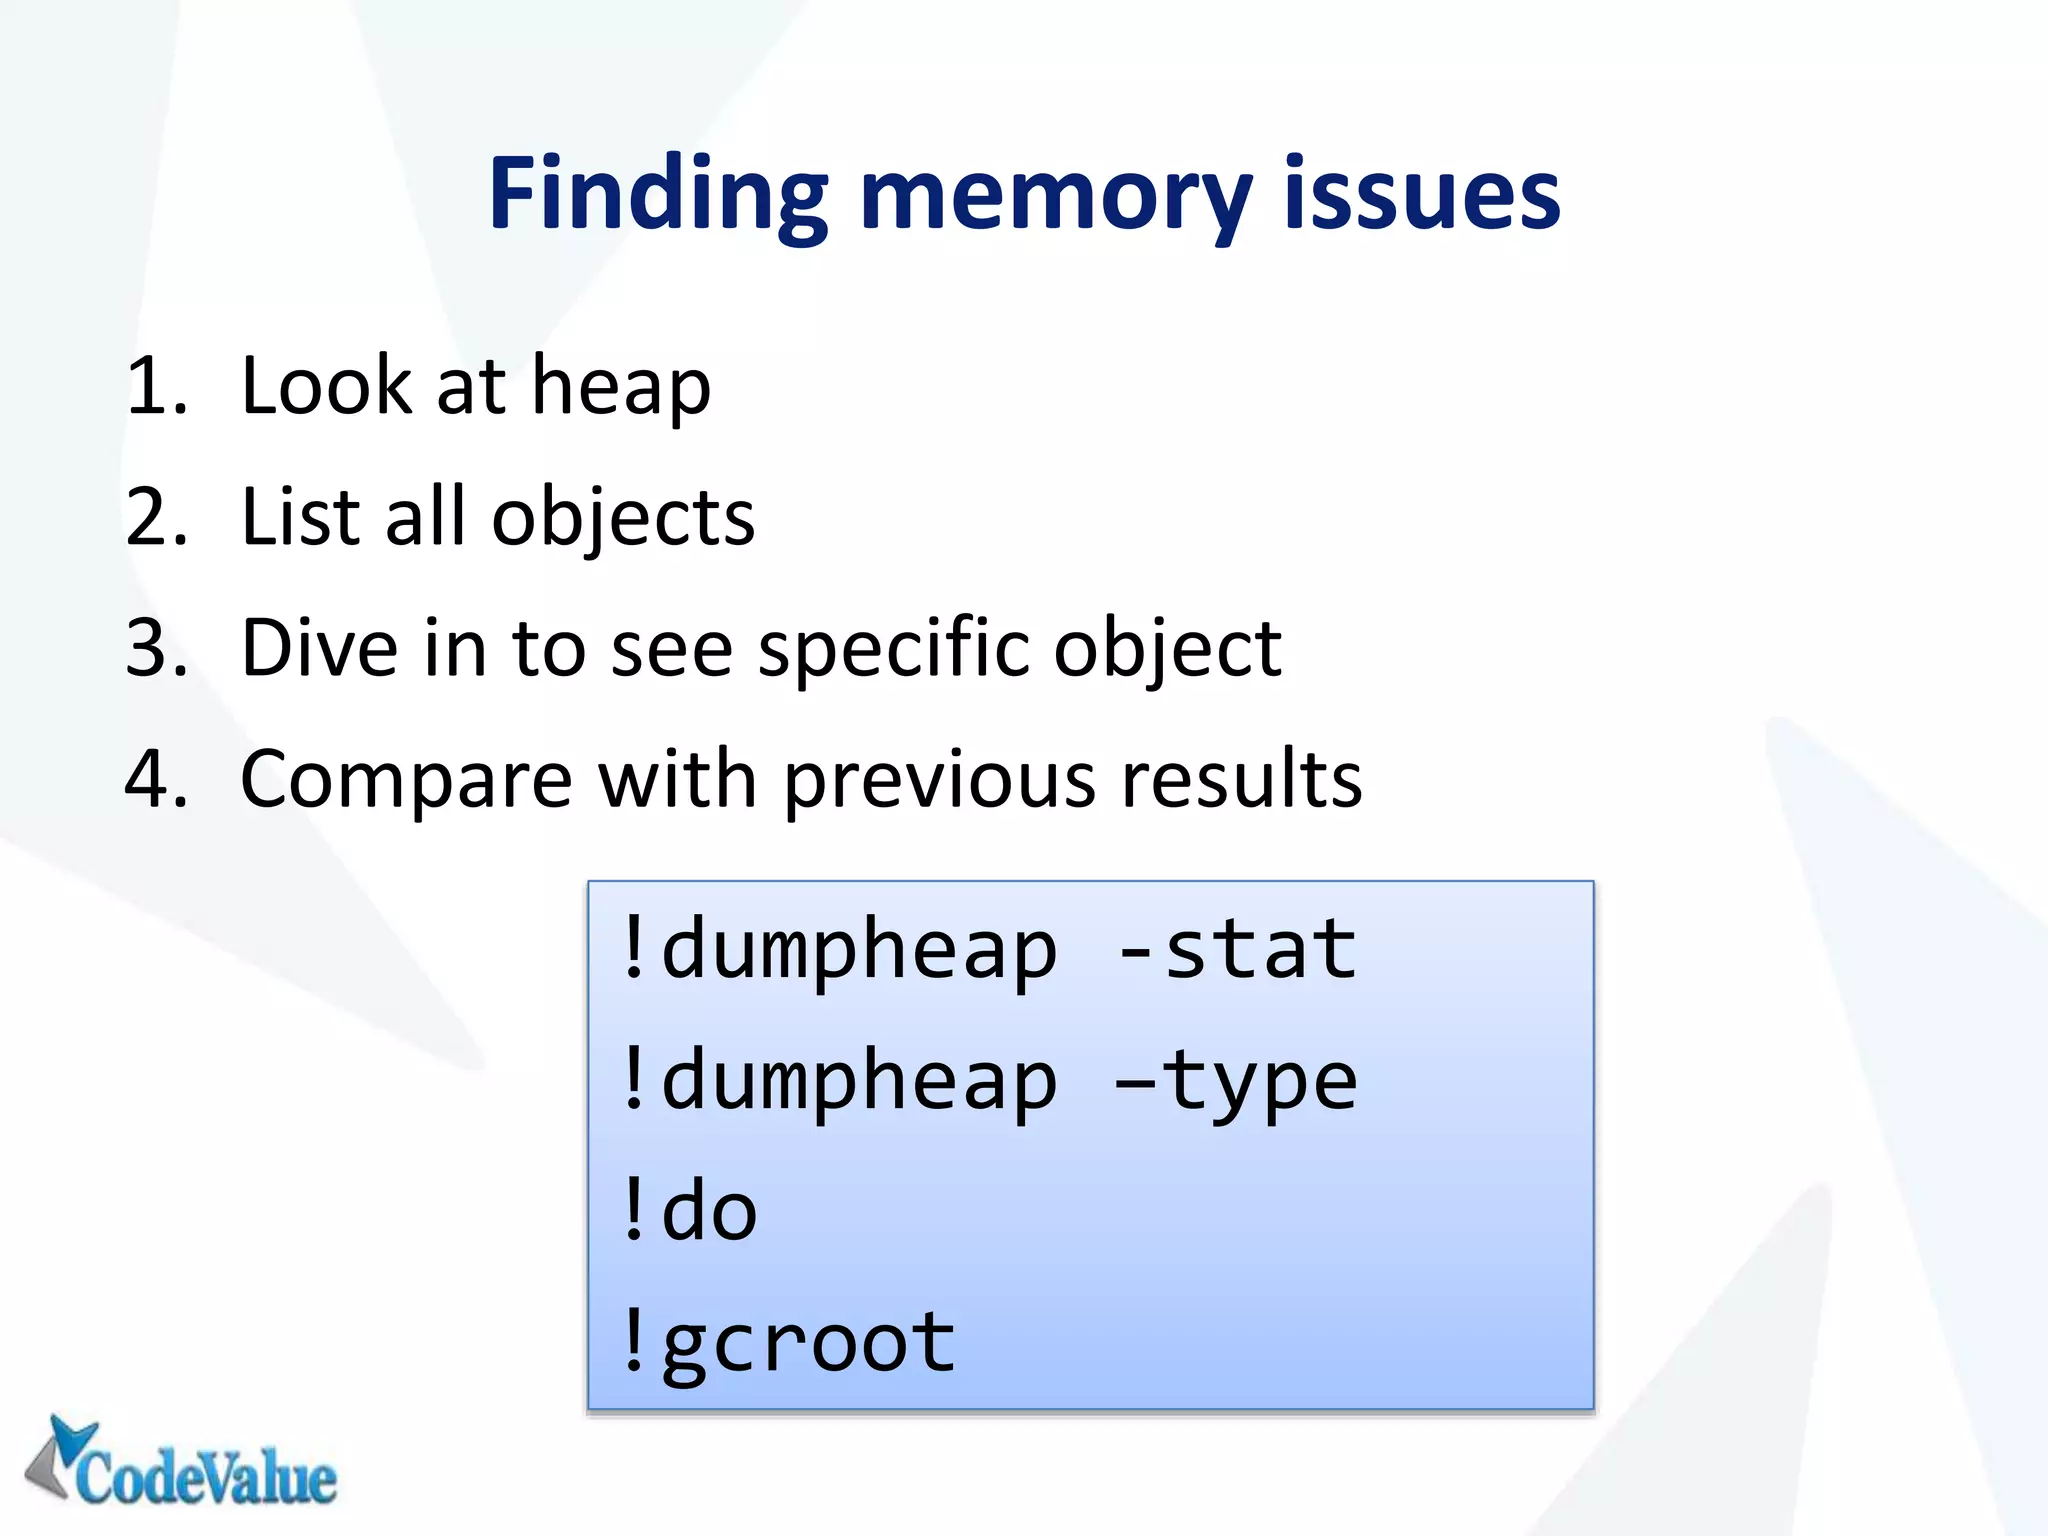
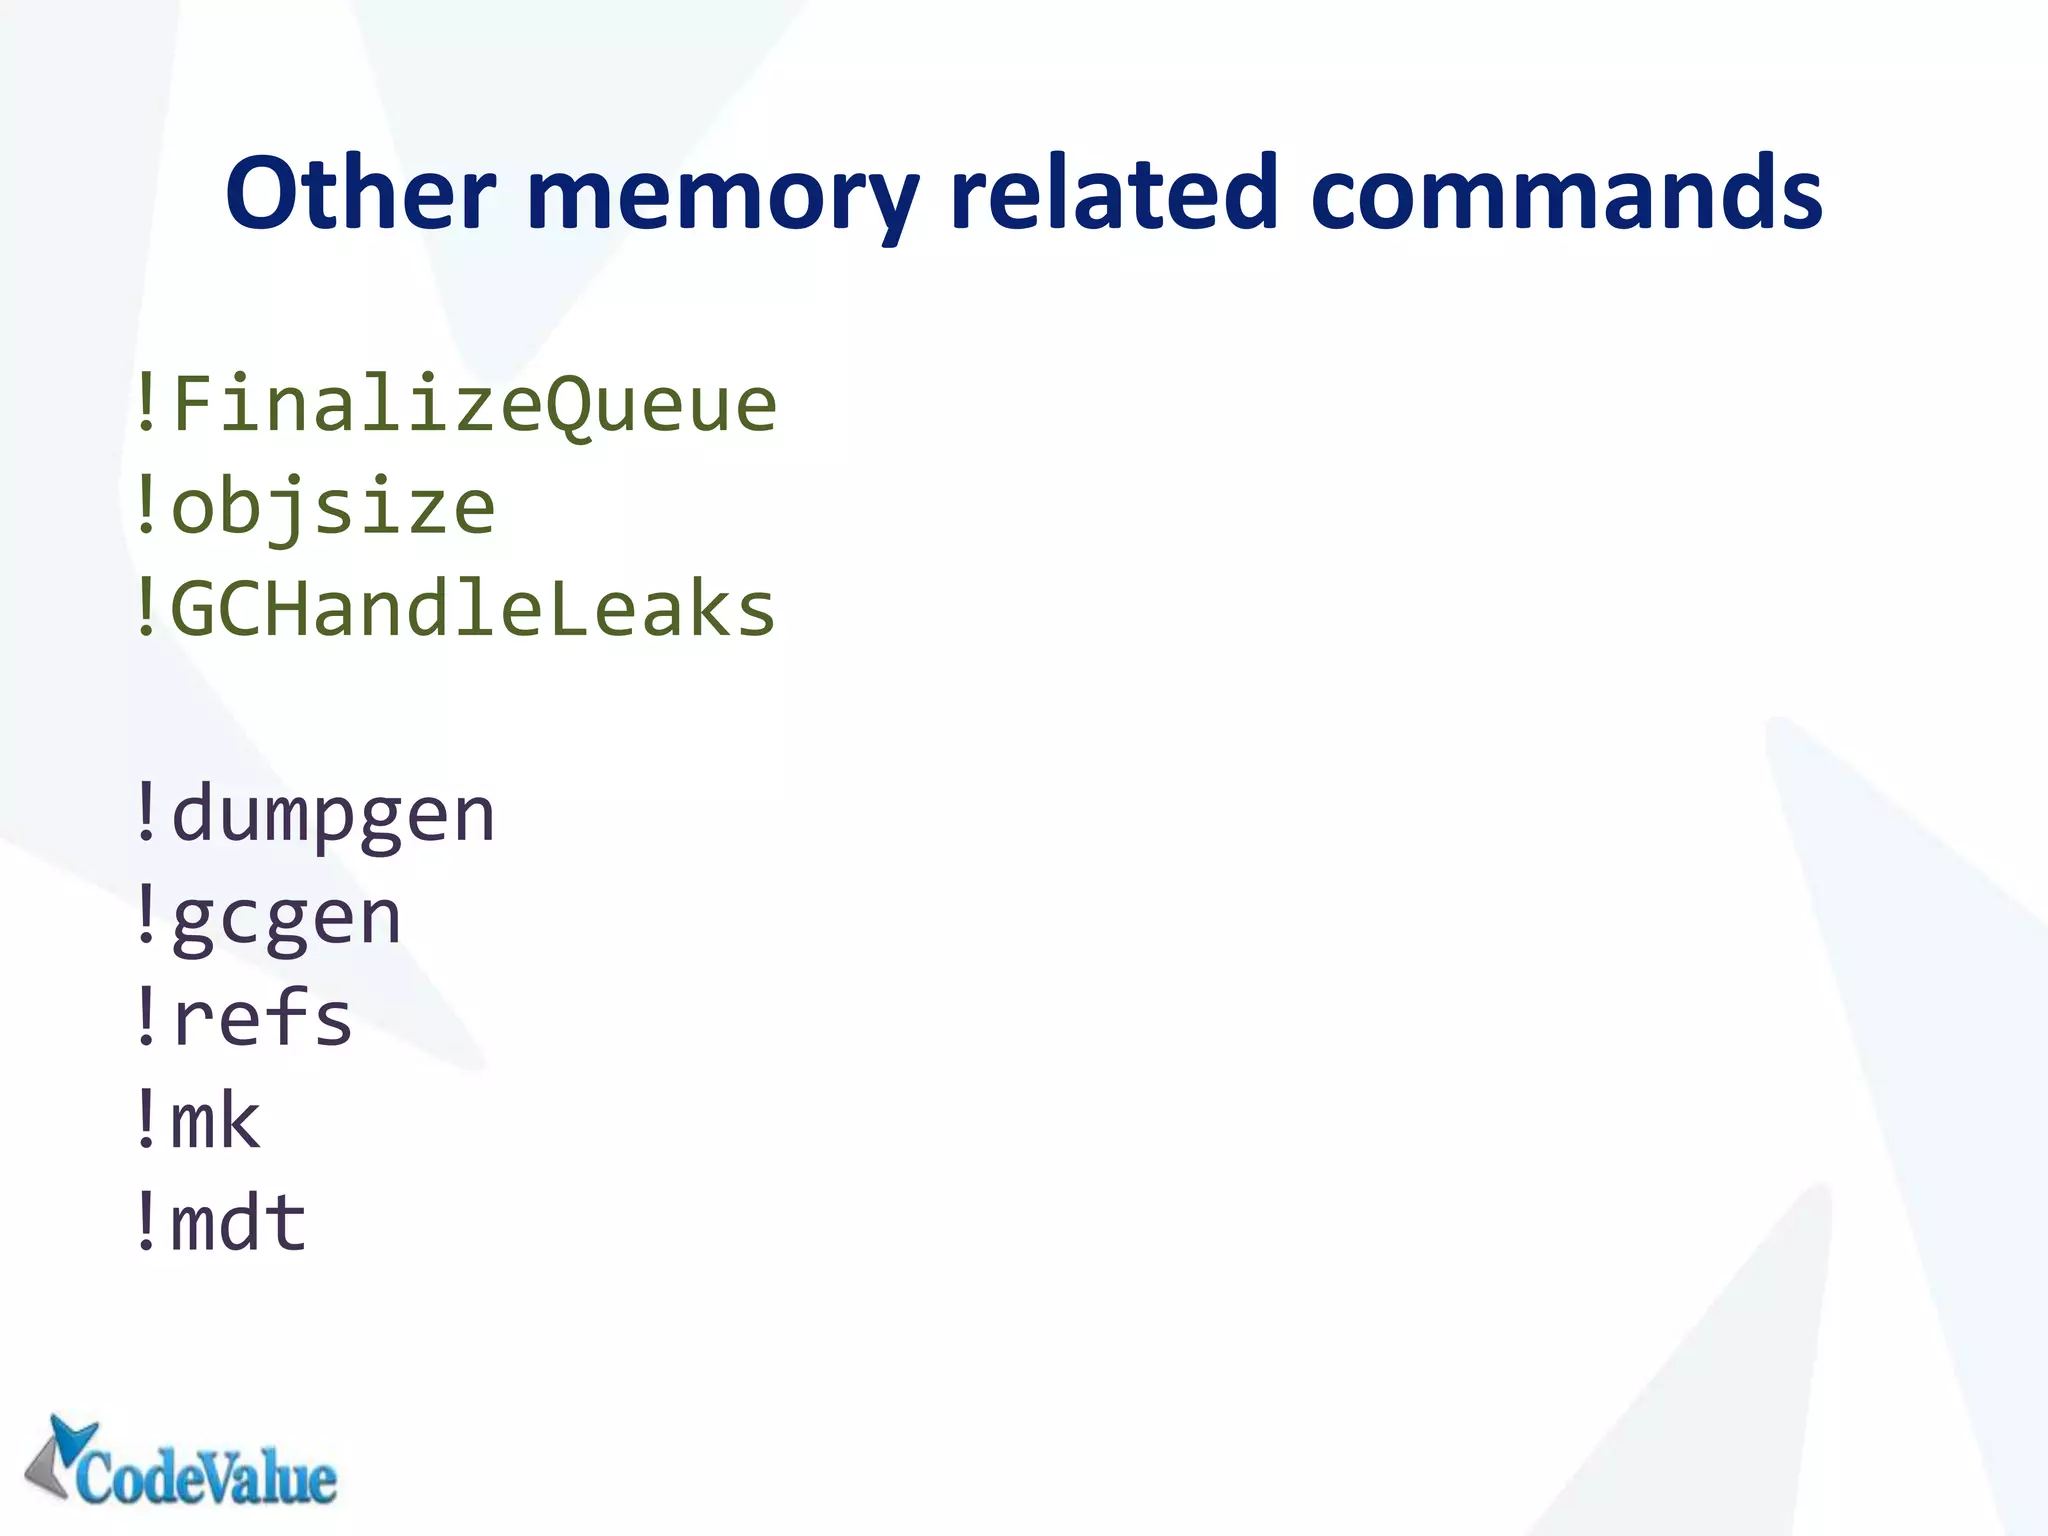
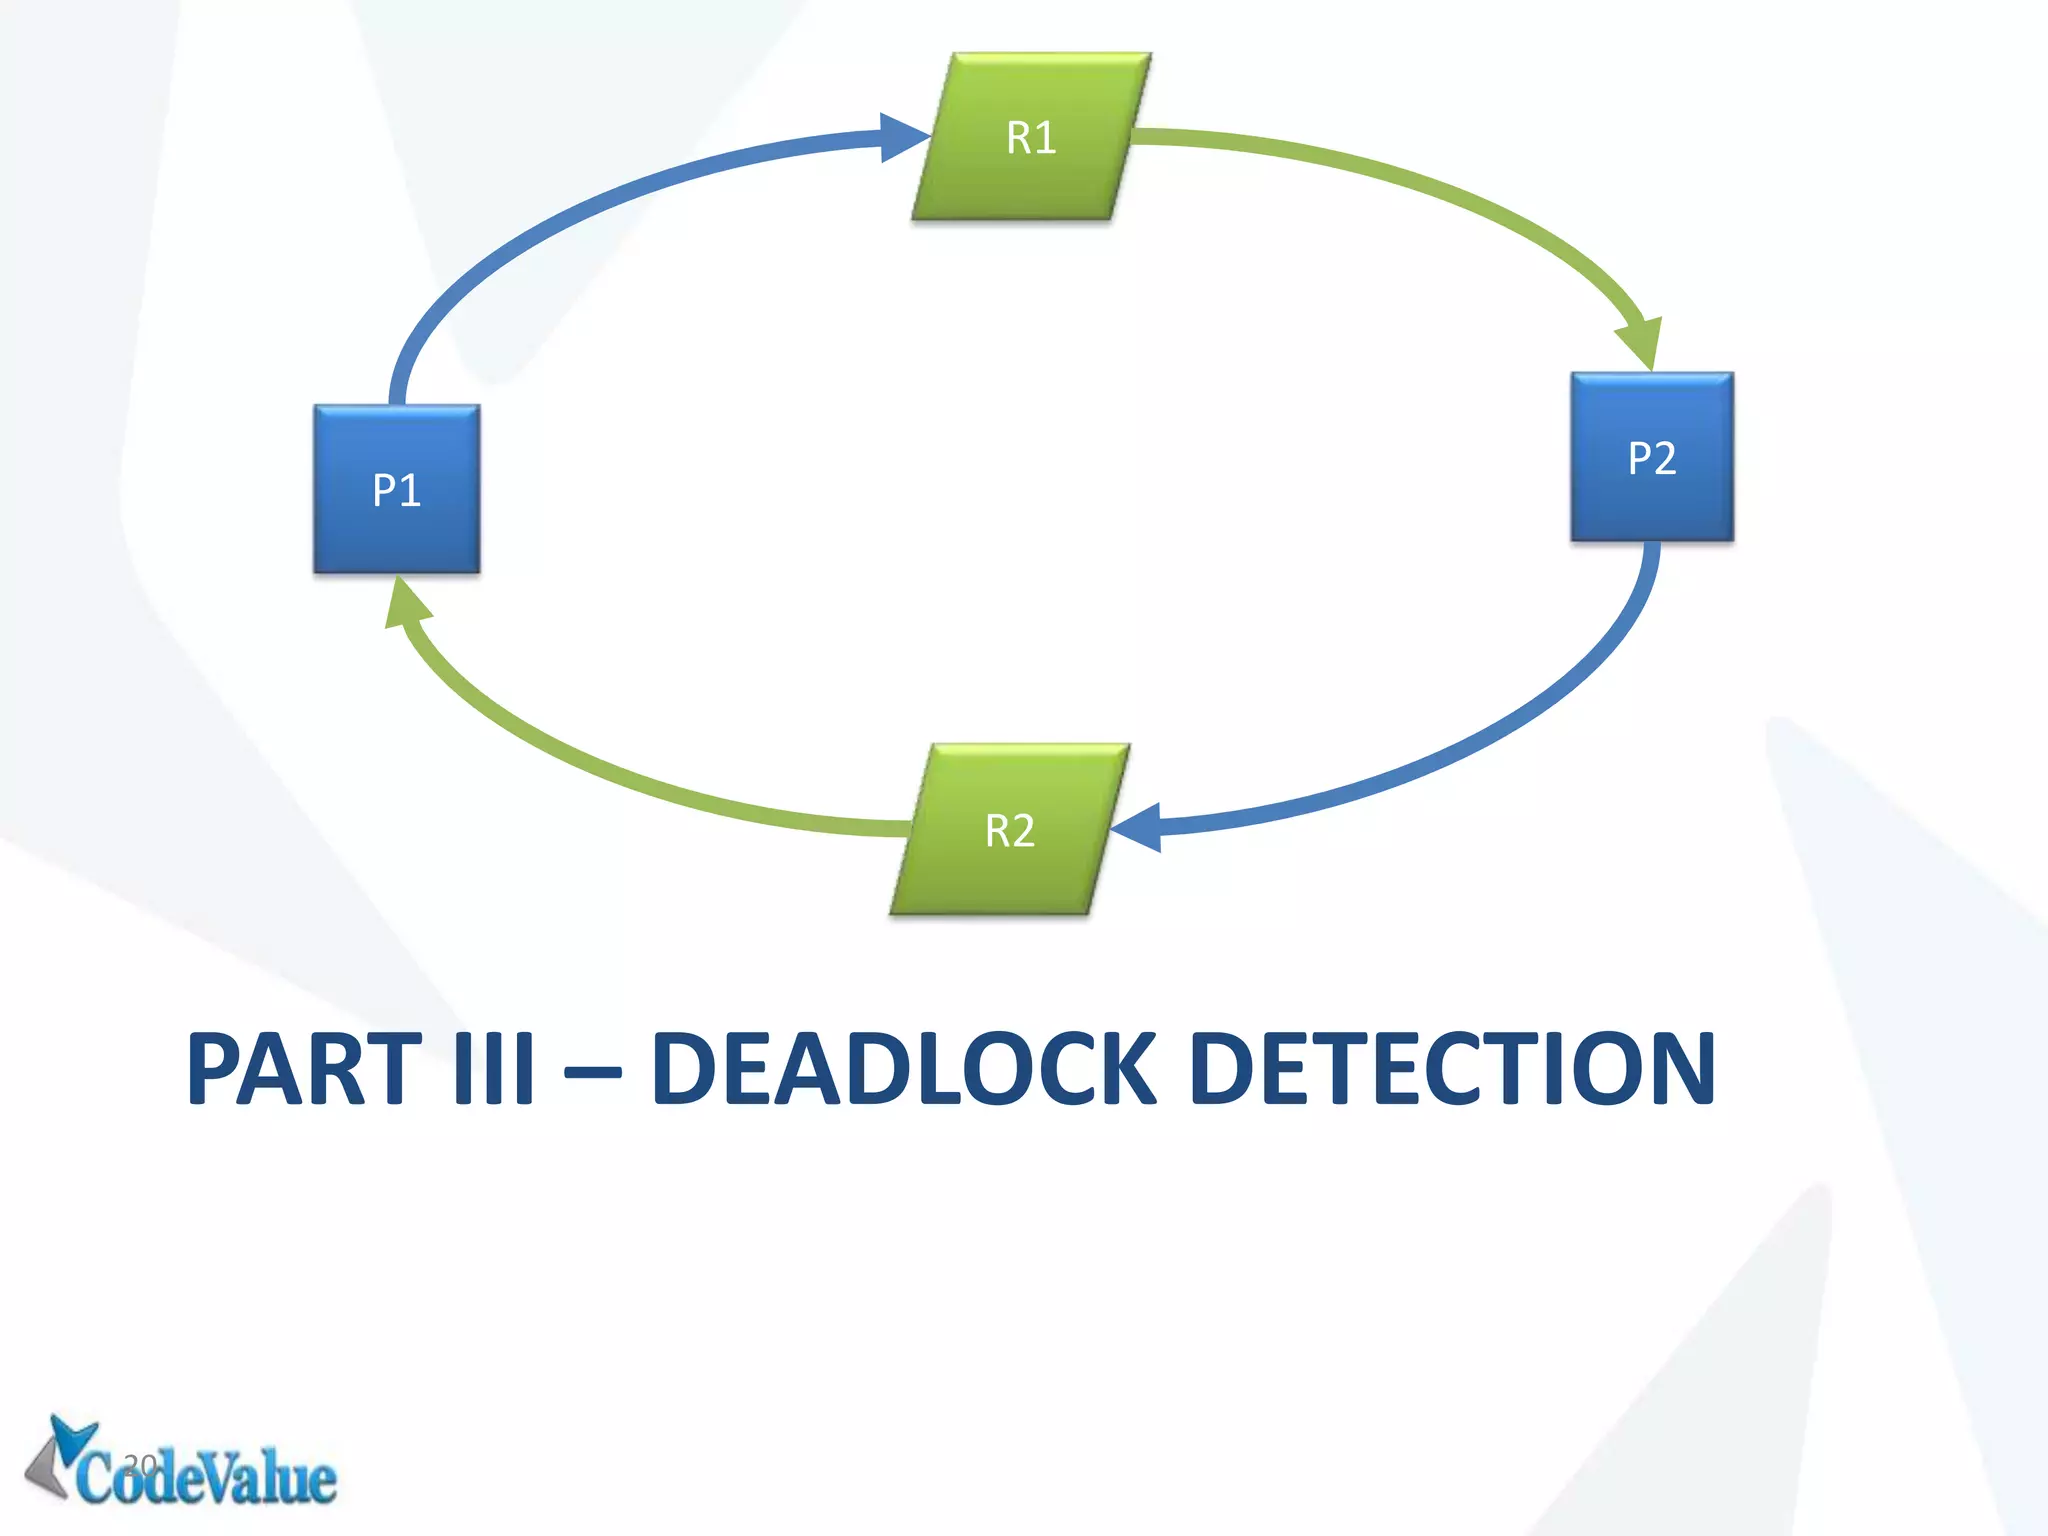
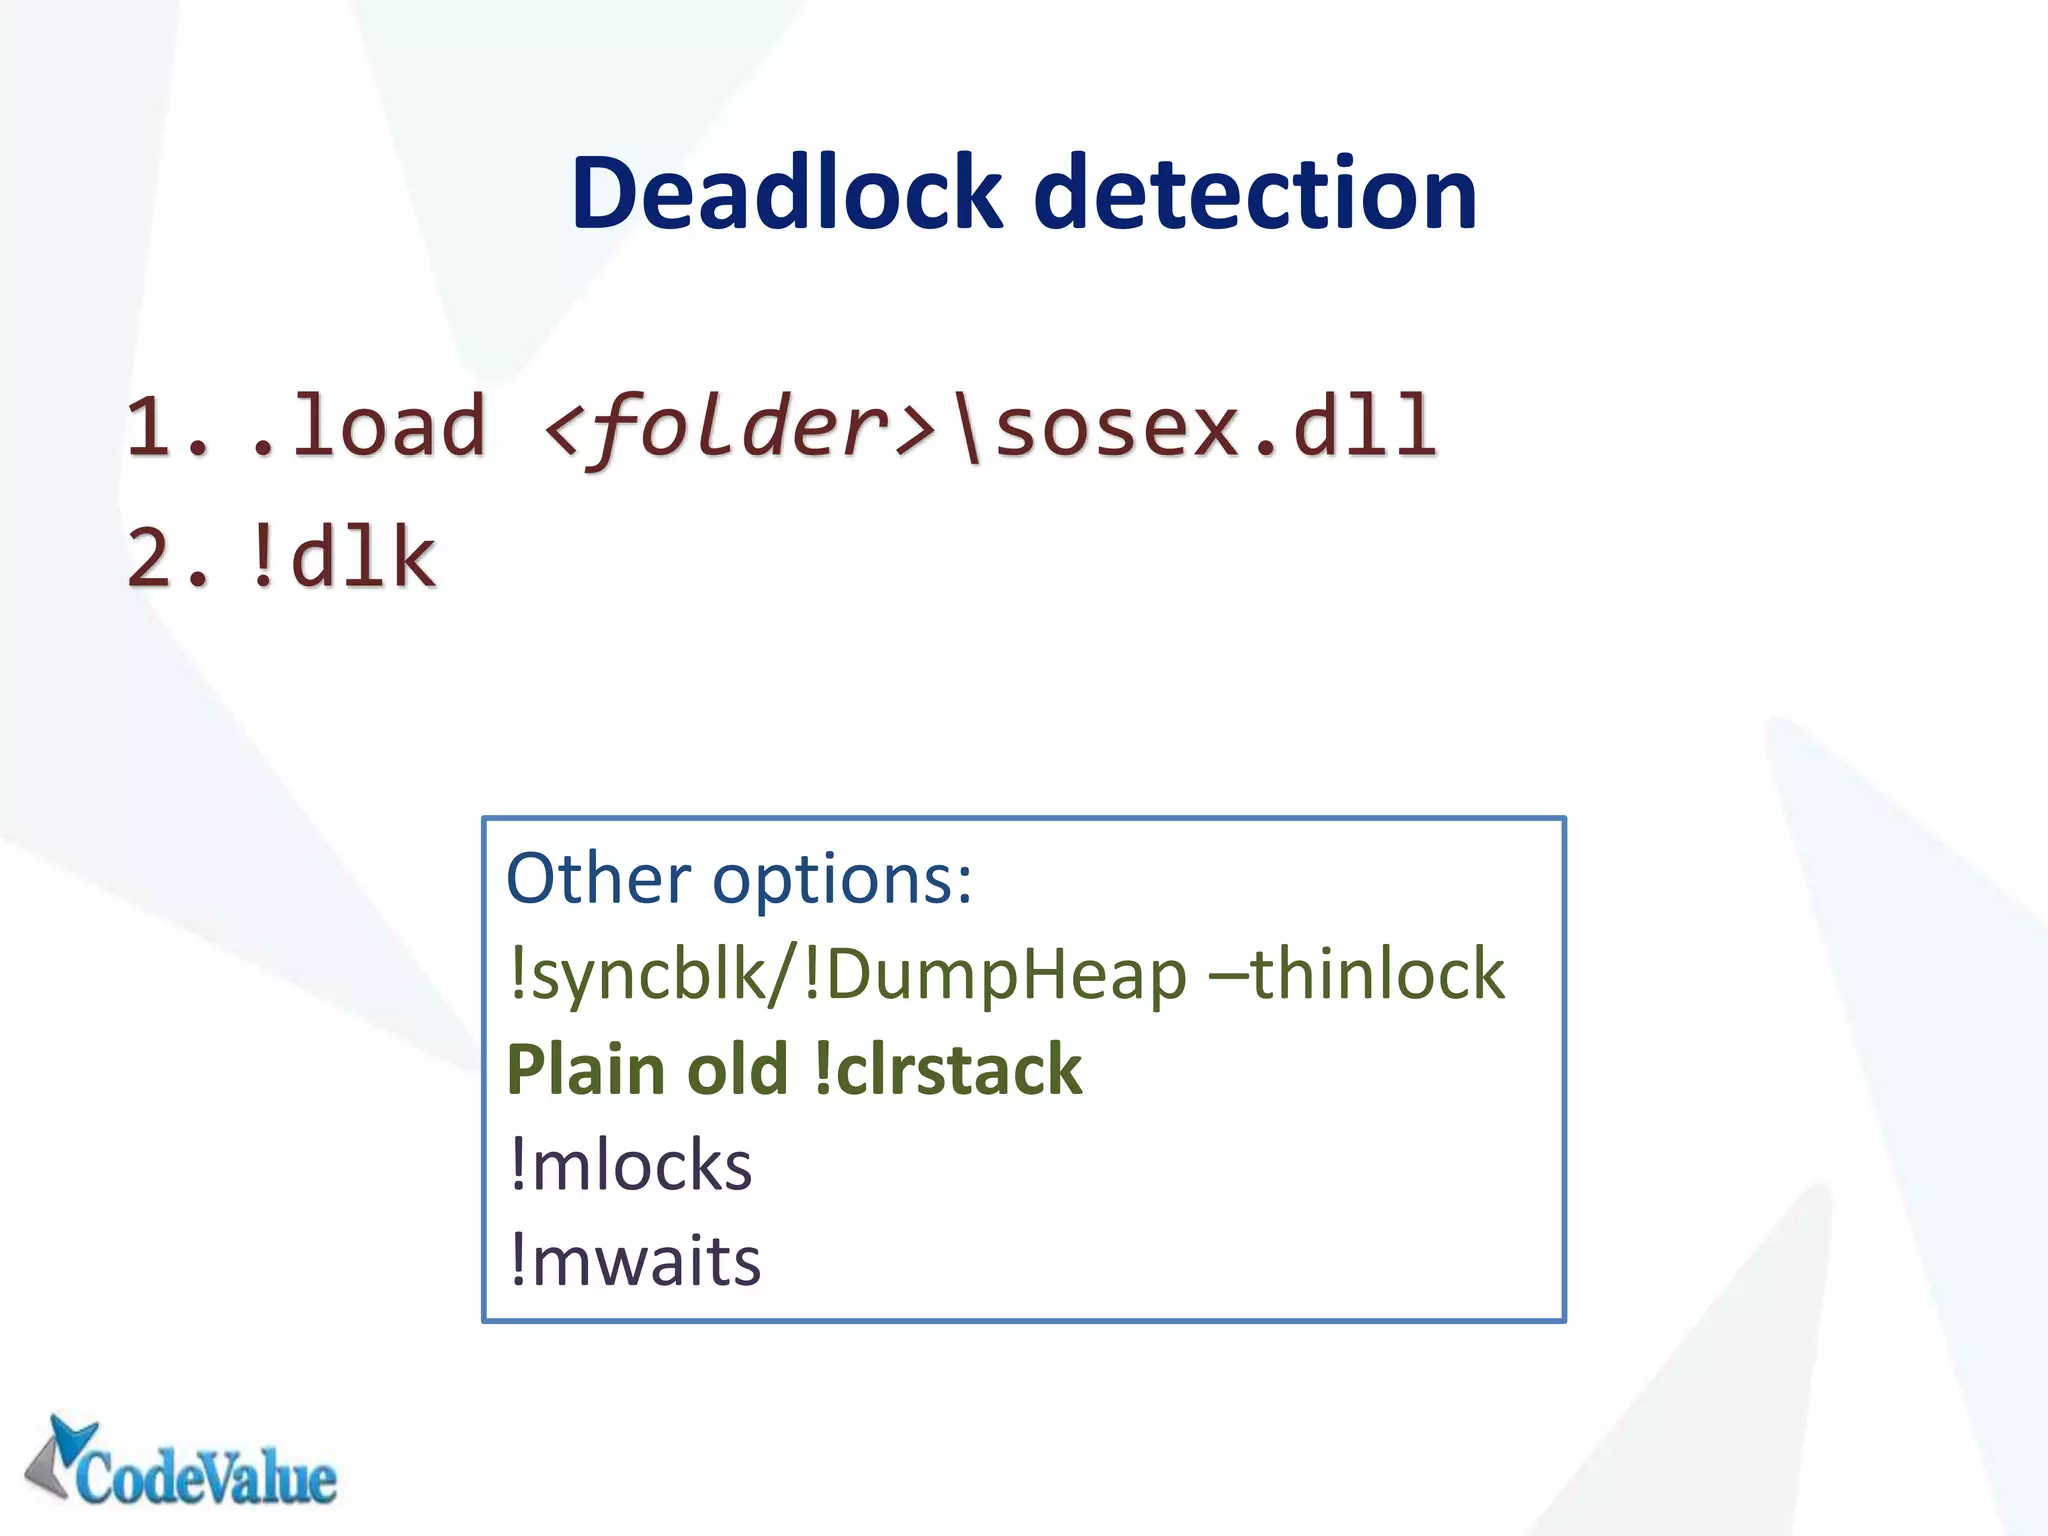
Dror Helper
drorh@codevalue.net | http://blog.drorhelper.com | @dhelper
Who’s afraid of WinDBG?
About.Me
• Senior consultant @CodeValue
• Developing software (professionally) since 2002
• Clean coder
• Test Driven Developer
• Blogger: http://blog.drorhelper.com
How I Learned to Stop Worrying and Love WinDbg
From Wikipedia Commons
When we think about debugging
Unfortunately
If (Production && Visual studio)
{
SysAdmin = VeryAngry;
Customer != Permission;
Application = NotWorking;
Debug != DateTime.Now;
}
WinDbg to the rescue
Post mortem analysis of crash/hang dumps
Inspect heap and find memory leaks
Discover deadlocks
Learn more about your application
Basic commands
| list all processes
|. current process
|<x>s switch to process
~ list all threads
~. current thread
~<n>s – switch to thread
k call stack (unmanged)
~* all threads
~* k – call stack for all threads
Wait, you’re forgot something
For proper debugging you’ll need symbols
1. lm show all modules + symbol information
2. .symfix + .reload –f
3. ld Loads symbols for the specified module
Or use
File  Symbol file path
ICanHasWindows!
PART I – CRASH ANALYSIS
11
Analyzing Crush dump
A minidump is a snapshot of an application state:
{
Process(s)
Thread(s)
Module(s)
Register(s)
Memory info
Handles
Call stack
…
}
Creating MiniDumps
WinDbg
Task Manager/ProcEx
ADPlus (Debugging tools for windows)
ProcDump (sysinternals)
sos.dll
WinDBG extension
Knows .NET
Ships with .NET framework/symbol server
.loadby sos mscorwks (.net 3.5 or earlier)
.loadby sos clr (.net 4.0 or later)
Now what?
1. Load MiniDump in WinDBG
2. Symbols!
3. Load sos.dll
4. !analyze –v
More crash analysis commands (sos)
!printexception
!threads
!dae (dump all exceptions)
!dso (dump stack objects)
!clrstack
-p (shows parameters and values)
-l (show locals)
-a (same as –p –l)
PART II - INVESTIGATING MEMORY ISSUES
17
Finding memory issues
1. Look at heap
2. List all objects
3. Dive in to see specific object
4. Compare with previous results
!dumpheap -stat
!dumpheap –type
!do
!gcroot
Other memory related commands
!FinalizeQueue
!objsize
!GCHandleLeaks
!dumpgen
!gcgen
!refs
!mk
!mdt
PART III – DEADLOCK DETECTION
20
R1
R2
P2
P1
Deadlock detection
1. .load <folder>sosex.dll
2. !dlk
Other options:
!syncblk/!DumpHeap –thinlock
Plain old !clrstack
!mlocks
!mwaits
Making WinDBG user friendly(ier)
.cmdtree <cmd file>
.prefer_dml 1
Dror Helper
C: 972.05.7668543
e: drorh@codevalue.net
B: blog.drorhelper.com

Who’s afraid of WinDbg

  • 1.
    Dror Helper drorh@codevalue.net |http://blog.drorhelper.com | @dhelper Who’s afraid of WinDBG?
  • 2.
    About.Me • Senior consultant@CodeValue • Developing software (professionally) since 2002 • Clean coder • Test Driven Developer • Blogger: http://blog.drorhelper.com
  • 3.
    How I Learnedto Stop Worrying and Love WinDbg From Wikipedia Commons
  • 4.
    When we thinkabout debugging
  • 5.
    Unfortunately If (Production &&Visual studio) { SysAdmin = VeryAngry; Customer != Permission; Application = NotWorking; Debug != DateTime.Now; }
  • 6.
    WinDbg to therescue Post mortem analysis of crash/hang dumps Inspect heap and find memory leaks Discover deadlocks Learn more about your application
  • 7.
    Basic commands | listall processes |. current process |<x>s switch to process ~ list all threads ~. current thread ~<n>s – switch to thread k call stack (unmanged) ~* all threads ~* k – call stack for all threads
  • 8.
    Wait, you’re forgotsomething For proper debugging you’ll need symbols 1. lm show all modules + symbol information 2. .symfix + .reload –f 3. ld Loads symbols for the specified module Or use File  Symbol file path
  • 9.
  • 10.
    PART I –CRASH ANALYSIS 11
  • 11.
    Analyzing Crush dump Aminidump is a snapshot of an application state: { Process(s) Thread(s) Module(s) Register(s) Memory info Handles Call stack … }
  • 12.
    Creating MiniDumps WinDbg Task Manager/ProcEx ADPlus(Debugging tools for windows) ProcDump (sysinternals)
  • 13.
    sos.dll WinDBG extension Knows .NET Shipswith .NET framework/symbol server .loadby sos mscorwks (.net 3.5 or earlier) .loadby sos clr (.net 4.0 or later)
  • 14.
    Now what? 1. LoadMiniDump in WinDBG 2. Symbols! 3. Load sos.dll 4. !analyze –v
  • 15.
    More crash analysiscommands (sos) !printexception !threads !dae (dump all exceptions) !dso (dump stack objects) !clrstack -p (shows parameters and values) -l (show locals) -a (same as –p –l)
  • 16.
    PART II -INVESTIGATING MEMORY ISSUES 17
  • 17.
    Finding memory issues 1.Look at heap 2. List all objects 3. Dive in to see specific object 4. Compare with previous results !dumpheap -stat !dumpheap –type !do !gcroot
  • 18.
    Other memory relatedcommands !FinalizeQueue !objsize !GCHandleLeaks !dumpgen !gcgen !refs !mk !mdt
  • 19.
    PART III –DEADLOCK DETECTION 20 R1 R2 P2 P1
  • 20.
    Deadlock detection 1. .load<folder>sosex.dll 2. !dlk Other options: !syncblk/!DumpHeap –thinlock Plain old !clrstack !mlocks !mwaits
  • 21.
    Making WinDBG userfriendly(ier) .cmdtree <cmd file> .prefer_dml 1
  • 22.
    Dror Helper C: 972.05.7668543 e:drorh@codevalue.net B: blog.drorhelper.com

Editor's Notes

  • #20 !FinalizeQueue – show finalizer queue !threads – show managed threads !objsize – calculate “real” object size !GCHandleLeaks – track down GCHandle leaks !finq/frq – show finilizer/freachable queue !dumpgen – Dumps the contents gen X !gcgen - GC generation of the specified object !refs - all references from/to object !mk - unmanaged and managed call stack !mdt - fields of an object or type