Downloaded 125 times
![SRECon Europe 2016 @goldshtn https://s.sashag.net/bpf07
SRECon Europe 2016 @goldshtn https://s.sashag.net/bpf07
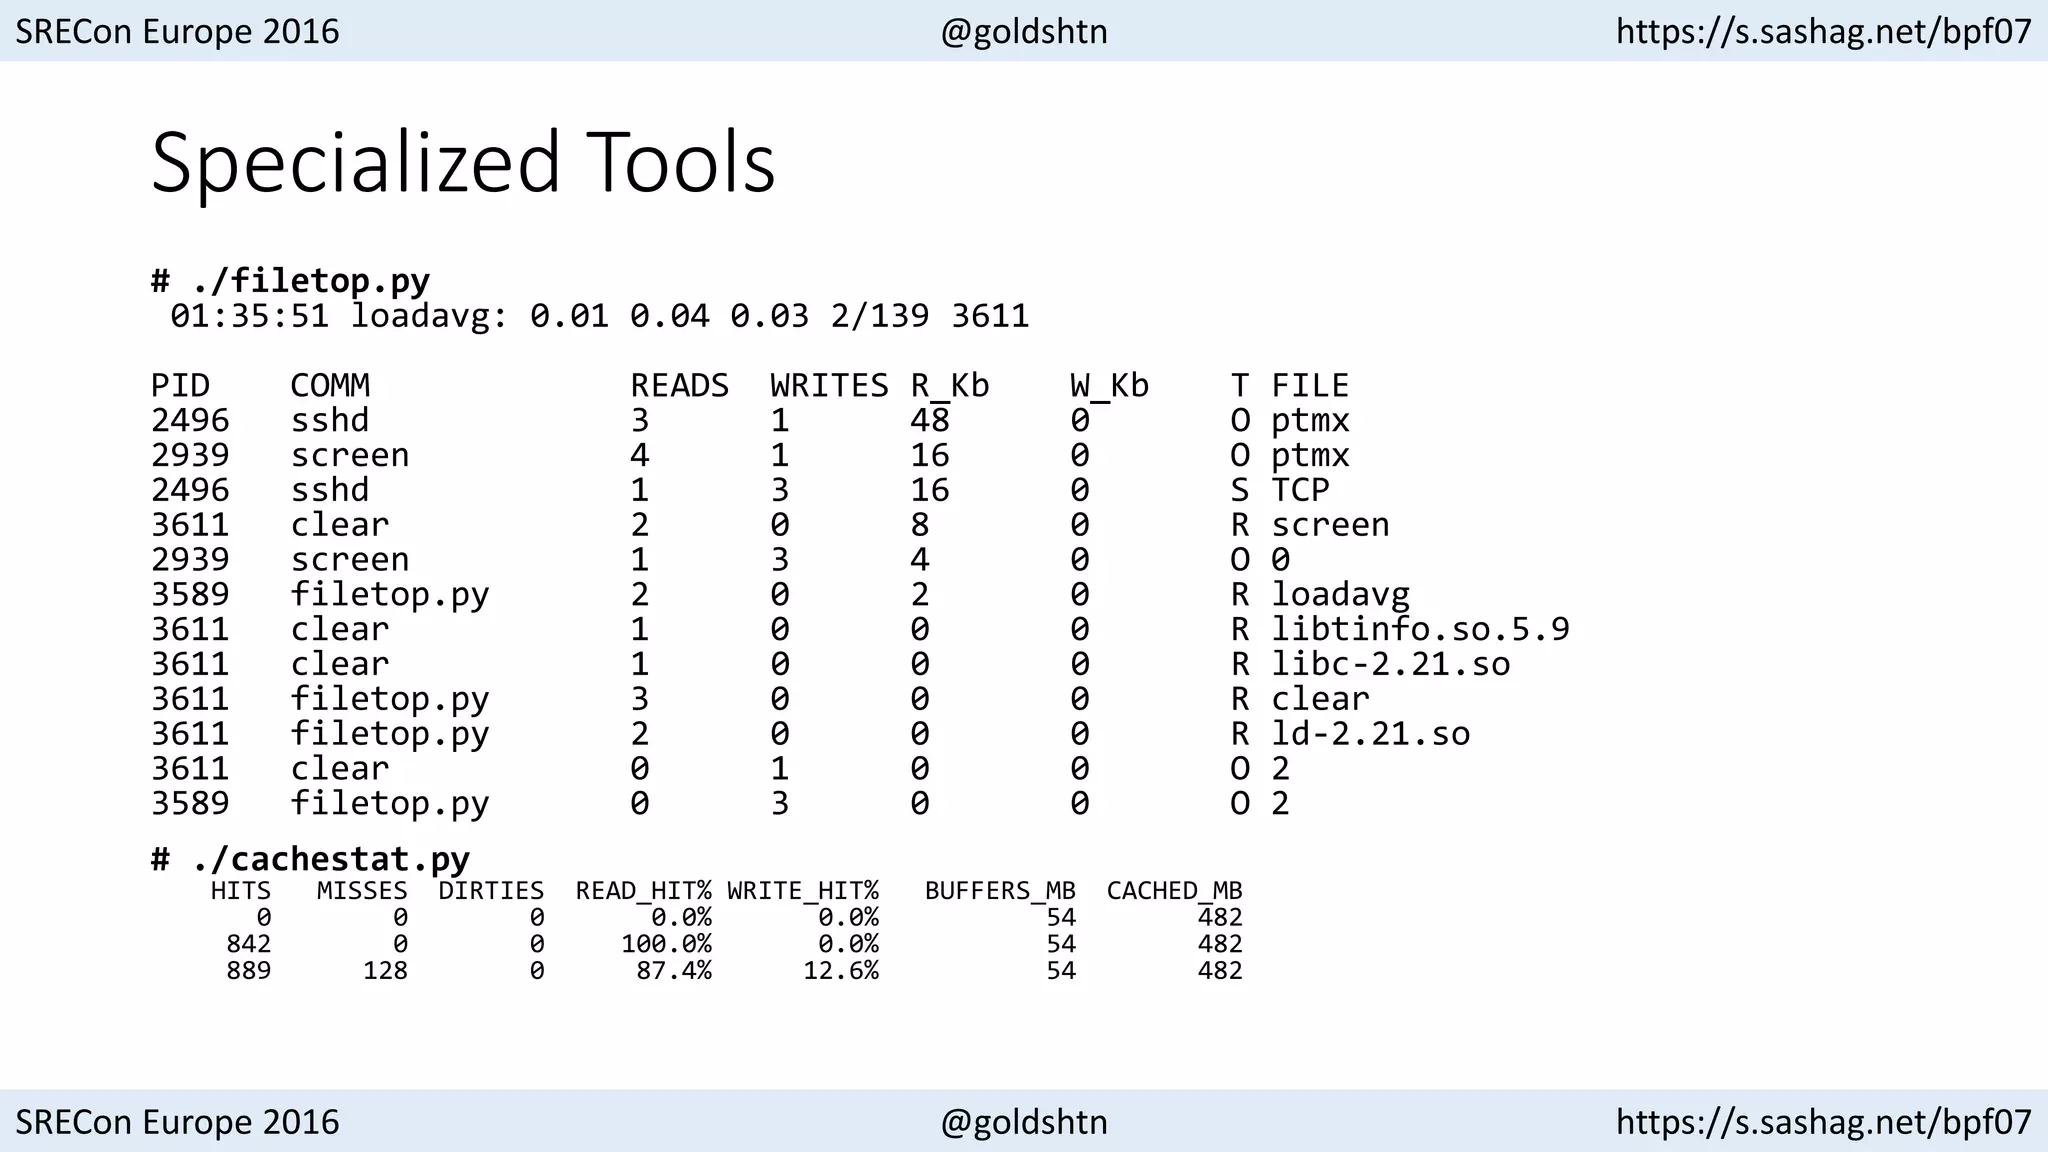
Specialized Tools
# ./hardirqs.py
Tracing hard irq event time... Hit Ctrl-C to end.
^C
HARDIRQ TOTAL_usecs
virtio0-input.0 959
ahci[0000:00:1f.2] 1290
# ./biolatency.py
Tracing block device I/O... Hit Ctrl-C to end.
^C
usecs : count distribution
64 -> 127 : 7 |********* |
128 -> 255 : 14 |****************** |
256 -> 511 : 5 |****** |
512 -> 1023 : 30 |****************************************|
1024 -> 2047 : 1 |* |](https://image.slidesharecdn.com/bpf-160712064948/75/The-Next-Linux-Superpower-eBPF-Primer-9-2048.jpg)
![SRECon Europe 2016 @goldshtn https://s.sashag.net/bpf07
SRECon Europe 2016 @goldshtn https://s.sashag.net/bpf07
Multi-Tools: argdist
# ./argdist.py -C 'p:c:write(int fd, const void *buf,
size_t count):size_t:count:fd==1'
[01:49:00]
p:c:write(int fd, const void *buf, size_t count):size_t:count:fd==1
COUNT EVENT
1 count = 3134
1 count = 170
1 count = 181
2 count = 18
3 count = 30](https://image.slidesharecdn.com/bpf-160712064948/75/The-Next-Linux-Superpower-eBPF-Primer-13-2048.jpg)
![SRECon Europe 2016 @goldshtn https://s.sashag.net/bpf07
SRECon Europe 2016 @goldshtn https://s.sashag.net/bpf07
Multi-Tools: argdist
# ./argdist.py -i 5 -H 'r::__vfs_read(void *file, void *buf,
size_t count):size_t:$entry(count):$latency > 1000000'
[01:51:40]
count : count distribution
0 -> 1 : 20 |****************************************|
2 -> 3 : 0 | |
4 -> 7 : 0 | |
8 -> 15 : 0 | |
16 -> 31 : 0 | |
32 -> 63 : 0 | |
64 -> 127 : 0 | |
128 -> 255 : 6 |************ |
256 -> 511 : 0 | |
512 -> 1023 : 0 | |
1024 -> 2047 : 1 |** |](https://image.slidesharecdn.com/bpf-160712064948/75/The-Next-Linux-Superpower-eBPF-Primer-14-2048.jpg)
![SRECon Europe 2016 @goldshtn https://s.sashag.net/bpf07
SRECon Europe 2016 @goldshtn https://s.sashag.net/bpf07
Multi-Tools: trace
# ./trace.py 'r:/usr/bin/bash:readline "%s", retval'
TIME PID COMM FUNC -
02:02:26 3711 bash readline ls –la
02:02:36 3711 bash readline wc -l src.c
# ./tplist.py -v block:block_rq_complete
block:block_rq_complete
dev_t dev;
sector_t sector;
unsigned int nr_sector;
int errors;
char rwbs[8];
# ./trace.py 't:block:block_rq_complete "sectors=%d", tp.nr_sector'
TIME PID COMM FUNC -
02:03:56 0 swapper/0 block_rq_complete sectors=16
02:03:56 0 swapper/0 block_rq_complete sectors=8
02:03:58 0 swapper/0 block_rq_complete sectors=24
02:04:00 0 swapper/0 block_rq_complete sectors=0](https://image.slidesharecdn.com/bpf-160712064948/75/The-Next-Linux-Superpower-eBPF-Primer-15-2048.jpg)
![SRECon Europe 2016 @goldshtn https://s.sashag.net/bpf07
SRECon Europe 2016 @goldshtn https://s.sashag.net/bpf07
Multi-Tools: trace
# trace -p $(pidof node) 'u:node:http__server__request
"%s %s (from %s:%d)" arg5, arg6, arg3, arg4'
TIME PID COMM FUNC -
04:50:44 22185 node http__server__request GET /foofoo (from ::1:51056)
04:50:46 22185 node http__server__request GET / (from ::1:51056)
^C
# ./trace.py 'u:/tmp/libjvm.so:thread__start "%s [%d]", arg1, arg4'
'u:/tmp/libjvm.so:thread__stop "%s [%d]", arg1, arg4'
TIME PID COMM FUNC -
06:55:24 32157 java thread__start Reference Handler [32157]
06:55:24 32158 java thread__start Finalizer [32158]
06:55:24 32159 java thread__start Signal Dispatcher [32159]
06:55:24 32160 java thread__start C2 CompilerThread0 [32160]
06:55:24 32161 java thread__start C2 CompilerThread1 [32161]
06:55:24 32162 java thread__start C1 CompilerThread2 [32162]
06:55:24 32163 java thread__start Service Thread [32163]
06:55:28 32159 java thread__stop Signal Dispatcher [32159]
^C](https://image.slidesharecdn.com/bpf-160712064948/75/The-Next-Linux-Superpower-eBPF-Primer-17-2048.jpg)


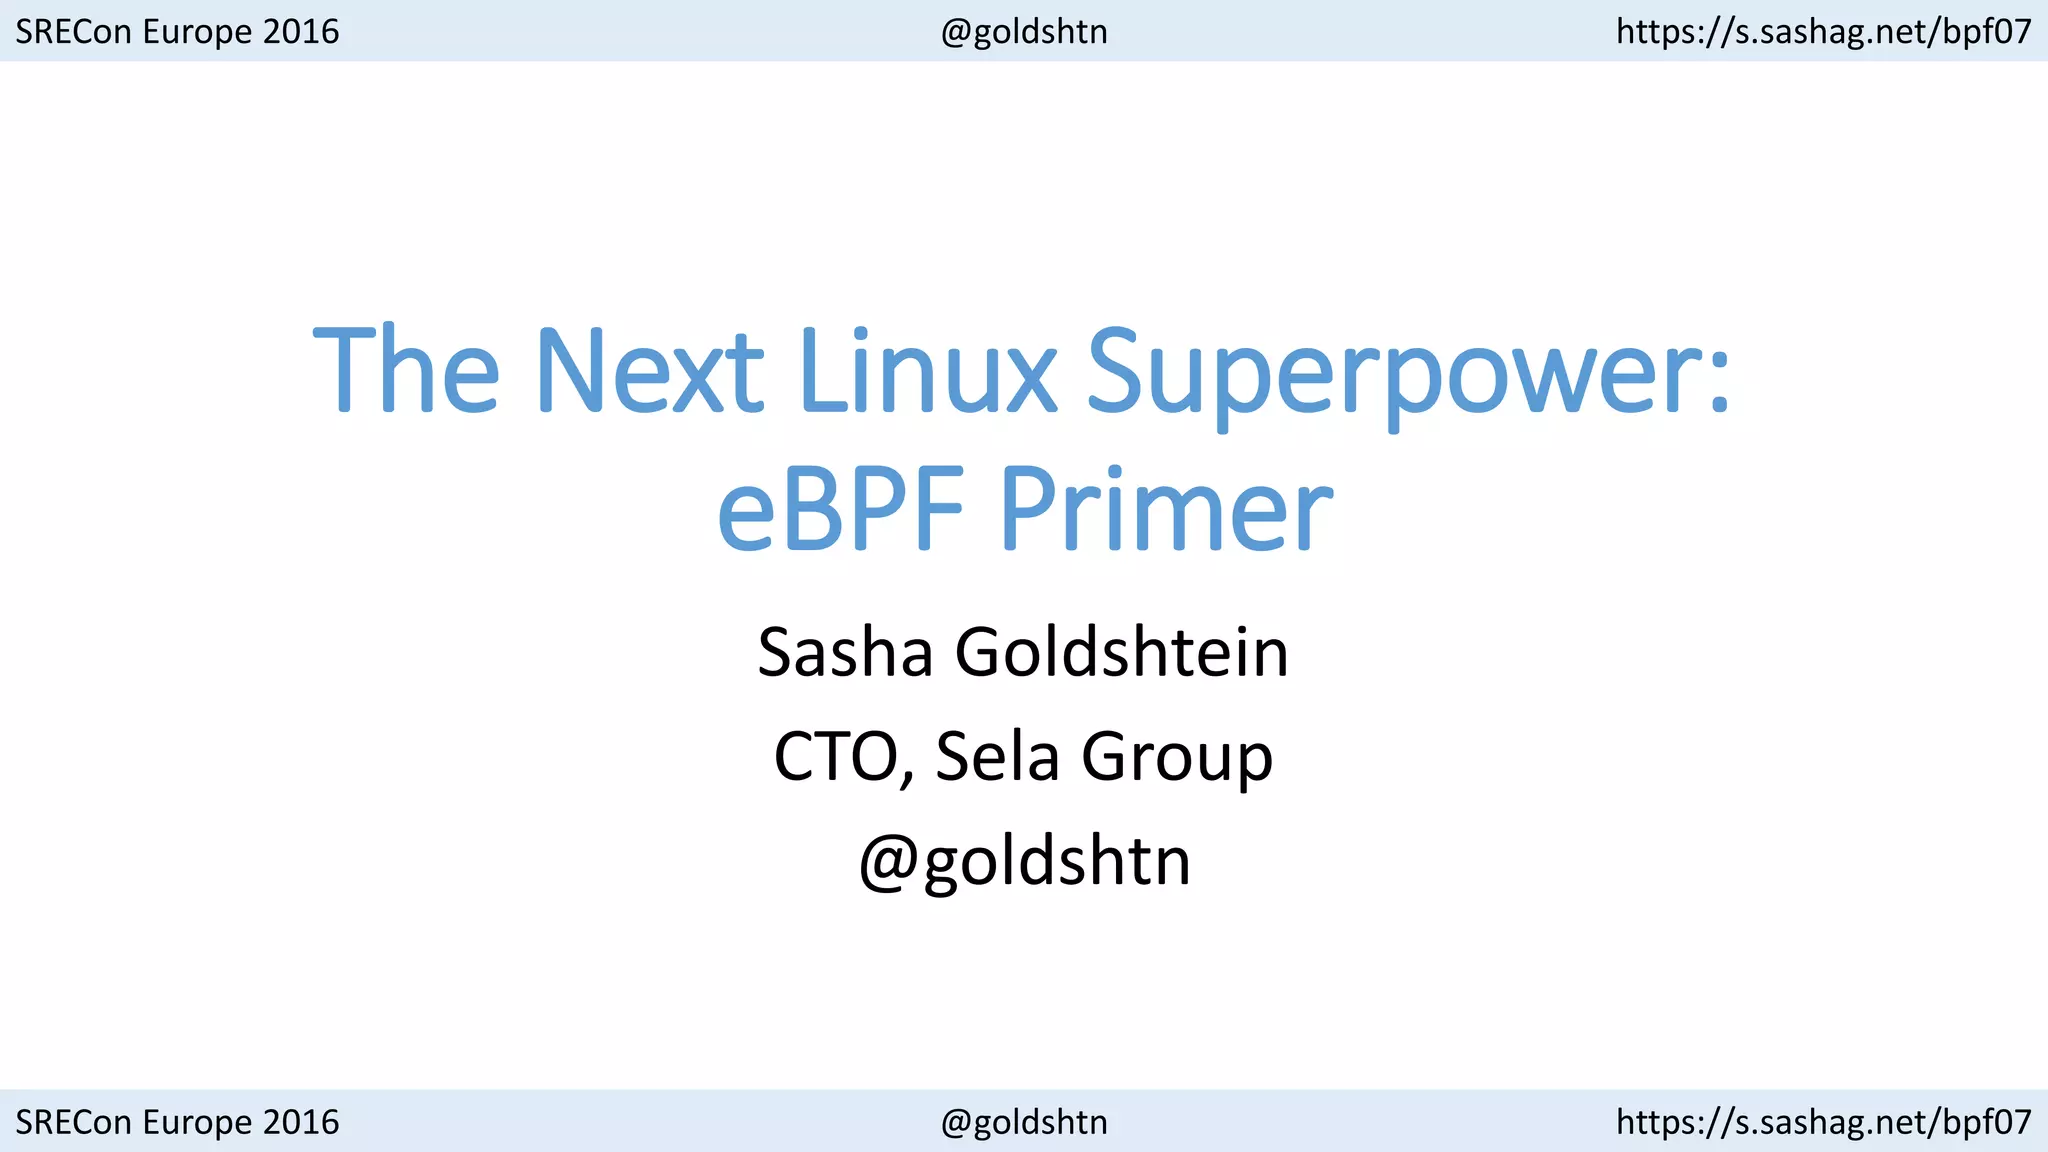
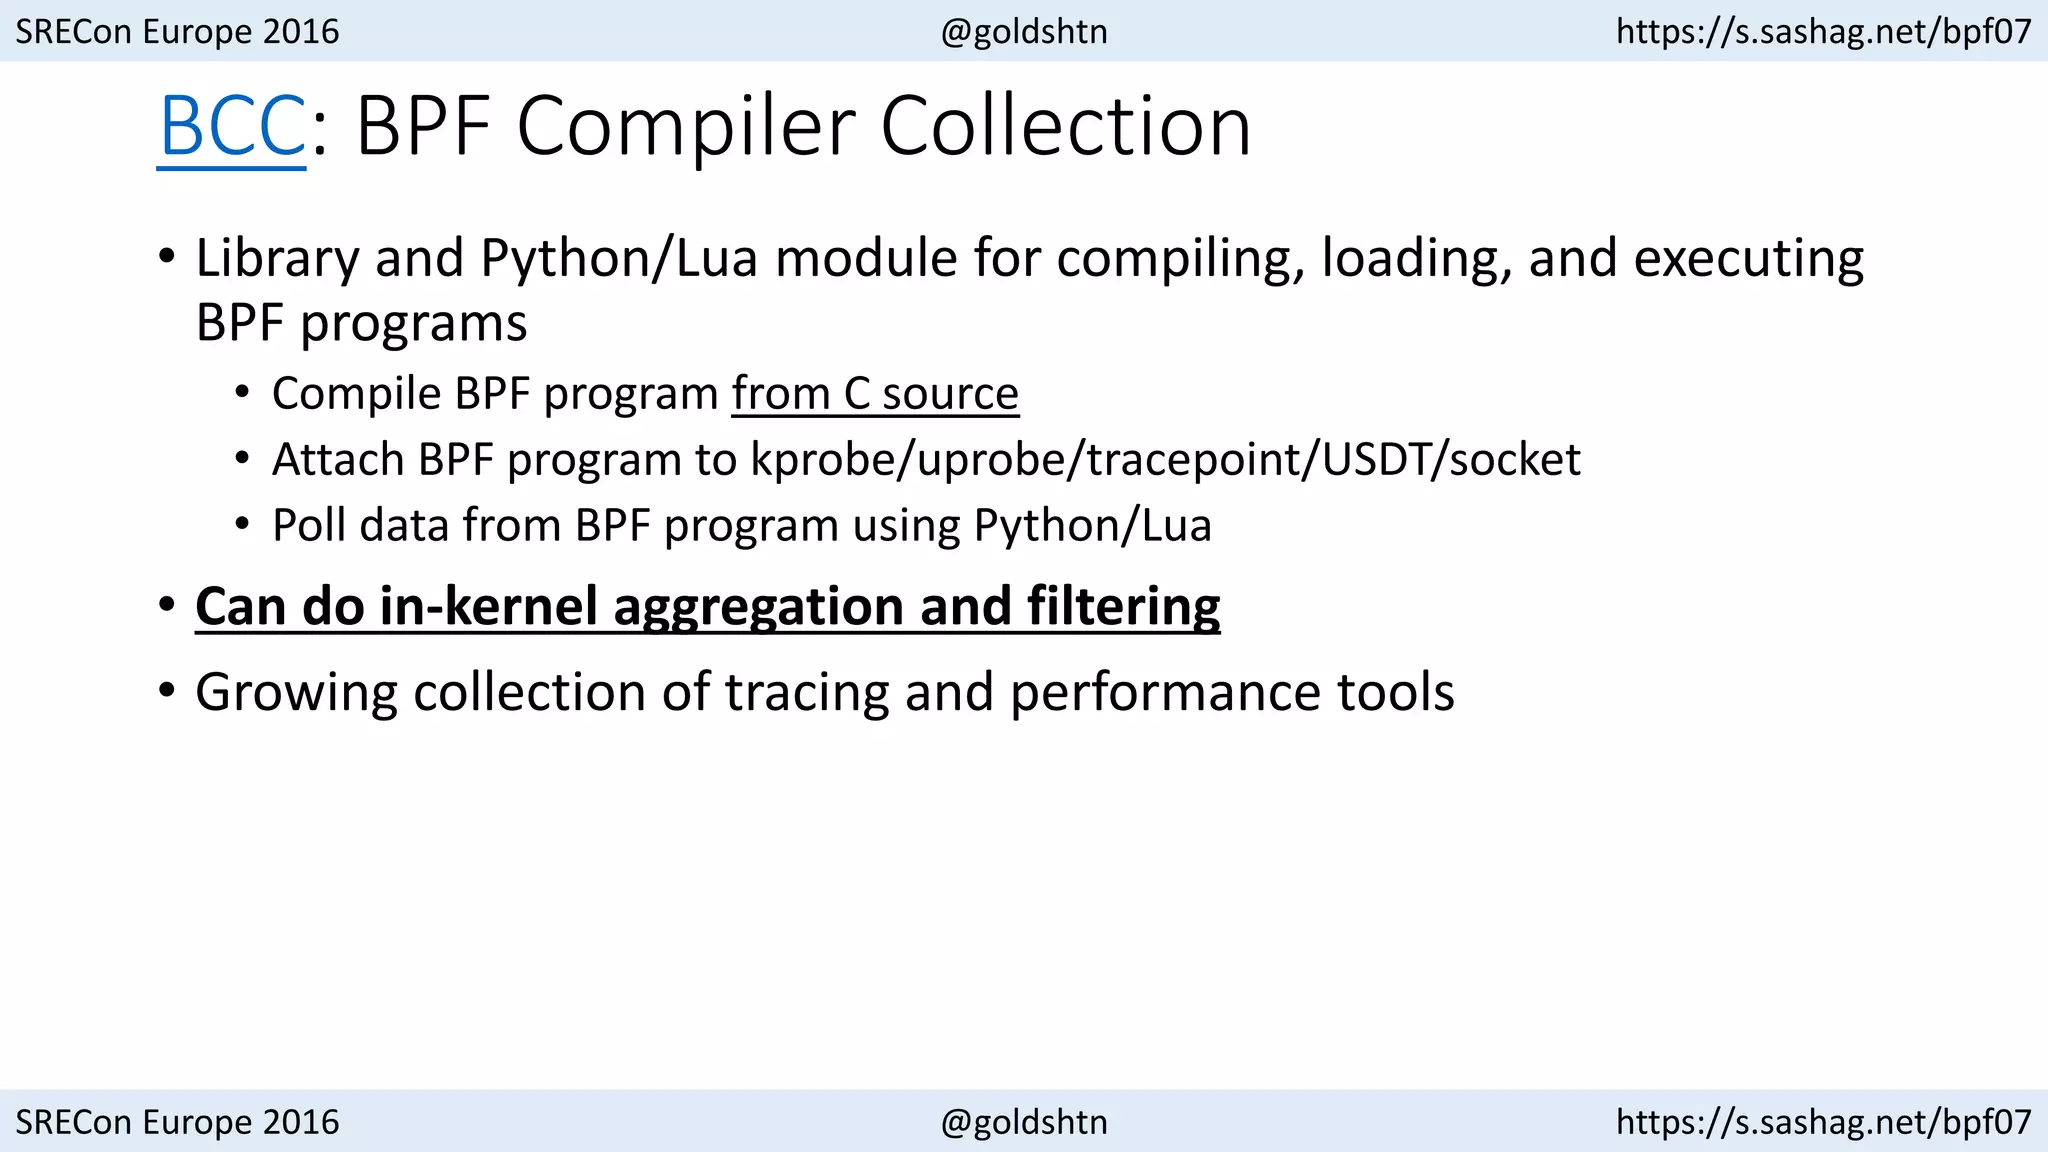
The document is a presentation on eBPF (extended Berkeley Packet Filter) and its application in modern Linux tracing tools, delivered at SREcon Europe 2016 by Sasha Goldshtein. It covers the landscape of Linux tracing, the BPF and BCC (BPF Compiler Collection), and includes numerous examples, tools, and scripts for tracing performance metrics in a customizable manner. The summary emphasizes the importance of eBPF in dynamic, low-overhead production tracing for identifying bugs and performance issues in Linux environments.