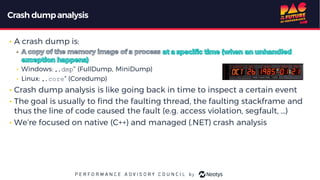
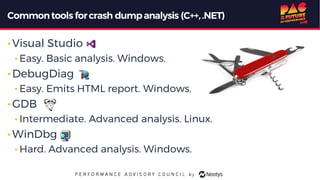
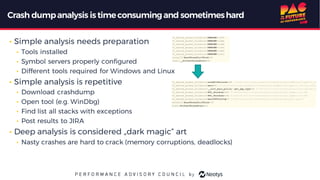
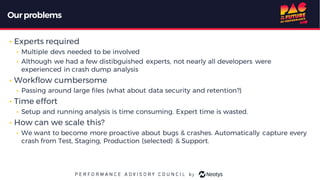
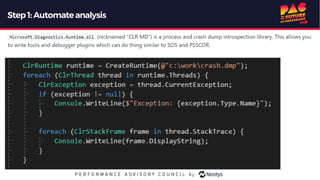
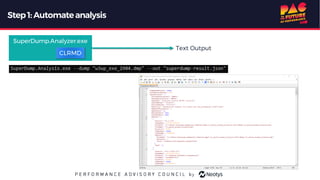
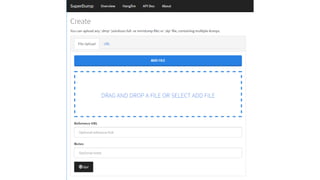
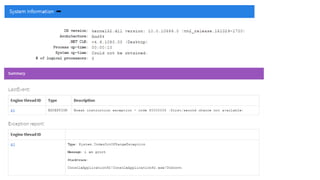
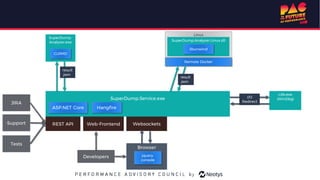
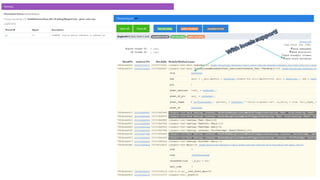
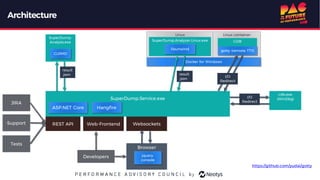
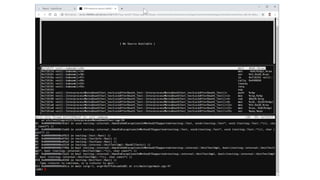
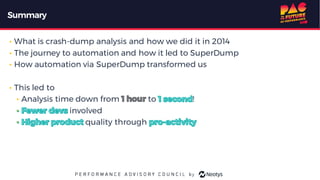
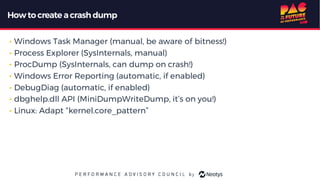
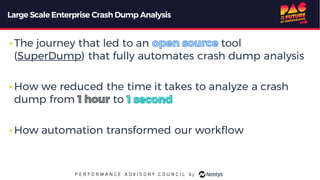
The document describes the journey of automating large scale enterprise crash dump analysis. It details how manual crash analysis used to be a slow and difficult process involving passing large files between experts. Through four steps of automation - automating analysis, adding a web frontend, integrating workflows, and enabling deep analysis in the browser - a tool called SuperDump was created that transformed the process. SuperDump reduced analysis time from days to minutes, enabled non-experts to analyze crashes, and improved productivity, security, and quality by making analysis scalable and easy.


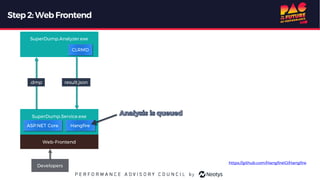
![Astory from 2014
• Peter (Customer): "We have a problem with your product. It's crashing."
• Steffi (Support): "Ok, please create a crash-dump and upload it to our support-portal."
• Peter (Customer): "Ok, here you go."
• Steffi (Support): "Development, this customer has [problem X], please have a look at these crash dumps."
• Luke (Development): "Oh, I've never done this before. Sarah, you have experience with this. Can you help?"
• Sarah (Development): "Sure. (Downloads 500MBfile). Oh, it's a windows dump. Can't analyze that on my Linux box. Tom, can you take this?"
• Tom (Development): "Ok. (Downloads 500MB file). Configures symbol server. Uses Visual Studio to see stacktraces. Makes screenshots and
attaches them to JIRA."
• Next day: Luke (dev): "Thanks Tom. I've almost got it. Can you find out this [detail X] for me?"
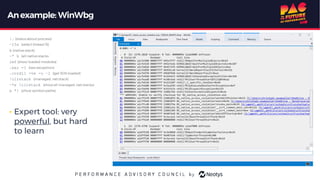
• Tom (dev): "Sigh. Loads dump again, this time in a different tool (WinDbg), as it allows deeper research. Finds [detail X]."
• Luke (dev): Finds and fixes problem.
• ...
• Next week: "Hey Tom, I have 20 new crash dumps, can you analyze them?"
• Tom: “Great Scott. We need to automate this."](https://image.slidesharecdn.com/pac2019-christoph-largescalecrashdumpanalysis-copie-191003100036/85/PAC-2019-virtual-Christoph-NEUMULLER-4-320.jpg)