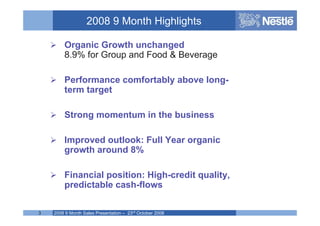
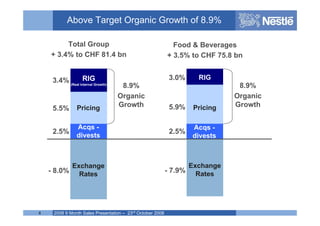
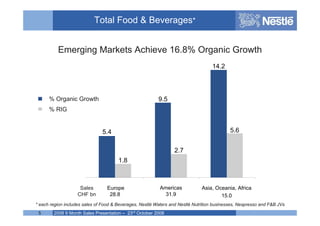
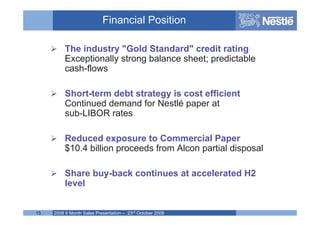
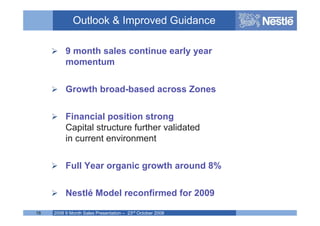
1. 2008 9 Month Sales
Roddy
Child-Villiers
Head of
Investor Relations
2008 9 Month Sales Presentation – 23rd October 2008
1 Name of chairman
2. Disclaimer
This presentation contains forward looking
statements which reflect Management’s current
views and estimates. The forward looking
statements involve certain risks and uncertainties
that could cause actual results to differ materially
from those contained in the forward looking
statements. Potential risks and uncertainties
include such factors as general economic
conditions, foreign exchange fluctuations,
competitive product and pricing pressures and
regulatory developments.
2008 9 Month Sales Presentation – 23rd October 2008
2 Name of chairman
3. 2008 9 Month Highlights
Organic Growth unchanged
8.9% for Group and Food & Beverage
Performance comfortably above long-
term target
Strong momentum in the business
Improved outlook: Full Year organic
growth around 8%
Financial position: High-credit quality,
predictable cash-flows
2008 9 Month Sales Presentation – 23rd October 2008
3 Name of chairman
4. Above Target Organic Growth of 8.9%
Total Group Food & Beverages
+ 3.4% to CHF 81.4 bn + 3.5% to CHF 75.8 bn
3.0% RIG
RIG
3.4% (Real Internal Growth)
8.9%
8.9%
Organic
Organic
Growth
Growth 5.9% Pricing
Pricing
5.5%
Acqs - Acqs -
2.5%
2.5%
divests divests
Exchange
Exchange
- 7.9%
- 8.0% Rates
Rates
2008 9 Month Sales Presentation – 23rd October 2008
4 Name of chairman
5. Total Food & Beverages*
Emerging Markets Achieve 16.8% Organic Growth
14.2
% Organic Growth 9.5
% RIG
5.6
5.4
2.7
1.8
x.x
Americas
Sales Europe Asia, Oceania, Africa
31.9
CHF bn 28.8 15.0
* each region includes sales of Food & Beverages, Nestlé Waters and Nestlé Nutrition businesses, Nespresso and F&B JVs
2008 9 Month Sales Presentation – 23rd October 2008
5 Name of chairman
6. Primary Reporting: F&B
A Strong Broad-Based Performance
22.8
19.7
13.2
9.6
10.7
% Organic Growth
% RIG 8.9
6.0 4.0
4.5
3.0
3.0
2.1
Nestlé
Waters
Total F&B
Zone Zone Nestlé Other F&B
Zone
-1.0
AMS AOA Nutrition
EUR
-3.2
Sales
CHF Bn 21.0 23.8 12.7 7.6 7.8 2.9 75.8
2008 9 Month Sales Presentation – 23rd October 2008
6 Name of chairman
7. Zone Europe
Organic growth (OG) above HY '08
6.0
GB region & PetCare high single-digit
Acceleration in Germany
2.1
France unchanged through 2008
E. Europe mid-teen organic growth
Chocolate, Culinary, Soluble Coffee
are high single-digit
% Organic Growth
% RIG
2008 9 Month Sales Presentation – 23rd October 2008
7 Name of chairman
8. Zone Americas
10.7
High single-digit organic growth in
North America (NA)
Double-digit organic growth in Latin
America (LA)
Acceleration in NA – PetCare, Ice-
3.0
Cream, Frozen Food, Chocolate
LA slower – Ambient dairy, but
almost all categories double-digit
% Organic Growth
% RIG
2008 9 Month Sales Presentation – 23rd October 2008
8 Name of chairman
9. Zone AOA
13.2
Momentum maintained from H1
All major emerging markets
achieve double-digit organic
growth
Japan accelerated 4.5
Strong performance by all
categories in the Zone
% Organic Growth
% RIG
2008 9 Month Sales Presentation – 23rd October 2008
9 Name of chairman
10. Waters
Organic growth unchanged from H1
Slowdown in Europe & North America
-1.0
Emerging markets remain strong
-3.2
Billionaire & premium brands resilient
% Organic Growth
% RIG
2008 9 Month Sales Presentation – 23rd October 2008
10 Name of chairman
11. Nutrition
9.6
Organic growth in line with
mid-term target
Infant Formula very strong
4.0
NaturNes launch creates new
offer in baby food
Profit mix improvements through
SKU rationalisation
% Organic Growth
% RIG
2008 9 Month Sales Presentation – 23rd October 2008
11 Name of chairman
12. Other F&B
22.8
19.7
Mainly Nespresso, CPW, BPW
Nespresso's growth continues at
same level
CPW had strong third quarter
BPW slows but still double-digit
% Organic Growth
% RIG
2008 9 Month Sales Presentation – 23rd October 2008
12 Name of chairman
14. Secondary Reporting Summary
Soluble coffee maintained momentum;
Powdered & Liquid a little slower
Lower growth in pricing in Milk;
Ice-cream accelerated
Frozen food accelerates;
Culinary strong everywhere
Confectionery achieves high single-digit
organic growth in all Zones
Additional pricing in PetCare; demand resilient
All Pharmaceutical constituents performing well
2008 9 Month Sales Presentation – 23rd October 2008
14 Name of chairman
15. Financial Position
The industry quot;Gold Standardquot; credit rating
Exceptionally strong balance sheet; predictable
cash-flows
Short-term debt strategy is cost efficient
Continued demand for Nestlé paper at
sub-LIBOR rates
Reduced exposure to Commercial Paper
$10.4 billion proceeds from Alcon partial disposal
Share buy-back continues at accelerated H2
level
2008 9 Month Sales Presentation – 23rd October 2008
15 Name of chairman
16. Outlook & Improved Guidance
9 month sales continue early year
momentum
Growth broad-based across Zones
Financial position strong
Capital structure further validated
in current environment
Full Year organic growth around 8%
Nestlé Model reconfirmed for 2009
2008 9 Month Sales Presentation – 23rd October 2008
16 Name of chairman
17. Appendix slides
2008 9 Month Sales Presentation – 23rd October 2008
17 Name of chairman
18. Weighted Average Exchange Rates
Jan-Dec Jan-Sept Jan-Sept Variation
CHF per 2007 2007 2008 (%)
U.S. dollar (1) 1.20 1.22 1.06 - 13.1
Euro (1) 1.64 1.64 1.61 - 1.8
£ sterling (1) 2.40 2.42 2.05 - 15.3
Real (100) 61.81 60.86 62.83 + 3.2
Mex. Peso (100) 10.96 11.14 10.06 - 9.7
Yen (100) 1.02 1.02 1.00 - 2.0
2008 9 Month Sales Presentation – 23rd October 2008
18 Name of chairman
19. Nestlé Main Agricultural Commodities Index
Grains and Oilseeds Primary Drivers in 2008
Nestle Weighted Average Main Agricultural Commodities Index
in CHF (Jan 1998=100) to end June 2008
190
Main Agricultural Commodities Index
170 Including Milk Powders
150
Price Index
130
110
90
70
50
Jan-03 Jul-03 Jan-04 Jul-04 Jan-05 Jul-05 Jan-06 Jul-06 Jan-07 Jul-07 Jan-08 Jul-08
2008 9 Month Sales Presentation – 23rd October 2008
19 Name of chairman
20. 2008 9 Month Sales
2008 9 Month Sales Presentation – 23rd October 2008
20 Name of chairman