Download to read offline

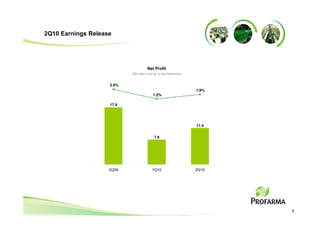
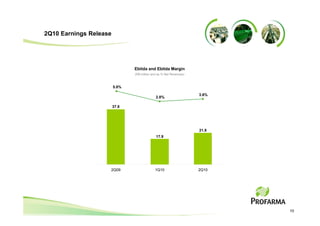
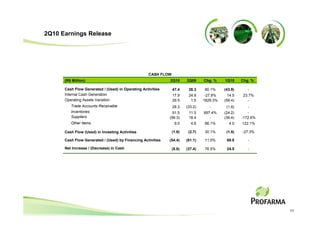
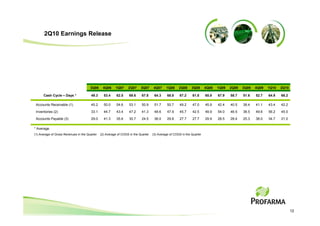
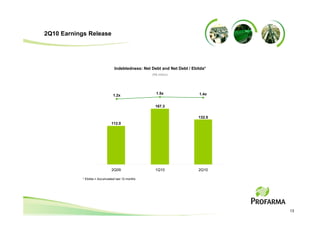

- The company's net profit increased 47.1% compared to the previous quarter, reaching R$11.4 million. - Inventory levels were reduced by 11.2 days compared to 1Q10. - Cash flow from operating activities was positive at R$47.4 million. - The ratio of net debt to EBITDA was reduced to 1.4x from 1.5x the previous quarter.


