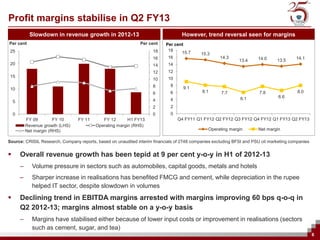
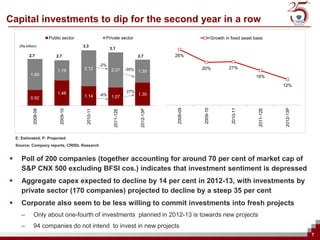
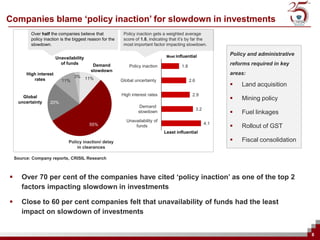
SlideShare a Scribd company logo
1 of 21
Download to read offline
CII Associations’ Council

Outlook on Indian Economy and Industry


Mukesh Agarwal
President, CRISIL Research
November 21, 2012


                                         11
Economy Overview


                   2
Current macroeconomic scenario
   Global risks on the rise
    –   Eurozone officially in recession in 2012 with 40% probability of it continuing in 2013

    –   US faces a fiscal cliff – automatic tax increases and spending cuts, which, unless halted,
        will drag it into recession in 2013 (25% probability)

    –   Reflected in weak exports and rupee volatility

   Domestic macro environment weak
    –   2012-13 GDP growth expected at 5.5%, inflation at 8.0%

    –   Investments and industrial output at standstill (0.1% growth in H1) and exports shrink
        (-6.2% growth in April-October)

    –   Fiscal and monetary policies constrained to revive growth

    –   Inflation begins to ease but to stay way above RBI’s comfort-level of 5%

   Recent reform measures lift mood and raise hopes
    –   Swift implementation/execution critical for material impact on growth


                                                                                                     3
India Outlook: 2012-13

                                           2010-11   2011-12   2012-13F

 Real GDP factor cost (y-o-y % growth)       8.4       6.5       5.5

     Agriculture                             7.0       2.8       0.0

     Industry                                7.2       3.4       3.6

     Services                                9.3       8.9       7.6

 WPI inflation (average)                     9.5       8.8       8.0

 Interest rate (10-year G-sec March end)     7.8       8.8      8.0-8.2

 Exchange rate (Rs-$ March end)             44.8      51.2       53.0

 Fiscal deficit (% of GDP)                   5.1       5.8       6.2
Note: F- Forecast
Source: Central Statistical Organization


                                                                          4
Industry Overview


                    5
Profit margins stabilise in Q2 FY13
             Slowdown in revenue growth in 2012-13                                 However, trend reversal seen for margins
Per cent                                                       Per cent    Per cent
 25                                                                  18     18
                                                                                  15.7      15.3
                                                                     16     16                       14.3              14.0              14.1
                                                                                                              13.4              13.5
 20                                                                  14     14
                                                                     12     12
 15                                                                         10
                                                                     10
                                                                     8       8
 10                                                                                9.1
                                                                     6       6              8.1      7.7                7.8               8.0
                                                                                                               6.1               6.6
    5                                                                4       4
                                                                     2       2
    0                                                                0       0
            FY 09        FY 10     FY 11      FY 12       H1 FY13                Q4 FY11 Q1 FY12 Q2 FY12 Q3 FY12 Q4 FY12 Q1 FY13 Q2 FY13
            Revenue growth (LHS)           Operating margin (RHS)
            Net margin (RHS)                                                                   Operating margin        Net margin

Source: CRISIL Research, Company reports, based on unaudited interim financials of 2748 companies excluding BFSI and PSU oil marketing companies


       Overall revenue growth has been tepid at 9 per cent y-o-y in H1 of 2012-13
        –      Volume pressure in sectors such as automobiles, capital goods, metals and hotels
        –      Sharper increase in realisations has benefited FMCG and cement, while depreciation in the rupee
               helped IT sector, despite slowdown in volumes
       Declining trend in EBITDA margins arrested with margins improving 60 bps q-o-q in
        Q2 2012-13; margins almost stable on a y-o-y basis
        –      Margins have stabilised either because of lower input costs or improvement in realisations (sectors
               such as cement, sugar, and tea)
                                                                                                                                                   6
Capital investments to dip for the second year in a row
                          Public sector                 Private sector                                          Growth in fixed asset base
      (Rs trillion)                       3.3
                                                            3.1
             2.7             2.7                                                2.7         26%

                                                      -2%
                                          2.12                           -35%                         20%                21%
                              1.19                          2.07                1.35
              1.83                                                                                                                    16%

                                                                                                                                                   12%
                              1.48                                       27%
                                          1.14        -6%                       1.35
              0.92                                          1.07


                                                                                                      2009-10
                                                                                            2008-09


                                                                                                                          2010-11


                                                                                                                                        2011-12E


                                                                                                                                                   2012-13P
                                            2010-11
                2008-09


                               2009-10


                                                              2011-12E


                                                                                 2012-13P
    E: Estimated; P: Projected
    Source: Company reports, CRISIL Research


      Poll of 200 companies (together accounting for around 70 per cent of market cap of
       S&P CNX 500 excluding BFSI cos.) indicates that investment sentiment is depressed
      Aggregate capex expected to decline by 14 per cent in 2012-13, with investments by
       private sector (170 companies) projected to decline by a steep 35 per cent
      Corporate also seem to be less willing to commit investments into fresh projects
       –        Only about one-fourth of investments planned in 2012-13 is towards new projects
       –        94 companies do not intend to invest in new projects
                                                                                                                                                              7
Companies blame ‘policy inaction’ for slowdown in investments
           Over half the companies believe that             Policy inaction gets a weighted average
           policy inaction is the biggest reason for the    score of 1.8, indicating that it’s by far the
           slowdown.                                        most important factor impacting slowdown.

                                                                                   Most influential
                                                                                                                   Policy and administrative
                         Unavailability
                           of funds         Demand             Policy inaction             1.8
                                                                                                                   reforms required in key
                                           slowdown
         High interest                                                                                             areas:
                                3% 11%
            rates           11%                            Global uncertainty                    2.6
                                                                                                                      Land acquisition
                                                           High interest rates                    2.9
       Global                                                                                                         Mining policy
     uncertainty     20%
                                                                    Demand
                                                                                                       3.2
                                                                   slowdown                                           Fuel linkages
                                                             Unavailability of
                                                                                                             4.1
                                          55%                    funds                                                Rollout of GST
                                                                                 Least influential

                               Policy inaction/ delay                                                                 Fiscal consolidation
                                   in clearances

    Source: Company reports, CRISIL Research


      Over 70 per cent of the companies have cited ‘policy inaction’ as one of the top 2
       factors impacting slowdown in investments

      Close to 60 per cent companies felt that unavailability of funds had the least
       impact on slowdown of investments


                                                                                                                                               8
Risk-wise distribution of industries
                                                                                                         CRISIL’s Credit Quality Vulnerability Matrix
 Likelihood effect of demand slowdown / increased competition


                                                                                                                                                              Crude Oil
                                                                                                                       Petroleum Product Marketing           Natural Gas
                                                                Low


                                                                                                                       Tea                                   Pharmaceuticals
                                                                                                                       NBFC                                  Hospitals
                                                                                                                                                              FMCG


                                                                                                                       Automobiles and Auto-ancillaries
                                                                                                                                                              Cement
                                                                                                                       Infrastructure (Roads,
                                                                                                                                                              Non-ferrous metals
                                                                                                                        Airports, Ports)
                                                                Medium


                                                                            Transport Operators                                                              Petroleum Refining
                                                                                                                       Power (excl. state discoms)
                                                                            Gems and Jewellery                                                               Petrochemicals
                                                                                                                       Consumer Durables
                                                                                                                                                              IT/ITeS
                                                                                                                       Telecom
                                                                                                                       Steel


                                                                            Airlines
                                                                                                                       Construction
                                                                            Real estate
                                                                                                                       Capital Goods
                                                                            Power – State Distribution Utilities
                                                                High


                                                                                                                       Hotels
                                                                            Textiles
                                                                            Shipping
                                                                            Sponge iron


                                                                                          High                                    Medium                                   Low
                                                                                                                          Consequent financial distress


                                                                                                                                                                                    9
Ratings Overview
                         No. of companies   Rated amount                             Weighted       % negative
      Sector                                                  Median rating
                               rated*        (Rs. Crore)                           average rating    outlook
Power                          47             127,608               BBB                 AA             15

Textiles                       952             47,188                B                  BB              4

Real Estate                    302             33,580                B                 BBB              3

Construction                   701            154,444               BB                   A              4

Steel Products                 534             22,405               BB                  BB              4

Steel
                               92              5,946                BB                   B              5
Intermediates
Cement                         27              13,219                A                  AA              4

Roads                          60              29,159               BBB                BBB              8

Telecom                        13              43,707                A                   A              8

Automobile                     13              33,041               AA                  AA              8

Auto Ancillaries               320             16,659               BB                  BB              4

IT Services                    29               752                 BB                   B              7
                                                   Consequent financial distress
All                           10,001          983,277              BBB                  AA              4
* As of September 30, 2012
Source: CRISIL Rating
                                                                                                                 10
                                                                                                                  10
Power: Fuel availability a key challenge
                                                                                                  25%
                       Financial Stress                                                                         Wt


                                                             Distribution of rated entities
                                                                                                  20%           avg.               Median
Low                                                High
                                                                                                  15%


   New generation projects face high risks -                                                     10%
    domestic fuel linkage and inability to pass on
    increase in cost of imported coal are key                                                      5%

    challenges
                                                                                                   0%
                                                                                                          AAA   AA        A     BBB       BB       B      C          D
   Transmission and operational generation units                                                 Power   9%    23%     15%     13%       17%     13%     0%     11%

    less vulnerable – based on fixed RoE model                              Percentage of Negative Rating Outlooks = 15%
                                                                            Source: CRISIL Ratings, No. of rated entities: 47, rated amount : Rs 127,608 Cr
   Financial health of SEBs weak; outstanding short-
    term liabilities stood at Rs. 1.9 trillion as on March                                    Non-coking coal imports for power sector to rise
    2012                                                        (mn tonnes)
                                                                800                                                                                                      30%
   Most banks hitting exposure limits                          700                                                                              23%           24%
                                                                                                                                                                         25%
                                                                600                                                                20%
                                                                                                                          17%                                            20%
                Key drivers/monitorables                        500
                                                                                                                14%
                                                                400                                                                                                      15%
                                                                                                     11%
                                                                300
                                           Approvals                                                                                                                     10%
                          Financial                             200
           Fuel                            & project                                                                                                                     5%
                          Health of                             100
        availability                      implemen-
                            SEBs
                                             tation                                           0                                                                          0%
                                                                                                  2010-11              2012-13P                2014-15P
                                                                                                   Demand        Supply         Imports          Imports share (RHS)
                                                             P:Projected
                                                             Source: CRISIL Research
                                                                                                                                                                               11
Textiles: Credit profile likely to remain weak
                    Financial Stress                                                              50%


                                                               Distribution of rated entities
                                                                                                  45%
Low                                               High                                            40%
                                                                                                  35%
                                                                                                  30%
                                                                                                                                    Wt avg.        Median
   Garment exports are expected to decline by 9-10% in                                           25%
                                                                                                  20%
    2012 (vs 19.2% growth in 2011). Domestic demand
                                                                                                  15%
    growth is also weak. Operating margins for RMG                                                10%
    players to remain constrained                                                                  5%
                                                                                                   0%
                                                                                                           AAA   AA   A       BBB    BB        B       C    D
   Power outages in South India pushing up yarn prices                                         Textiles   0%    1%   2%      13%    25%      45%     2%    13%


   Margins for spinners are expected to improve in       Percentage of Negative Rating Outlooks = 4%
    2012-13 due to high yarn prices and lower cotton      Source: CRISIL Ratings, No. of rated entities: 952, rated amount : Rs 47,188 Cr
    prices                                                 High yarn prices and low cotton prices improve the
                                                                                margins
   High leverage of spinners with gearing of over 2       300
    times constrains the credit profile
                                                           250
   Capex plans are being postponed due to the             200
    slowdown in demand                                     150
                                                           100
                Key drivers/monitorables
                                                            50
                                                              0

          Raw           Demand
                                         High
         material       from EU
                                       leverage
          costs          and US                                                                 Cotton Yarn Prices (Rs./kg)          Cotton Prices (Rs./kg)

                                                          Source: CRISIL Research

                                                                                                                                                                  12
Real Estate: Cash flow remains a concern
                  Financial Stress                                                                     45%
                                                                                                       40%


                                                             Distribution of rated entities
Low                                            High
                                                                                                       35%
                                                                                                       30%
                                                                                                                                   Wt avg.
                                                                                                       25%                                         Median
   Developers (especially small and mid-sized                                                         20%
    players) facing cash flow problems due to decline                                                  15%
    in volumes                                                                                         10%
                                                                                                        5%
   High mortgage rates exacerbating demand                                                             0%
                                                                                                                 AAA   AA     A    BBB   BB    B      C     D
    slowdown                                                                                      Real Estate    0%    3%     6%   7%    29%   43%    2%    9%


   Oversupply putting pressure on commercial lease     Percentage of Negative Rating Outlooks = 3%
                                                        Source: CRISIL Ratings, No. of rated entities: 302, rated amount : Rs 33,580 Cr
    rentals – of ~243 mn. sq ft space estimated by
    2014, only 30% likely to be absorbed                300,000                                       Absorption/Actual offtake (no. of houses)

                                                        250,000

                                                        200,000

               Key drivers/monitorables                 150,000

                                                        100,000

                                                          50,000
         Volume      Liquidity &      Asset
                                                                                              0
         growth       funding         prices                                                       2007         2008   2009    2010 2011E 2012P 2013P 2014P

                                                        * Absorption nos. correspond to Ahmedabad, Bengaluru, Chandigarh, Chennai, Hyderabad,
                                                        Kochi, Kolkata, Mumbai, NCR and Pune.

                                                        E: Estimated, P:Projected
                                                        Source: CRISIL Research
                                                                                                                                                                 13
Steel: Weak demand to keep margins range bound
                     Financial Stress
                                                                                                           40%
Low                                                     High                                               35%                      Wt


                                                                       Distribution of rated entities
                                                                                                           30%                      avg.          Median
                                                                                                           25%
   Demand growth to slow down further to 3-5 per                                                          20%
    cent in 2012-13 (5.5 per cent growth in 2011-12)                                                       15%

   HRC prices expected to decline further by 5-7 per                                                      10%
                                                                                                            5%
    cent in 2013 from around $590 per tonne in 2012                                                         0%
    due to:                                                                                                 -5%
                                                                                                                    AAA    AA    A     BBB       BB      B     C      D
      –   Weak demand and decline in raw material prices                                                SteelProd   0%     0%    1%    16%       35%    29%    1%    17%

   Operating margins for domestic players,                       Percentage of Negative Rating Outlooks = 4%
                                                                  Source: CRISIL Ratings, No. of rated entities: 534, rated amount : Rs 22,405 Cr
    especially small and mid-sized players, expected
    to remain under pressure due to:
                                                                  Margin pressure to continue
      –   Limited availability and high prices of domestic iron    Operating
          ore and non-coking coal                                                                                         2010-11     2011-12         2012-13E      2013-14P
                                                                   margins (%)

      –   Limited pricing flexibility owing to demand              With Mines                                               26             22          21-23         22-24
          moderation
                                                                   Without Mines                                            20             18          16-18         17-19
                 Key drivers/monitorables
                                                                   Small Integrated                                         15             10           7-9           7-9

                                                                   Small Non-integrated                                     5              3-4          1-3           1-3
           Raw                            Domestic
                         Demand
          material                         iron ore                Re-rollers                                               4              3-4          1-3           1-3
                          growth
           cost                             supply
                                                                  E: Estimated; P: Projected
                                                                  Source: CRISIL Research


                                                                                                                                                                               14
Steel Intermediates: Rising input costs hitting margins
                    Financial Stress                                                               45%
                                                                                                                                         Median


                                                                Distribution of rated entities
                                                                                                   40%
Low                                                 High                                           35%
                                                                                                   30%
                                                                                                   25%
                                                                                                   20%                                          Wt avg.
   Sponge iron demand forecast to grow at 2-3 per                                                 15%
    cent CAGR during 2011-12 to 2016-17                                                            10%
                                                                                                    5%
    –    Increased long steel production by large integrated                                        0%
         players using blast furnace route                                                         -5%
                                                                                                            AAA   AA       A   BBB     BB      B       C        D
                                                                                                 SteelInt   0%    0%   1%      12%    39%     15%      1%   32%

   Weak demand, intense competition and limited
    domestic availability of key inputs – iron ore and         Percentage of Negative Rating Outlooks = 5%
                                                               Source: CRISIL Ratings, No. of rated entities: 92, rated amount : Rs 5,946 Cr
    coal – will exert pressure on utilisation levels
                                                                                                 Iron ore and coking coal prices to remain firm
    –    Forward integrated sponge iron manufacturers better
                                                                                                                (Rs. per tonne)
         placed compared to standalone manufacturers
                                                                                                                                     ~6,900
                                                                                                                   6,500                               ~6,400
   Profitability is likely to remain under pressure                                              4,800
                                                                                                                   3,602             ~3,350            ~3,650
                Key drivers/monitorables                                                          2,505

                                                                                                                   2,383             ~2,500            ~2,400
                                 Demand                                                           1,667
                  Input         from end-                                                        2010-11          2011-12        2012-13 P          2013-14P
                  costs            user
                                segments                                                         Iron ore fines (62% Fe)              Iron ore lumps

                                                                                                 E-auction non-coking coal

                                                               P: Projected
                                                               Source: CRISIL Research
                                                                                                                                                                    15
Cement: Sharp price rise to offset escalation in input costs
                   Financial Stress                                                                     25%
                                                                                                                                       Medi


                                                                 Distribution of rated entities
 Low                                              High                                                  20%            Wt avg.         an


                                                                                                        15%

   Cement demand to grow moderately at 7-8 per                                                         10%

    cent in 2012-13 but operating rates to remain                                                        5%

    under pressure at 73 per cent
                                                                                                         0%
                                                                                                                 AAA   AA        A      BBB      BB        B     C         D
                                                                                                       Cement    15%   19%       22%     7%      4%        11%   0%    22%
   Pan-India average cement price to register sharp
                                                           Percentage of Negative Rating Outlooks = 4%
                                                           Source: CRISIL Ratings, No. of rated entities: 27, rated amount : Rs 13,219 Cr
    increase of 16-17 per cent y-o-y in 2012-13

   Industry operating margins to improve by 400 bps         Incremental supply to continue to outpace demand

    to 25 per cent in 2012-13 as steep price rise               94%
                                                                                                           88%         84%
    offsets escalation in input costs                                                                                                   76%           73%            73%
                                                                                                                            38
                                                                                                                                            40
                                                                                                                                                           32
                Key drivers/monitorables                                                                        26                                                     24
                                                                                                                       19                                         17
                                                                16                                        14                                          14
                    Demand growth                                                                 10                                    8
    Capacity            driven by            Energy &
    additions      infrastructure and      freight costs
                     housing growth                             FY08                                      FY09         FY10             FY11          FY12       FY13E
                                                                                                       Incremental demand …                   Incremental supply …
                                                           E: Estimated
                                                           Source: CRISIL Research
                                                                                                                                                                               16
                                                                                                                                                                                16
Construction: Growth to slow down in the near term
                    Financial Stress                                                                   40%


                                                                Distribution of rated entities
                                                                                                       35%
Low                                                  High                                                                   Wt avg.
                                                                                                       30%
                                                                                                       25%
                                                                                                                                                    Media
                                                                                                                                                    n
                                                                                                       20%
   In 2012-13, revenue growth to be sluggish due to                                                   15%
    slow pace of order execution; profitability to                                                     10%
    decline                                                                                             5%
                                                                                                        0%
   Working capital requirements have shot up due to                                                             AAA   AA      A      BBB      BB        B    C    D
                                                                                                 Construction    0%    1%     4%      19%     36%       28%   4%   8%
    increasing debtor days
                                                                Percentage of Negative Rating Outlooks = 4%
   Huge opportunity in the long term – construction            Source: CRISIL Ratings, No. of rated entities: 701, rated amount : Rs 154,444 Cr

    opportunity to nearly double over the next 5 years,
    driven by infrastructure investments
    –    Roads, irrigation and urban infrastructure to be the                                            Construction opportunity to double
         major drivers
                                                                                                                                                 Rs 19.2 tn


                Key drivers/monitorables                                                               Rs 10.9 tn                                      86%


                                                                                                                81%           1.8 x
                         Working
          Govt.           capital           Input                                                               19%                                    14%
          policy         manage-            prices                                                 2007-08E to 2011-12E                     2012-13P to 2016-17P
                           ment
                                                                                                                       Industrial     Infrastructure
                                                                                         E: Estimated, P:Projected
                                                                                         Source: CRISIL Research
                                                                                                                                                                        17
Roads: Investment to double over next 5 years
                    Financial Stress                                                                45%
                                                                                                    40%


                                                                  Distribution of rated entities
Low                                                    High                                                                            Media
                                                                                                    35%
                                                                                                                                       n
                                                                                                    30%
                                                                                                    25%                           Wt avg.
   Speed bumps in national highway awarding in                                                     20%
    2012-13                                                                                         15%
                                                                                                    10%
    –    Poor awarding in H1 2012-13 due to funding
                                                                                                     5%
         constraints & relatively less attractive projects
                                                                                                     0%
                                                                                                             AAA   AA        A   BBB      BB   B     C      D
    –    Project awarding to pick up in H2 2012-13; larger                                          Roads    3%    3%       8%   42%     28%   8%    0%     7%

         share expected to be bid on EPC basis                   Percentage of Negative Rating Outlooks = 8%
                                                                 Source: CRISIL Ratings, No. of rated entities: 60, rated amount : Rs 29,159 Cr

   Investment growth to be driven by national
    highways                                                                                           National highway awarding declines
    –    We expect an investment of Rs. 7 trillion over next 5                (km)                                                     7,406
         years in roads                                                                                                                             6,417

                                                                                                                    5,143

                 Key drivers/monitorables
                                                                                                    3,214


          Govt.            Land              Traffic
          policy         acquisition         growth                                                2009-10         2010-11         2011-12         2012-13
                                                                                                                                               CRISIL Research
                                                                                                                                                  estimate

                                                                 Source: NHAI, CRISIL Research

                                                                                                                                                                 18
Automobiles: Margins to remain stable in 2012-13
                      Financial Stress                                                                 45%                  Median
                                                                                                       40%


                                                                     Distribution of rated entities
    Low                                                High                                            35%
                                                                                                                           Wt avg.
                                                                                                       30%
                                                                                                       25%

    Sales growth to moderate further to 7-8 per cent in                                               20%
                                                                                                       15%
     2012-13 from ~13% in 2011-12                                                                      10%
                                                                                                        5%
     –    Car sales to grow at a sedate pace due to high cost of                                        0%
          ownership and production disruptions; UVs to                                                  -5%
                                                                                                               AAA     AA          A       BBB   BB       B     C         D
          continue high growth driven by new model launches                                             Auto   15%     38%         8%      15%   8%       15%   0%        0%
          and higher availability of diesel models
                                                                   Percentage of Negative Rating Outlooks = 8%
                                                                   Source: CRISIL Ratings, No. of rated entities: 13, rated amount : Rs 33,041 Cr
     –    Scooters will continue to drive two-wheeler demand

     –    Sluggish MHCV sales due to economic slowdown to                                             Auto growth rate to moderate further in 2012-13
          be offset by continuing growth momentum in LCVs           (in per
                                                                     cent)
                                                                                                                                                 37
                                                                     40
    Lower input cost in 2012-13 to be offset by lower              30                                   26
                                                                                                                              29
                                                                                                                                                                     25
                                                                                                                                                                          30

     capacity utilisation and higher marketing expenses             20                                         14
                                                                                                                                         8-10         9
                                                                                                                                                                               13-15
                                                                                                                    8-10             5
                                                                    10
                     Key Drivers/Monitorables                                     0
                                                                   -10
                                                                   -20                                                                        (12)-(15)
          Extent of                                                                                    Two wheelers           Passenger    MHCV goods   LCV goods
                              Fuel          Interest
          economic                                                                                                             vehicles
                             Prices          rates                                                                         2010-11    2011-12  2012-13P
          slowdown
                                                                    P:Projected
                                                                    Source: CRISIL Research
                                                                                                                                                                                       19
Auto ancillaries: Growth to moderate in line with slowing OEM
demand
                       Financial Stress                                                                     35%


                                                                   Distribution of rated entities
    Low                                                 High                                                30%
                                                                                                                                                Wt avg.
                                                                                                            25%
                                                                                                                                                       Media
                                                                                                            20%
                                                                                                                                                       n
    Growth to slow further to 9-11 per cent in 2012-13,
                                                                                                            15%

     in line with deceleration in growth across all OEM                                                     10%

                                                                                                              5%
     segments
                                                                                                              0%
                                                                                                                     AAA     AA   A      BBB      BB      B       C      D

    Export growth to remain healthy with increasing                                                      AutoAnci    0%     3%   11%    31%     26%      19%     1%     9%

                                                                   Percentage of Negative Rating Outlooks = 4%
     penetration of domestic players                               Source: CRISIL Ratings, No. of rated entities: 320, rated amount : Rs 16,659 Cr


    Margins to remain stable in 2012-13
                                                                                                      OEMs to weigh down auto component growth
     –    Lower input costs will be offset by low OEM demand            (Rs billion)
          and limited pricing flexibility in replacement market.              2500                                                                              2,355
                                                                                                                                        2,146
                                                                              2000                                   1,868
                    Key Drivers/Monitorables
                                                                              1500

                                                                              1000
                 Moderation
                     in                                                                             500
                                    Input costs
                 automobile
                                                                                                      0
                  demand                                                                                        2010-11E              2011-12E                2012-13P
                                                                                                                           OEM    Replacement          Exports
                                                                   E: Estimated, P:Projected
                                                                   Source: CRISIL Research
                                                                                                                                                                              20
CRISIL Limited
www.crisil.com


                 21

More Related Content

What's hot

ArcelorMittal Q3 2008 results
ArcelorMittal Q3 2008 resultsArcelorMittal Q3 2008 results
ArcelorMittal Q3 2008 resultsearningsreport
 
David Rubenstein's SuperReturn Presentation
David Rubenstein's SuperReturn PresentationDavid Rubenstein's SuperReturn Presentation
David Rubenstein's SuperReturn Presentationdanprimack
 
Residential property market overview 2Q 2012
Residential property market overview 2Q 2012Residential property market overview 2Q 2012
Residential property market overview 2Q 2012Surabhi Arora, MRICS
 
Skf Internet Presentation Q42009
Skf Internet Presentation Q42009Skf Internet Presentation Q42009
Skf Internet Presentation Q42009SKF
 
LinkedIn's Q3 Earnings Call
LinkedIn's Q3 Earnings CallLinkedIn's Q3 Earnings Call
LinkedIn's Q3 Earnings CallLinkedIn
 
Kim Marti's presentation at SteelOrbis Spring '12 Conference & 66th IREPAS Me...
Kim Marti's presentation at SteelOrbis Spring '12 Conference & 66th IREPAS Me...Kim Marti's presentation at SteelOrbis Spring '12 Conference & 66th IREPAS Me...
Kim Marti's presentation at SteelOrbis Spring '12 Conference & 66th IREPAS Me...steelorbis
 
Meet Management 2012 Investor Handout
Meet Management 2012 Investor HandoutMeet Management 2012 Investor Handout
Meet Management 2012 Investor HandoutBayer
 
W. R. berkley annual reports 2005
W. R. berkley annual reports 2005W. R. berkley annual reports 2005
W. R. berkley annual reports 2005finance37
 
Unique case of Latvia: internal adjustment
Unique case of Latvia: internal adjustmentUnique case of Latvia: internal adjustment
Unique case of Latvia: internal adjustmentRoberts Zīle
 
SEB Facts And Figures January March 2008
SEB Facts And Figures January March 2008SEB Facts And Figures January March 2008
SEB Facts And Figures January March 2008SEBgroup
 
Profarma apresentação 3 q11 final
Profarma apresentação 3 q11 finalProfarma apresentação 3 q11 final
Profarma apresentação 3 q11 finalProfarma
 
E-UpDates-November11—Global and Indian Economic Indicators
E-UpDates-November11—Global and Indian Economic IndicatorsE-UpDates-November11—Global and Indian Economic Indicators
E-UpDates-November11—Global and Indian Economic IndicatorsEcofin Surge
 
110212 divulgação de resultados 4 t10 ingles
110212   divulgação de resultados 4 t10 ingles110212   divulgação de resultados 4 t10 ingles
110212 divulgação de resultados 4 t10 inglesMultiplus
 
SEB Ubs Nordic Financials Sept 2008
SEB Ubs Nordic Financials Sept 2008SEB Ubs Nordic Financials Sept 2008
SEB Ubs Nordic Financials Sept 2008SEBgroup
 

What's hot (19)

ArcelorMittal Q3 2008 results
ArcelorMittal Q3 2008 resultsArcelorMittal Q3 2008 results
ArcelorMittal Q3 2008 results
 
4Q12 Presentation
4Q12 Presentation4Q12 Presentation
4Q12 Presentation
 
David Rubenstein's SuperReturn Presentation
David Rubenstein's SuperReturn PresentationDavid Rubenstein's SuperReturn Presentation
David Rubenstein's SuperReturn Presentation
 
Residential property market overview 2Q 2012
Residential property market overview 2Q 2012Residential property market overview 2Q 2012
Residential property market overview 2Q 2012
 
Skf Internet Presentation Q42009
Skf Internet Presentation Q42009Skf Internet Presentation Q42009
Skf Internet Presentation Q42009
 
LinkedIn's Q3 Earnings Call
LinkedIn's Q3 Earnings CallLinkedIn's Q3 Earnings Call
LinkedIn's Q3 Earnings Call
 
Kim Marti's presentation at SteelOrbis Spring '12 Conference & 66th IREPAS Me...
Kim Marti's presentation at SteelOrbis Spring '12 Conference & 66th IREPAS Me...Kim Marti's presentation at SteelOrbis Spring '12 Conference & 66th IREPAS Me...
Kim Marti's presentation at SteelOrbis Spring '12 Conference & 66th IREPAS Me...
 
Meet Management 2012 Investor Handout
Meet Management 2012 Investor HandoutMeet Management 2012 Investor Handout
Meet Management 2012 Investor Handout
 
W. R. berkley annual reports 2005
W. R. berkley annual reports 2005W. R. berkley annual reports 2005
W. R. berkley annual reports 2005
 
2007 Results
2007 Results2007 Results
2007 Results
 
Unique case of Latvia: internal adjustment
Unique case of Latvia: internal adjustmentUnique case of Latvia: internal adjustment
Unique case of Latvia: internal adjustment
 
SEB Facts And Figures January March 2008
SEB Facts And Figures January March 2008SEB Facts And Figures January March 2008
SEB Facts And Figures January March 2008
 
Recession & Recovery in Missouri and the U.S.
Recession & Recovery in Missouri and the U.S.Recession & Recovery in Missouri and the U.S.
Recession & Recovery in Missouri and the U.S.
 
Profarma apresentação 3 q11 final
Profarma apresentação 3 q11 finalProfarma apresentação 3 q11 final
Profarma apresentação 3 q11 final
 
E-UpDates-November11—Global and Indian Economic Indicators
E-UpDates-November11—Global and Indian Economic IndicatorsE-UpDates-November11—Global and Indian Economic Indicators
E-UpDates-November11—Global and Indian Economic Indicators
 
Chris Caton's Economic Preview for AIM NSW & ACT, 2013
Chris Caton's Economic Preview for AIM NSW & ACT, 2013Chris Caton's Economic Preview for AIM NSW & ACT, 2013
Chris Caton's Economic Preview for AIM NSW & ACT, 2013
 
110212 divulgação de resultados 4 t10 ingles
110212   divulgação de resultados 4 t10 ingles110212   divulgação de resultados 4 t10 ingles
110212 divulgação de resultados 4 t10 ingles
 
4Q08 Results
4Q08 Results4Q08 Results
4Q08 Results
 
SEB Ubs Nordic Financials Sept 2008
SEB Ubs Nordic Financials Sept 2008SEB Ubs Nordic Financials Sept 2008
SEB Ubs Nordic Financials Sept 2008
 

Viewers also liked

6 outreach positive contributions of plastics
6 outreach positive contributions of plastics6 outreach positive contributions of plastics
6 outreach positive contributions of plasticsAIPMA
 
5 sustainability
5 sustainability5 sustainability
5 sustainabilityAIPMA
 
теорема пифагора история
теорема пифагора историятеорема пифагора история
теорема пифагора историяmilisa234
 
3 chemicals in plastics
3 chemicals in plastics3 chemicals in plastics
3 chemicals in plasticsAIPMA
 
Pallavi shroff
Pallavi shroffPallavi shroff
Pallavi shroffAIPMA
 
4 ban and deselection
4 ban and deselection4 ban and deselection
4 ban and deselectionAIPMA
 

Viewers also liked (6)

6 outreach positive contributions of plastics
6 outreach positive contributions of plastics6 outreach positive contributions of plastics
6 outreach positive contributions of plastics
 
5 sustainability
5 sustainability5 sustainability
5 sustainability
 
теорема пифагора история
теорема пифагора историятеорема пифагора история
теорема пифагора история
 
3 chemicals in plastics
3 chemicals in plastics3 chemicals in plastics
3 chemicals in plastics
 
Pallavi shroff
Pallavi shroffPallavi shroff
Pallavi shroff
 
4 ban and deselection
4 ban and deselection4 ban and deselection
4 ban and deselection
 

Similar to Mukesh agwl

1Q 2012 conference call Apr 26 2012
1Q 2012 conference call Apr 26 20121Q 2012 conference call Apr 26 2012
1Q 2012 conference call Apr 26 2012WEG
 
WEG Q2 2012 Conference Call
WEG Q2 2012 Conference CallWEG Q2 2012 Conference Call
WEG Q2 2012 Conference CallWEG
 
Profarma 4 q12
Profarma 4 q12Profarma 4 q12
Profarma 4 q12Profarma
 
Abch results presentation 2012
Abch results presentation 2012Abch results presentation 2012
Abch results presentation 2012wgjlubbe
 
Tjif Budget Overview 2011
Tjif Budget Overview 2011Tjif Budget Overview 2011
Tjif Budget Overview 2011Kausar Fecto
 
Korea Fund, Inc. Second Quarter 2012
Korea Fund, Inc. Second Quarter 2012Korea Fund, Inc. Second Quarter 2012
Korea Fund, Inc. Second Quarter 2012Company Spotlight
 
WEG Q3 2012 Conference Call
WEG Q3 2012 Conference CallWEG Q3 2012 Conference Call
WEG Q3 2012 Conference CallWEG
 
Presentation aes eletropaulo_2_q12_sem discurso_v3
Presentation aes eletropaulo_2_q12_sem discurso_v3Presentation aes eletropaulo_2_q12_sem discurso_v3
Presentation aes eletropaulo_2_q12_sem discurso_v3AES Eletropaulo
 
E-Updates_Apr12—Indian & Global Economic Indicators
E-Updates_Apr12—Indian & Global Economic IndicatorsE-Updates_Apr12—Indian & Global Economic Indicators
E-Updates_Apr12—Indian & Global Economic IndicatorsEcofin Surge
 
Profarma 3Q12
Profarma 3Q12Profarma 3Q12
Profarma 3Q12Profarma
 
HMS Group Fact Sheet 1Q 2011
HMS Group Fact Sheet 1Q 2011HMS Group Fact Sheet 1Q 2011
HMS Group Fact Sheet 1Q 2011HMS Group
 
Stora Enso Interim Review Q2 2012
Stora Enso Interim Review Q2 2012Stora Enso Interim Review Q2 2012
Stora Enso Interim Review Q2 2012Stora Enso
 

Similar to Mukesh agwl (20)

1Q 2012 conference call Apr 26 2012
1Q 2012 conference call Apr 26 20121Q 2012 conference call Apr 26 2012
1Q 2012 conference call Apr 26 2012
 
WEG Q2 2012 Conference Call
WEG Q2 2012 Conference CallWEG Q2 2012 Conference Call
WEG Q2 2012 Conference Call
 
Growth Week 2011: Country Session 7 - Bangladesh
Growth Week 2011: Country Session 7 - BangladeshGrowth Week 2011: Country Session 7 - Bangladesh
Growth Week 2011: Country Session 7 - Bangladesh
 
Profarma 4 q12
Profarma 4 q12Profarma 4 q12
Profarma 4 q12
 
SERI 2011 Korea Economic Forum
SERI 2011 Korea Economic ForumSERI 2011 Korea Economic Forum
SERI 2011 Korea Economic Forum
 
Korea's Strategy in a Changing Global Economy
Korea's Strategy in a Changing Global EconomyKorea's Strategy in a Changing Global Economy
Korea's Strategy in a Changing Global Economy
 
Korea Supplement
Korea SupplementKorea Supplement
Korea Supplement
 
Korea fund4q presentation
Korea fund4q presentationKorea fund4q presentation
Korea fund4q presentation
 
Abch results presentation 2012
Abch results presentation 2012Abch results presentation 2012
Abch results presentation 2012
 
Tjif Budget Overview 2011
Tjif Budget Overview 2011Tjif Budget Overview 2011
Tjif Budget Overview 2011
 
Korea Fund, Inc. Second Quarter 2012
Korea Fund, Inc. Second Quarter 2012Korea Fund, Inc. Second Quarter 2012
Korea Fund, Inc. Second Quarter 2012
 
Presentation 2Q12
Presentation 2Q12Presentation 2Q12
Presentation 2Q12
 
WEG Q3 2012 Conference Call
WEG Q3 2012 Conference CallWEG Q3 2012 Conference Call
WEG Q3 2012 Conference Call
 
Presentation aes eletropaulo_2_q12_sem discurso_v3
Presentation aes eletropaulo_2_q12_sem discurso_v3Presentation aes eletropaulo_2_q12_sem discurso_v3
Presentation aes eletropaulo_2_q12_sem discurso_v3
 
Apres Call 4Q08
Apres Call 4Q08Apres Call 4Q08
Apres Call 4Q08
 
Economic Survey of India 2011-12 - A FICCI Analysis
Economic Survey of India 2011-12 - A FICCI AnalysisEconomic Survey of India 2011-12 - A FICCI Analysis
Economic Survey of India 2011-12 - A FICCI Analysis
 
E-Updates_Apr12—Indian & Global Economic Indicators
E-Updates_Apr12—Indian & Global Economic IndicatorsE-Updates_Apr12—Indian & Global Economic Indicators
E-Updates_Apr12—Indian & Global Economic Indicators
 
Profarma 3Q12
Profarma 3Q12Profarma 3Q12
Profarma 3Q12
 
HMS Group Fact Sheet 1Q 2011
HMS Group Fact Sheet 1Q 2011HMS Group Fact Sheet 1Q 2011
HMS Group Fact Sheet 1Q 2011
 
Stora Enso Interim Review Q2 2012
Stora Enso Interim Review Q2 2012Stora Enso Interim Review Q2 2012
Stora Enso Interim Review Q2 2012
 

Mukesh agwl

  • 1. CII Associations’ Council Outlook on Indian Economy and Industry Mukesh Agarwal President, CRISIL Research November 21, 2012 11
  • 3. Current macroeconomic scenario  Global risks on the rise – Eurozone officially in recession in 2012 with 40% probability of it continuing in 2013 – US faces a fiscal cliff – automatic tax increases and spending cuts, which, unless halted, will drag it into recession in 2013 (25% probability) – Reflected in weak exports and rupee volatility  Domestic macro environment weak – 2012-13 GDP growth expected at 5.5%, inflation at 8.0% – Investments and industrial output at standstill (0.1% growth in H1) and exports shrink (-6.2% growth in April-October) – Fiscal and monetary policies constrained to revive growth – Inflation begins to ease but to stay way above RBI’s comfort-level of 5%  Recent reform measures lift mood and raise hopes – Swift implementation/execution critical for material impact on growth 3
  • 4. India Outlook: 2012-13 2010-11 2011-12 2012-13F Real GDP factor cost (y-o-y % growth) 8.4 6.5 5.5 Agriculture 7.0 2.8 0.0 Industry 7.2 3.4 3.6 Services 9.3 8.9 7.6 WPI inflation (average) 9.5 8.8 8.0 Interest rate (10-year G-sec March end) 7.8 8.8 8.0-8.2 Exchange rate (Rs-$ March end) 44.8 51.2 53.0 Fiscal deficit (% of GDP) 5.1 5.8 6.2 Note: F- Forecast Source: Central Statistical Organization 4
  • 6. Profit margins stabilise in Q2 FY13 Slowdown in revenue growth in 2012-13 However, trend reversal seen for margins Per cent Per cent Per cent 25 18 18 15.7 15.3 16 16 14.3 14.0 14.1 13.4 13.5 20 14 14 12 12 15 10 10 8 8 10 9.1 6 6 8.1 7.7 7.8 8.0 6.1 6.6 5 4 4 2 2 0 0 0 FY 09 FY 10 FY 11 FY 12 H1 FY13 Q4 FY11 Q1 FY12 Q2 FY12 Q3 FY12 Q4 FY12 Q1 FY13 Q2 FY13 Revenue growth (LHS) Operating margin (RHS) Net margin (RHS) Operating margin Net margin Source: CRISIL Research, Company reports, based on unaudited interim financials of 2748 companies excluding BFSI and PSU oil marketing companies  Overall revenue growth has been tepid at 9 per cent y-o-y in H1 of 2012-13 – Volume pressure in sectors such as automobiles, capital goods, metals and hotels – Sharper increase in realisations has benefited FMCG and cement, while depreciation in the rupee helped IT sector, despite slowdown in volumes  Declining trend in EBITDA margins arrested with margins improving 60 bps q-o-q in Q2 2012-13; margins almost stable on a y-o-y basis – Margins have stabilised either because of lower input costs or improvement in realisations (sectors such as cement, sugar, and tea) 6
  • 7. Capital investments to dip for the second year in a row Public sector Private sector Growth in fixed asset base (Rs trillion) 3.3 3.1 2.7 2.7 2.7 26% -2% 2.12 -35% 20% 21% 1.19 2.07 1.35 1.83 16% 12% 1.48 27% 1.14 -6% 1.35 0.92 1.07 2009-10 2008-09 2010-11 2011-12E 2012-13P 2010-11 2008-09 2009-10 2011-12E 2012-13P E: Estimated; P: Projected Source: Company reports, CRISIL Research  Poll of 200 companies (together accounting for around 70 per cent of market cap of S&P CNX 500 excluding BFSI cos.) indicates that investment sentiment is depressed  Aggregate capex expected to decline by 14 per cent in 2012-13, with investments by private sector (170 companies) projected to decline by a steep 35 per cent  Corporate also seem to be less willing to commit investments into fresh projects – Only about one-fourth of investments planned in 2012-13 is towards new projects – 94 companies do not intend to invest in new projects 7
  • 8. Companies blame ‘policy inaction’ for slowdown in investments Over half the companies believe that Policy inaction gets a weighted average policy inaction is the biggest reason for the score of 1.8, indicating that it’s by far the slowdown. most important factor impacting slowdown. Most influential Policy and administrative Unavailability of funds Demand Policy inaction 1.8 reforms required in key slowdown High interest areas: 3% 11% rates 11% Global uncertainty 2.6  Land acquisition High interest rates 2.9 Global  Mining policy uncertainty 20% Demand 3.2 slowdown  Fuel linkages Unavailability of 4.1 55% funds  Rollout of GST Least influential Policy inaction/ delay  Fiscal consolidation in clearances Source: Company reports, CRISIL Research  Over 70 per cent of the companies have cited ‘policy inaction’ as one of the top 2 factors impacting slowdown in investments  Close to 60 per cent companies felt that unavailability of funds had the least impact on slowdown of investments 8
  • 9. Risk-wise distribution of industries CRISIL’s Credit Quality Vulnerability Matrix Likelihood effect of demand slowdown / increased competition  Crude Oil  Petroleum Product Marketing  Natural Gas Low  Tea  Pharmaceuticals  NBFC  Hospitals  FMCG  Automobiles and Auto-ancillaries  Cement  Infrastructure (Roads,  Non-ferrous metals Airports, Ports) Medium  Transport Operators  Petroleum Refining  Power (excl. state discoms)  Gems and Jewellery  Petrochemicals  Consumer Durables  IT/ITeS  Telecom  Steel  Airlines  Construction  Real estate  Capital Goods  Power – State Distribution Utilities High  Hotels  Textiles  Shipping  Sponge iron High Medium Low Consequent financial distress 9
  • 10. Ratings Overview No. of companies Rated amount Weighted % negative Sector Median rating rated* (Rs. Crore) average rating outlook Power 47 127,608 BBB AA 15 Textiles 952 47,188 B BB 4 Real Estate 302 33,580 B BBB 3 Construction 701 154,444 BB A 4 Steel Products 534 22,405 BB BB 4 Steel 92 5,946 BB B 5 Intermediates Cement 27 13,219 A AA 4 Roads 60 29,159 BBB BBB 8 Telecom 13 43,707 A A 8 Automobile 13 33,041 AA AA 8 Auto Ancillaries 320 16,659 BB BB 4 IT Services 29 752 BB B 7 Consequent financial distress All 10,001 983,277 BBB AA 4 * As of September 30, 2012 Source: CRISIL Rating 10 10
  • 11. Power: Fuel availability a key challenge 25% Financial Stress Wt Distribution of rated entities 20% avg. Median Low High 15%  New generation projects face high risks - 10% domestic fuel linkage and inability to pass on increase in cost of imported coal are key 5% challenges 0% AAA AA A BBB BB B C D  Transmission and operational generation units Power 9% 23% 15% 13% 17% 13% 0% 11% less vulnerable – based on fixed RoE model Percentage of Negative Rating Outlooks = 15% Source: CRISIL Ratings, No. of rated entities: 47, rated amount : Rs 127,608 Cr  Financial health of SEBs weak; outstanding short- term liabilities stood at Rs. 1.9 trillion as on March Non-coking coal imports for power sector to rise 2012 (mn tonnes) 800 30%  Most banks hitting exposure limits 700 23% 24% 25% 600 20% 17% 20% Key drivers/monitorables 500 14% 400 15% 11% 300 Approvals 10% Financial 200 Fuel & project 5% Health of 100 availability implemen- SEBs tation 0 0% 2010-11 2012-13P 2014-15P Demand Supply Imports Imports share (RHS) P:Projected Source: CRISIL Research 11
  • 12. Textiles: Credit profile likely to remain weak Financial Stress 50% Distribution of rated entities 45% Low High 40% 35% 30% Wt avg. Median  Garment exports are expected to decline by 9-10% in 25% 20% 2012 (vs 19.2% growth in 2011). Domestic demand 15% growth is also weak. Operating margins for RMG 10% players to remain constrained 5% 0% AAA AA A BBB BB B C D  Power outages in South India pushing up yarn prices Textiles 0% 1% 2% 13% 25% 45% 2% 13%  Margins for spinners are expected to improve in Percentage of Negative Rating Outlooks = 4% 2012-13 due to high yarn prices and lower cotton Source: CRISIL Ratings, No. of rated entities: 952, rated amount : Rs 47,188 Cr prices High yarn prices and low cotton prices improve the margins  High leverage of spinners with gearing of over 2 300 times constrains the credit profile 250  Capex plans are being postponed due to the 200 slowdown in demand 150 100 Key drivers/monitorables 50 0 Raw Demand High material from EU leverage costs and US Cotton Yarn Prices (Rs./kg) Cotton Prices (Rs./kg) Source: CRISIL Research 12
  • 13. Real Estate: Cash flow remains a concern Financial Stress 45% 40% Distribution of rated entities Low High 35% 30% Wt avg. 25% Median  Developers (especially small and mid-sized 20% players) facing cash flow problems due to decline 15% in volumes 10% 5%  High mortgage rates exacerbating demand 0% AAA AA A BBB BB B C D slowdown Real Estate 0% 3% 6% 7% 29% 43% 2% 9%  Oversupply putting pressure on commercial lease Percentage of Negative Rating Outlooks = 3% Source: CRISIL Ratings, No. of rated entities: 302, rated amount : Rs 33,580 Cr rentals – of ~243 mn. sq ft space estimated by 2014, only 30% likely to be absorbed 300,000 Absorption/Actual offtake (no. of houses) 250,000 200,000 Key drivers/monitorables 150,000 100,000 50,000 Volume Liquidity & Asset 0 growth funding prices 2007 2008 2009 2010 2011E 2012P 2013P 2014P * Absorption nos. correspond to Ahmedabad, Bengaluru, Chandigarh, Chennai, Hyderabad, Kochi, Kolkata, Mumbai, NCR and Pune. E: Estimated, P:Projected Source: CRISIL Research 13
  • 14. Steel: Weak demand to keep margins range bound Financial Stress 40% Low High 35% Wt Distribution of rated entities 30% avg. Median 25%  Demand growth to slow down further to 3-5 per 20% cent in 2012-13 (5.5 per cent growth in 2011-12) 15%  HRC prices expected to decline further by 5-7 per 10% 5% cent in 2013 from around $590 per tonne in 2012 0% due to: -5% AAA AA A BBB BB B C D – Weak demand and decline in raw material prices SteelProd 0% 0% 1% 16% 35% 29% 1% 17%  Operating margins for domestic players, Percentage of Negative Rating Outlooks = 4% Source: CRISIL Ratings, No. of rated entities: 534, rated amount : Rs 22,405 Cr especially small and mid-sized players, expected to remain under pressure due to: Margin pressure to continue – Limited availability and high prices of domestic iron Operating ore and non-coking coal 2010-11 2011-12 2012-13E 2013-14P margins (%) – Limited pricing flexibility owing to demand With Mines 26 22 21-23 22-24 moderation Without Mines 20 18 16-18 17-19 Key drivers/monitorables Small Integrated 15 10 7-9 7-9 Small Non-integrated 5 3-4 1-3 1-3 Raw Domestic Demand material iron ore Re-rollers 4 3-4 1-3 1-3 growth cost supply E: Estimated; P: Projected Source: CRISIL Research 14
  • 15. Steel Intermediates: Rising input costs hitting margins Financial Stress 45% Median Distribution of rated entities 40% Low High 35% 30% 25% 20% Wt avg.  Sponge iron demand forecast to grow at 2-3 per 15% cent CAGR during 2011-12 to 2016-17 10% 5% – Increased long steel production by large integrated 0% players using blast furnace route -5% AAA AA A BBB BB B C D SteelInt 0% 0% 1% 12% 39% 15% 1% 32%  Weak demand, intense competition and limited domestic availability of key inputs – iron ore and Percentage of Negative Rating Outlooks = 5% Source: CRISIL Ratings, No. of rated entities: 92, rated amount : Rs 5,946 Cr coal – will exert pressure on utilisation levels Iron ore and coking coal prices to remain firm – Forward integrated sponge iron manufacturers better (Rs. per tonne) placed compared to standalone manufacturers ~6,900 6,500 ~6,400  Profitability is likely to remain under pressure 4,800 3,602 ~3,350 ~3,650 Key drivers/monitorables 2,505 2,383 ~2,500 ~2,400 Demand 1,667 Input from end- 2010-11 2011-12 2012-13 P 2013-14P costs user segments Iron ore fines (62% Fe) Iron ore lumps E-auction non-coking coal P: Projected Source: CRISIL Research 15
  • 16. Cement: Sharp price rise to offset escalation in input costs Financial Stress 25% Medi Distribution of rated entities Low High 20% Wt avg. an 15%  Cement demand to grow moderately at 7-8 per 10% cent in 2012-13 but operating rates to remain 5% under pressure at 73 per cent 0% AAA AA A BBB BB B C D Cement 15% 19% 22% 7% 4% 11% 0% 22%  Pan-India average cement price to register sharp Percentage of Negative Rating Outlooks = 4% Source: CRISIL Ratings, No. of rated entities: 27, rated amount : Rs 13,219 Cr increase of 16-17 per cent y-o-y in 2012-13  Industry operating margins to improve by 400 bps Incremental supply to continue to outpace demand to 25 per cent in 2012-13 as steep price rise 94% 88% 84% offsets escalation in input costs 76% 73% 73% 38 40 32 Key drivers/monitorables 26 24 19 17 16 14 14 Demand growth 10 8 Capacity driven by Energy & additions infrastructure and freight costs housing growth FY08 FY09 FY10 FY11 FY12 FY13E Incremental demand … Incremental supply … E: Estimated Source: CRISIL Research 16 16
  • 17. Construction: Growth to slow down in the near term Financial Stress 40% Distribution of rated entities 35% Low High Wt avg. 30% 25% Media n 20%  In 2012-13, revenue growth to be sluggish due to 15% slow pace of order execution; profitability to 10% decline 5% 0%  Working capital requirements have shot up due to AAA AA A BBB BB B C D Construction 0% 1% 4% 19% 36% 28% 4% 8% increasing debtor days Percentage of Negative Rating Outlooks = 4%  Huge opportunity in the long term – construction Source: CRISIL Ratings, No. of rated entities: 701, rated amount : Rs 154,444 Cr opportunity to nearly double over the next 5 years, driven by infrastructure investments – Roads, irrigation and urban infrastructure to be the Construction opportunity to double major drivers Rs 19.2 tn Key drivers/monitorables Rs 10.9 tn 86% 81% 1.8 x Working Govt. capital Input 19% 14% policy manage- prices 2007-08E to 2011-12E 2012-13P to 2016-17P ment Industrial Infrastructure E: Estimated, P:Projected Source: CRISIL Research 17
  • 18. Roads: Investment to double over next 5 years Financial Stress 45% 40% Distribution of rated entities Low High Media 35% n 30% 25% Wt avg.  Speed bumps in national highway awarding in 20% 2012-13 15% 10% – Poor awarding in H1 2012-13 due to funding 5% constraints & relatively less attractive projects 0% AAA AA A BBB BB B C D – Project awarding to pick up in H2 2012-13; larger Roads 3% 3% 8% 42% 28% 8% 0% 7% share expected to be bid on EPC basis Percentage of Negative Rating Outlooks = 8% Source: CRISIL Ratings, No. of rated entities: 60, rated amount : Rs 29,159 Cr  Investment growth to be driven by national highways National highway awarding declines – We expect an investment of Rs. 7 trillion over next 5 (km) 7,406 years in roads 6,417 5,143 Key drivers/monitorables 3,214 Govt. Land Traffic policy acquisition growth 2009-10 2010-11 2011-12 2012-13 CRISIL Research estimate Source: NHAI, CRISIL Research 18
  • 19. Automobiles: Margins to remain stable in 2012-13 Financial Stress 45% Median 40% Distribution of rated entities Low High 35% Wt avg. 30% 25%  Sales growth to moderate further to 7-8 per cent in 20% 15% 2012-13 from ~13% in 2011-12 10% 5% – Car sales to grow at a sedate pace due to high cost of 0% ownership and production disruptions; UVs to -5% AAA AA A BBB BB B C D continue high growth driven by new model launches Auto 15% 38% 8% 15% 8% 15% 0% 0% and higher availability of diesel models Percentage of Negative Rating Outlooks = 8% Source: CRISIL Ratings, No. of rated entities: 13, rated amount : Rs 33,041 Cr – Scooters will continue to drive two-wheeler demand – Sluggish MHCV sales due to economic slowdown to Auto growth rate to moderate further in 2012-13 be offset by continuing growth momentum in LCVs (in per cent) 37 40  Lower input cost in 2012-13 to be offset by lower 30 26 29 25 30 capacity utilisation and higher marketing expenses 20 14 8-10 9 13-15 8-10 5 10 Key Drivers/Monitorables 0 -10 -20 (12)-(15) Extent of Two wheelers Passenger MHCV goods LCV goods Fuel Interest economic vehicles Prices rates 2010-11 2011-12 2012-13P slowdown P:Projected Source: CRISIL Research 19
  • 20. Auto ancillaries: Growth to moderate in line with slowing OEM demand Financial Stress 35% Distribution of rated entities Low High 30% Wt avg. 25% Media 20% n  Growth to slow further to 9-11 per cent in 2012-13, 15% in line with deceleration in growth across all OEM 10% 5% segments 0% AAA AA A BBB BB B C D  Export growth to remain healthy with increasing AutoAnci 0% 3% 11% 31% 26% 19% 1% 9% Percentage of Negative Rating Outlooks = 4% penetration of domestic players Source: CRISIL Ratings, No. of rated entities: 320, rated amount : Rs 16,659 Cr  Margins to remain stable in 2012-13 OEMs to weigh down auto component growth – Lower input costs will be offset by low OEM demand (Rs billion) and limited pricing flexibility in replacement market. 2500 2,355 2,146 2000 1,868 Key Drivers/Monitorables 1500 1000 Moderation in 500 Input costs automobile 0 demand 2010-11E 2011-12E 2012-13P OEM Replacement Exports E: Estimated, P:Projected Source: CRISIL Research 20