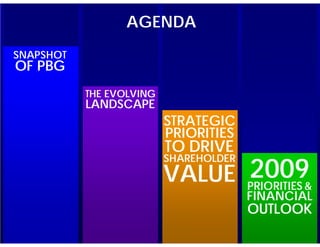
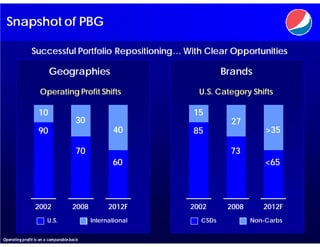
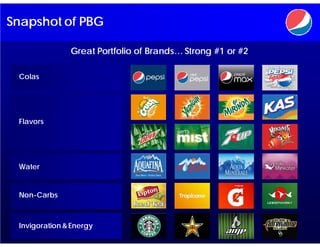
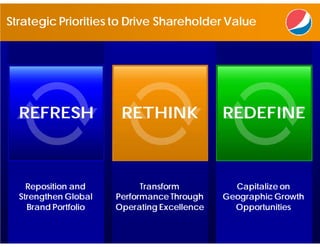
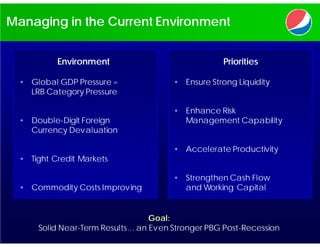
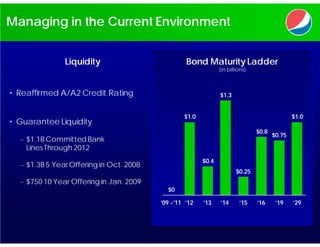
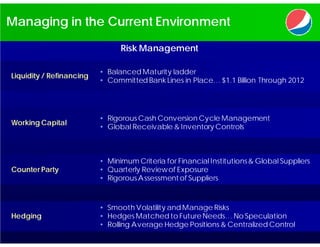
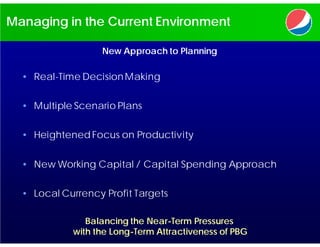
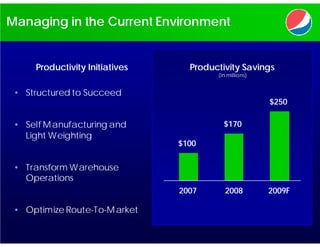
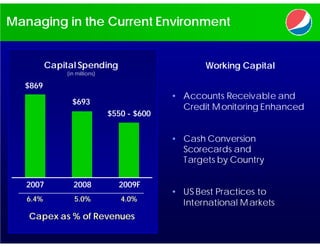
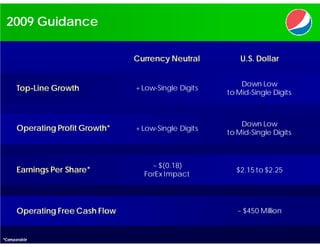
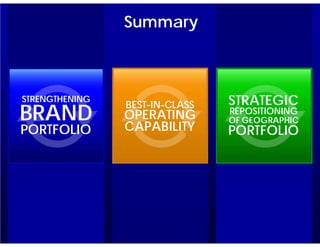
Eric Foss        Al Drewes
Chairman & CEO    SVP & CFO
Cautionary Statement

Statements made in this presentation that relate to future performance or
financial results of PBG are forward-looking statements, which inv olv e
uncertainties that could cause actual performance or results to materially
differ. We undertake no obligation to update any of these statements. Listeners
are cautioned not to place undue reliance on these forward-looking
statements. These statements should be taken in conjunction with the
additional information about risk and uncertainties set forth in PBG’s annual
report on Form 10-K for the year ended December 29, 2007.

We hav e disclosed certain non-GAAP measures within this presentation.
Our 2009 financial outlook also contains non-GAAP measures. “Non-GAAP”
measures include those designated as “Comparable” as well as Operating
Free Cash Flow (OFCF). Please see reconciliations to their respectiv e measures
prescribed by accounting principles generally accepted in the U.S. included
on our website at www.pbg.com under Inv estor Relations.
REFRESH   RETHINK   REDEFINE
AGENDA
SNAPSHOT
OF PBG
           THE EVOLVING
           LANDSCAPE
                          STRATEGIC
                          PRIORITIES
                          TO DRIVE
                                2009
                          SHAREHOLDER
                          VALUE PRIORITIES &
                                        FINANCIAL
                                        OUTLOOK
67,000                  2 MILLION                    85 BILLION
                                                     SERVINGS
EMPLOYEES   1.5 MILLION PIECES OF
                                                     SOLD
                                      3.5 MILLION
            DELIVERIES   COLD DRINK   POINTS OF
                         EQUIPMENT
            PER WEEK                  INTERRUPTION   ANNUALLY
Snapshot of PBG

               Successful Portfolio Repositioning… With Clear Opportunities

                         Geographies                                 Brands

                    Operating Profit Shifts                   U.S. Category Shifts

                   10                                       15
                                       30                             27
                   90                              40       85                   >35

                                       70                             73
                                                   60                            <65


                 2002                2008         2012F     2002      2008      2012F
                        U.S.                International     CSDs           Non-Carbs


Operating profit is on a comparable basis
Snapshot of PBG

               Great Portfolio of Brands… Strong #1 or #2

 Colas


 Flavors


 Water


 Non-Carbs


 Invigoration & Energy
Snapshot of PBG

             Capable, Motivated, Experienced Workforce


            Capability                          Culture

 • Financial Literacy                • Results Oriented

 • Metric Based Granular Focus       • Continuity of Management

 • Tools, Training & Technology      • Appreciation & Recognition
Snapshot of PBG

                                                  Operational
Best-In-Class Execution                           Excellence

                                                Service
                                               Excellence

                                            Selling
                                          Excellence

                                   Revenue / Margin
                                 Management Excellence

                            Executional
                            Excellence


                   “We Sell Soda.”


1999                                                        2009 & Beyond
Snapshot of PBG

                                               Proven Financial Track Record

                                    Topline Growth                   Operating Profit
                                         (in billions)                     (in billions)
                                                         $13.8                             $1.2
                              $11.7                                $1.0
                                           CAGR                              CAGR
                                           +6%                               +6%

                              2005                       2008      2005                    2008


                                        EPS Growth                        Cash Flow
                                         (in dollars)                     (in millions)
                                                         $2.27                             $526
                                                                   $504
                              $1.68                                       Total Payout
                                           CAGR
                                          +11%                            +110%

                              2005                       2008      2005                    2008

All figures are on a comparable basis
The Evolving Landscape… Consumer

 Relevance
    • Craving Humanity, Optimism & Energy
    • Embracing Modern, Simple & Iconic Designs


 Variety
    • Purchasing Broader Repertoire of Products
    • Adopting New and Unique Brands & Flavors


 Health & Wellness
    • Searching for Better for You and Functional Products
    • Continuing to Focus on Better Tasting Hydration


 Value
    • Shopping Across Channels in Search of Value
    • Seeking Key Price Points
Evolving Landscape… Channel & Customer


               Big Getting Bigger


               Continued Channel Migration


               Value Rules the Day


               Escalating Labor Costs
Evolving Landscape… Category

                  Big, Growing and Powerful Category

    US Retail         Retail Sales          Household            Purchase
    LRB Sales          Growth               Penetration         Frequency
          $110B        4%       4%           98%                 63
  $98B                                              73%


                                                                           14


  2005    2008        LRB      Top 10        LRB   Top 10        LRB      Top 10

 • Top Retail Sales Category            • 110 Million Households Buying
 • Annual Growth of 4%                  • Top Destination Category
 • Innovation Fueling Growth            • Highest Grocery Purchase Frequency
Strategic Priorities to Drive Shareholder Value


  REFRESH              RETHINK               REDEFINE


    Reposition and          Transform          Capitalize on
  Strengthen Global   Performance Through    Geographic Growth
    Brand Portfolio   Operating Excellence     Opportunities
REFRESH   Reposition and Strengthen Global Brand Portfolio


                 FILL PORTFOLIO
                 GAPS: GOAL                     PURSUE
                 #1 OR #2                       SCALE
 INVEST IN       POSITION         ENTER
 CORE                             WHITE         OPPORTUNITIES

 BRANDS                           SPACE
REFRESH


           Transformational
          Re-Launch of Pepsi
REFRESH   Invest in Core Brands
REFRESH


             Aligns Portfolio Across
                U.S. and Canada

              Strengthens Flavor
              CSD Brand Line-Up

          Significant Volume Potential
REFRESH


          Expand Energy Portfolio
REFRESH               Muscle Milk


          Expands PBG’s Portfolio into White Space

          Leading Brand in High Growth Segment

            Strong Platform for Health & Wellness
REFRESH    Lebedyansky Acquisition


          Largest Juice Producer; #1 Share Position


                Growth Category within LRB

              Juice Drinks Introduction in 2009

           Scale Business with Attractive Margins

              75/25 Joint Venture with PepsiCo


          Integration Opportunities and Synergies
RETHINK   Transform Performance Through Operating Excellence


    Re-Conceptualize Consumer               Step Change in
        Value Architecture          Cost Structure and Productivity
RETHINK   Transform Performance Through Operating Excellence


           Re-Conceptualize Consumer Value Architecture

                  Weeks in Value
                                   • Well-Defined Value Architecture
                                   • Best-in-Class Planning Tools


                  Price / Package Architecture
                                   • Long-Range Value Migration Planning
                                   • Delivers Value Volume & Margin Runway


                  Price Gap Management
                                   • Deep Insights & Experience
                                   • Understand Private Label Limitations


                  Innovation & Limited Time Offer Packages
                                   • Pulse Value at Key Price Points
                                   • Big Brands & Big Packs, In & Out
RETHINK   Transform Performance Through Operating Excellence


            Step Change in Cost Structure and Productivity


      Optimize                 Transform                  Maximize
    Manufacturing             Warehouse                 Go-To-Market
       Cost                   Capabilities              Effectiveness


                    2009 Cost Savings of $250 Million
REDEFINE    Capitalize on Geographic Growth Opportunities

                                  Domestic

     Organic Growth         New/Emerging Segments           Geographies


                                                                    Independent
                                                                       Bottlers


                                                                        Other
                                                                       Anchors


3 TO 5% RETAIL               $1 BILLION                 OVER BOTTLERS
                                                                    100
 CATEGORY GROWTH              IN RETAIL SALES           INDEPENDENT

 • Consumer Value           • PepsiCo Partnership       • Enhanced Speed
                                                          to Market
 • Executional Excellence   • Distribution Agreements
                                                        • Cost Rationalization
 • Leverage Innovation      • Learning Labs
                                                        • Financially Accretive
REDEFINE      Capitalize on Geographic Growth Opportunities

             International Markets… Positive Long-Term Potential


                   Russia                                  Mexico
  • Low LRB Per Capita Consumption          • Large Population Base

  • Strong Brand Portfolio                  • Capitalize on Channel Shifts

  • Power of One with Frito                 • Strengthened Management Team

  • Capability as a Competitive Advantage   • Restructuring Plans Being Executed
Agenda


  PBG’S APPROACH
 TO CREATING
 SHAREHOLDER
 VALUE             MANAGING
                   IN THE CURRENT
                   ENVIRONMENT


                                    2009
                                    FINANCIAL
                                    OUTLOOK
PBG’s Approach to Creating Shareholder Value


    • Sustainable Topline and Bottomline Growth

    • Focused Cash Flow Priorities

       – Investments Increase ROIC – WACC Spread

       – Grow Operating Free Cash Flow

       – Effectively Return Cash to Shareholders
PBG’s Approach to Creating Shareholder Value

                                  Sustainable Topline and Bottomline Growth


                 Revenue                              Operating Profit                         EPS
                  (in billions)                             (in billions)                   (in dollars)


                                                                                                           $2.27
                                   $13.8                                    ~$1.2             $2.20
                    $13.6                                     ~$1.1

                                                     $.9
      $10.3                +2%                                     +2%              $1.41         +3%


             CAGR                                      CAGR                            CAGR
            +7%                                        +5%                            +12%

       2003           2007           2008            2003      2007         2008    2003      2007         2008

Operating profit and EPS are on a comparable basis
PBG’s Approach to Creating Shareholder Value

                     Focused Cash Flow Priorities


                                    1999-2002       2003-2008

  Reinvest in the Business          $2.3 Billion    $4.4 Billion


  Acquisitions                      $1.3 Billion    $1.1 Billion


  Share Buybacks & Dividends       $700 Million     $3.5 Billion
PBG’s Approach to Creating Shareholder Value

                           Focused Cash Flow Priorities


                   OFCF                                    ROIC


                          $526                                    7.8%
            $440                                    7.0%
                                                                         WACC
                   CAGR
                   +4%


            2003          2008                      2003          2008
 Non-GAAP
Managing in the Current Environment


           Environment                              Priorities

  • Global GDP Pressure =              • Ensure Strong Liquidity
    LRB Category Pressure

                                       • Enhance Risk
  • Double-Digit Foreign                 Management Capability
    Currency Devaluation

                                       • Accelerate Productivity
  • Tight Credit Markets

                                       • Strengthen Cash Flow
  • Commodity Costs Improving            and Working Capital


                                  Goal:
      Solid Near-Term Results… an Even Stronger PBG Post-Recession
Managing in the Current Environment


               Liquidity                          Bond Maturity Ladder
                                                               (in billions)


• Reaffirmed A/A2 Credit Rating                                $1.3


                                                 $1.0                                         $1.0
• Guarantee Liquidity
                                                                               $0.8
                                                                                      $0.75
  – $1.1B Committed Bank
    Lines Through 2012
                                                        $0.4
  – $1.3B 5 Year Offering in Oct. 2008
                                                                       $0.25
  – $750 10 Year Offering in Jan. 2009
                                           $0

                                         ’09 -’11 ’12   ’13    ’14      ’15    ’16     ’19    ’29
Managing in the Current Environment

                                 Risk Management

                          • Balanced Maturity ladder
Liquidity / Refinancing
                          • Committed Bank Lines in Place… $1.1 Billion Through 2012


                          • Rigorous Cash Conversion Cycle Management
Working Capital
                          • Global Receivable & Inventory Controls


                          • Minimum Criteria for Financial Institutions & Global Suppliers
Counter Party             • Quarterly Review of Exposure
                          • Rigorous Assessment of Suppliers


                          •   Smooth Volatility and Manage Risks
Hedging                   •   Hedges Matched to Future Needs… No Speculation
                          •   Rolling Average Hedge Positions & Centralized Control
Managing in the Current Environment

                   New Approach to Planning

  • Real-Time Decision Making


  • Multiple Scenario Plans


  • Heightened Focus on Productivity


  • New Working Capital / Capital Spending Approach


  • Local Currency Profit Targets

               Balancing the Near-Term Pressures
            with the Long-Term Attractiveness of PBG
Managing in the Current Environment


     Productivity Initiatives     Productivity Savings
                                        (in millions)


 • Structured to Succeed
                                                        $250

 • Self M anufacturing and                $170
   Light Weighting
                                $100


 • Transform Warehouse
   Operations
                                2007      2008          2009F

 • Optimize Route-To-M arket
Managing in the Current Environment


          Capital Spending                         Working Capital
              (in millions)

  $869
                                            • Accounts Receivable and
                $693
                                              Credit M onitoring Enhanced
                              $550 - $600


                                            • Cash Conversion
                                              Scorecards and
                                              Targets by Country

   2007         2008            2009F
                                            • US Best Practices to
   6.4%          5.0%            4.0%
                                              International M arkets
   Capex as % of Revenues
2009 Guidance

                                 Currency Neutral          U.S. Dollar


                                                           Down Low
      Top-Line Growth            + Low-Single Digits
                                                       to Mid-Single Digits


                                                           Down Low
      Operating Profit Growth*   + Low-Single Digits
                                                       to Mid-Single Digits


                                     ~ $(0.18)
      Earnings Per Share*                                $2.15 to $2.25
                                   ForEx Impact


      Operating Free Cash Flow                            ~ $450 Million


*Comparable
Financial Outlook Summary


             Strong Track Record of Results


                 Clear Priorities for 2009


    Financial Flexibility due to Strong Balance Sheet


           Bright Future as Macros Rebound
Summary


STRENGTHENING
                BEST-IN-CLASS   STRATEGIC
BRAND           OPERATING
                CAPABILITY
                                REPOSITIONING
                                OF GEOGRAPHIC
PORTFOLIO                       PORTFOLIO
PBG Cagny 2009

PBG Cagny 2009

  • 1.
    Eric Foss Al Drewes Chairman & CEO SVP & CFO
  • 2.
    Cautionary Statement Statements madein this presentation that relate to future performance or financial results of PBG are forward-looking statements, which inv olv e uncertainties that could cause actual performance or results to materially differ. We undertake no obligation to update any of these statements. Listeners are cautioned not to place undue reliance on these forward-looking statements. These statements should be taken in conjunction with the additional information about risk and uncertainties set forth in PBG’s annual report on Form 10-K for the year ended December 29, 2007. We hav e disclosed certain non-GAAP measures within this presentation. Our 2009 financial outlook also contains non-GAAP measures. “Non-GAAP” measures include those designated as “Comparable” as well as Operating Free Cash Flow (OFCF). Please see reconciliations to their respectiv e measures prescribed by accounting principles generally accepted in the U.S. included on our website at www.pbg.com under Inv estor Relations.
  • 3.
    REFRESH RETHINK REDEFINE
  • 4.
    AGENDA SNAPSHOT OF PBG THE EVOLVING LANDSCAPE STRATEGIC PRIORITIES TO DRIVE 2009 SHAREHOLDER VALUE PRIORITIES & FINANCIAL OUTLOOK
  • 6.
    67,000 2 MILLION 85 BILLION SERVINGS EMPLOYEES 1.5 MILLION PIECES OF SOLD 3.5 MILLION DELIVERIES COLD DRINK POINTS OF EQUIPMENT PER WEEK INTERRUPTION ANNUALLY
  • 7.
    Snapshot of PBG Successful Portfolio Repositioning… With Clear Opportunities Geographies Brands Operating Profit Shifts U.S. Category Shifts 10 15 30 27 90 40 85 >35 70 73 60 <65 2002 2008 2012F 2002 2008 2012F U.S. International CSDs Non-Carbs Operating profit is on a comparable basis
  • 8.
    Snapshot of PBG Great Portfolio of Brands… Strong #1 or #2 Colas Flavors Water Non-Carbs Invigoration & Energy
  • 9.
    Snapshot of PBG Capable, Motivated, Experienced Workforce Capability Culture • Financial Literacy • Results Oriented • Metric Based Granular Focus • Continuity of Management • Tools, Training & Technology • Appreciation & Recognition
  • 10.
    Snapshot of PBG Operational Best-In-Class Execution Excellence Service Excellence Selling Excellence Revenue / Margin Management Excellence Executional Excellence “We Sell Soda.” 1999 2009 & Beyond
  • 11.
    Snapshot of PBG Proven Financial Track Record Topline Growth Operating Profit (in billions) (in billions) $13.8 $1.2 $11.7 $1.0 CAGR CAGR +6% +6% 2005 2008 2005 2008 EPS Growth Cash Flow (in dollars) (in millions) $2.27 $526 $504 $1.68 Total Payout CAGR +11% +110% 2005 2008 2005 2008 All figures are on a comparable basis
  • 13.
    The Evolving Landscape…Consumer Relevance • Craving Humanity, Optimism & Energy • Embracing Modern, Simple & Iconic Designs Variety • Purchasing Broader Repertoire of Products • Adopting New and Unique Brands & Flavors Health & Wellness • Searching for Better for You and Functional Products • Continuing to Focus on Better Tasting Hydration Value • Shopping Across Channels in Search of Value • Seeking Key Price Points
  • 14.
    Evolving Landscape… Channel& Customer Big Getting Bigger Continued Channel Migration Value Rules the Day Escalating Labor Costs
  • 15.
    Evolving Landscape… Category Big, Growing and Powerful Category US Retail Retail Sales Household Purchase LRB Sales Growth Penetration Frequency $110B 4% 4% 98% 63 $98B 73% 14 2005 2008 LRB Top 10 LRB Top 10 LRB Top 10 • Top Retail Sales Category • 110 Million Households Buying • Annual Growth of 4% • Top Destination Category • Innovation Fueling Growth • Highest Grocery Purchase Frequency
  • 17.
    Strategic Priorities toDrive Shareholder Value REFRESH RETHINK REDEFINE Reposition and Transform Capitalize on Strengthen Global Performance Through Geographic Growth Brand Portfolio Operating Excellence Opportunities
  • 18.
    REFRESH Reposition and Strengthen Global Brand Portfolio FILL PORTFOLIO GAPS: GOAL PURSUE #1 OR #2 SCALE INVEST IN POSITION ENTER CORE WHITE OPPORTUNITIES BRANDS SPACE
  • 19.
    REFRESH Transformational Re-Launch of Pepsi
  • 21.
    REFRESH Invest in Core Brands
  • 22.
    REFRESH Aligns Portfolio Across U.S. and Canada Strengthens Flavor CSD Brand Line-Up Significant Volume Potential
  • 23.
    REFRESH Expand Energy Portfolio
  • 24.
    REFRESH Muscle Milk Expands PBG’s Portfolio into White Space Leading Brand in High Growth Segment Strong Platform for Health & Wellness
  • 25.
    REFRESH Lebedyansky Acquisition Largest Juice Producer; #1 Share Position Growth Category within LRB Juice Drinks Introduction in 2009 Scale Business with Attractive Margins 75/25 Joint Venture with PepsiCo Integration Opportunities and Synergies
  • 26.
    RETHINK Transform Performance Through Operating Excellence Re-Conceptualize Consumer Step Change in Value Architecture Cost Structure and Productivity
  • 27.
    RETHINK Transform Performance Through Operating Excellence Re-Conceptualize Consumer Value Architecture Weeks in Value • Well-Defined Value Architecture • Best-in-Class Planning Tools Price / Package Architecture • Long-Range Value Migration Planning • Delivers Value Volume & Margin Runway Price Gap Management • Deep Insights & Experience • Understand Private Label Limitations Innovation & Limited Time Offer Packages • Pulse Value at Key Price Points • Big Brands & Big Packs, In & Out
  • 28.
    RETHINK Transform Performance Through Operating Excellence Step Change in Cost Structure and Productivity Optimize Transform Maximize Manufacturing Warehouse Go-To-Market Cost Capabilities Effectiveness 2009 Cost Savings of $250 Million
  • 29.
    REDEFINE Capitalize on Geographic Growth Opportunities Domestic Organic Growth New/Emerging Segments Geographies Independent Bottlers Other Anchors 3 TO 5% RETAIL $1 BILLION OVER BOTTLERS 100 CATEGORY GROWTH IN RETAIL SALES INDEPENDENT • Consumer Value • PepsiCo Partnership • Enhanced Speed to Market • Executional Excellence • Distribution Agreements • Cost Rationalization • Leverage Innovation • Learning Labs • Financially Accretive
  • 30.
    REDEFINE Capitalize on Geographic Growth Opportunities International Markets… Positive Long-Term Potential Russia Mexico • Low LRB Per Capita Consumption • Large Population Base • Strong Brand Portfolio • Capitalize on Channel Shifts • Power of One with Frito • Strengthened Management Team • Capability as a Competitive Advantage • Restructuring Plans Being Executed
  • 32.
    Agenda PBG’SAPPROACH TO CREATING SHAREHOLDER VALUE MANAGING IN THE CURRENT ENVIRONMENT 2009 FINANCIAL OUTLOOK
  • 33.
    PBG’s Approach toCreating Shareholder Value • Sustainable Topline and Bottomline Growth • Focused Cash Flow Priorities – Investments Increase ROIC – WACC Spread – Grow Operating Free Cash Flow – Effectively Return Cash to Shareholders
  • 34.
    PBG’s Approach toCreating Shareholder Value Sustainable Topline and Bottomline Growth Revenue Operating Profit EPS (in billions) (in billions) (in dollars) $2.27 $13.8 ~$1.2 $2.20 $13.6 ~$1.1 $.9 $10.3 +2% +2% $1.41 +3% CAGR CAGR CAGR +7% +5% +12% 2003 2007 2008 2003 2007 2008 2003 2007 2008 Operating profit and EPS are on a comparable basis
  • 35.
    PBG’s Approach toCreating Shareholder Value Focused Cash Flow Priorities 1999-2002 2003-2008 Reinvest in the Business $2.3 Billion $4.4 Billion Acquisitions $1.3 Billion $1.1 Billion Share Buybacks & Dividends $700 Million $3.5 Billion
  • 36.
    PBG’s Approach toCreating Shareholder Value Focused Cash Flow Priorities OFCF ROIC $526 7.8% $440 7.0% WACC CAGR +4% 2003 2008 2003 2008 Non-GAAP
  • 37.
    Managing in theCurrent Environment Environment Priorities • Global GDP Pressure = • Ensure Strong Liquidity LRB Category Pressure • Enhance Risk • Double-Digit Foreign Management Capability Currency Devaluation • Accelerate Productivity • Tight Credit Markets • Strengthen Cash Flow • Commodity Costs Improving and Working Capital Goal: Solid Near-Term Results… an Even Stronger PBG Post-Recession
  • 38.
    Managing in theCurrent Environment Liquidity Bond Maturity Ladder (in billions) • Reaffirmed A/A2 Credit Rating $1.3 $1.0 $1.0 • Guarantee Liquidity $0.8 $0.75 – $1.1B Committed Bank Lines Through 2012 $0.4 – $1.3B 5 Year Offering in Oct. 2008 $0.25 – $750 10 Year Offering in Jan. 2009 $0 ’09 -’11 ’12 ’13 ’14 ’15 ’16 ’19 ’29
  • 39.
    Managing in theCurrent Environment Risk Management • Balanced Maturity ladder Liquidity / Refinancing • Committed Bank Lines in Place… $1.1 Billion Through 2012 • Rigorous Cash Conversion Cycle Management Working Capital • Global Receivable & Inventory Controls • Minimum Criteria for Financial Institutions & Global Suppliers Counter Party • Quarterly Review of Exposure • Rigorous Assessment of Suppliers • Smooth Volatility and Manage Risks Hedging • Hedges Matched to Future Needs… No Speculation • Rolling Average Hedge Positions & Centralized Control
  • 40.
    Managing in theCurrent Environment New Approach to Planning • Real-Time Decision Making • Multiple Scenario Plans • Heightened Focus on Productivity • New Working Capital / Capital Spending Approach • Local Currency Profit Targets Balancing the Near-Term Pressures with the Long-Term Attractiveness of PBG
  • 41.
    Managing in theCurrent Environment Productivity Initiatives Productivity Savings (in millions) • Structured to Succeed $250 • Self M anufacturing and $170 Light Weighting $100 • Transform Warehouse Operations 2007 2008 2009F • Optimize Route-To-M arket
  • 42.
    Managing in theCurrent Environment Capital Spending Working Capital (in millions) $869 • Accounts Receivable and $693 Credit M onitoring Enhanced $550 - $600 • Cash Conversion Scorecards and Targets by Country 2007 2008 2009F • US Best Practices to 6.4% 5.0% 4.0% International M arkets Capex as % of Revenues
  • 43.
    2009 Guidance Currency Neutral U.S. Dollar Down Low Top-Line Growth + Low-Single Digits to Mid-Single Digits Down Low Operating Profit Growth* + Low-Single Digits to Mid-Single Digits ~ $(0.18) Earnings Per Share* $2.15 to $2.25 ForEx Impact Operating Free Cash Flow ~ $450 Million *Comparable
  • 44.
    Financial Outlook Summary Strong Track Record of Results Clear Priorities for 2009 Financial Flexibility due to Strong Balance Sheet Bright Future as Macros Rebound
  • 45.
    Summary STRENGTHENING BEST-IN-CLASS STRATEGIC BRAND OPERATING CAPABILITY REPOSITIONING OF GEOGRAPHIC PORTFOLIO PORTFOLIO