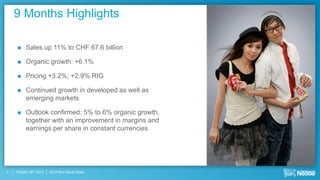
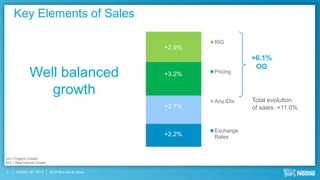
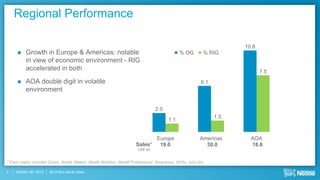
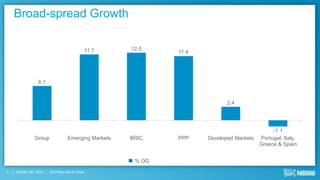
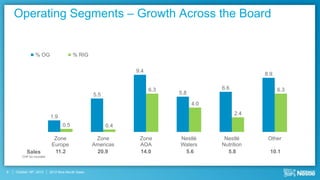
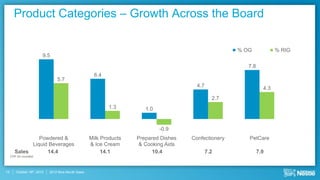
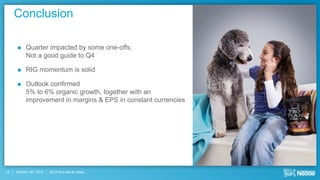
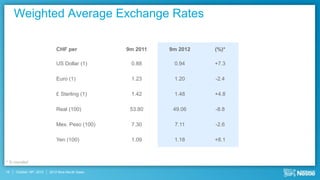
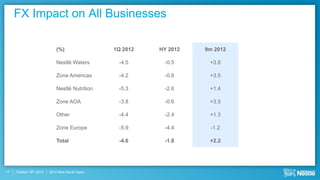
2012 Nine Months Sales


                                                  Roddy Child-Villiers
                                                 Head of Investor Relations


October 18th, 2012   2012 Nine Month Sales
Disclaimer

    This presentation contains forward looking statements
    which reflect Management’s current views and
    estimates. The forward looking statements involve
    certain risks and uncertainties that could cause actual
    results to differ materially from those contained in the
    forward looking statements. Potential risks and
    uncertainties include such factors as general economic
    conditions, foreign exchange fluctuations, competitive
    product and pricing pressures and regulatory
    developments.


1   October 18th, 2012   2012 Nine Month Sales
9 Months Highlights

         Sales up 11% to CHF 67.6 billion

         Organic growth: +6.1%

         Pricing +3.2%; +2.9% RIG

         Continued growth in developed as well as
          emerging markets

         Outlook confirmed: 5% to 6% organic growth,
          together with an improvement in margins and
          earnings per share in constant currencies


2   October 18th, 2012   2012 Nine Month Sales
Key Elements of Sales

                                                             RIG
                                                     +2.9%
                                                                         +6.1%
                                                                          OG
               Well balanced                         +3.2%   Pricing


                  growth
                                                             Acq./Div.   Total evolution
                                                     +2.7%               of sales: +11.0%


                                                             Exchange
                                                     +2.2%   Rates


OG = Organic Growth
RIG = Real Internal Growth

3     October 18th, 2012     2012 Nine Month Sales
Regional Performance

                                                                                                                      10.8
         Growth in Europe & Americas: notable                                                % OG         % RIG
          in view of economic environment - RIG
          accelerated in both                                                                                                7.5
         AOA double digit in volatile                                                                    6.1
          environment

                                                                                 2.5
                                                                                                                1.5
                                                                                        1.1


                                                                              Europe                      Americas      AOA
                                                                       Sales*  19.0                         30.0        18.6
                                                                        CHF bn


* Each region includes Zones, Nestlé Waters, Nestlé Nutrition, Nestlé Professional, Nespresso, NHSc, and JVs

4   October 18th, 2012   2012 Nine Month Sales
Broad-spread Growth

                                                 11.7   12.0
                                                                11.4


                  6.1


                                                                              2.4


                                                                                                -1.1
                Group              Emerging Markets     BRIC    PPP    Developed Markets   Portugal, Italy,
                                                                                           Greece & Spain


                                                         % OG
5   October 18th, 2012   2012 Nine Month Sales
Operating Segments – Growth Across the Board


                % OG                   % RIG


                                                             9.4
                                                                                                 8.9

                                                                   6.3               6.6               6.3
                                                 5.5                     5.8

                                                                               4.0
                                                                                           2.4
                         1.9
                                0.5                    0.4

                           Zone                   Zone        Zone       Nestlé       Nestlé      Other
                          Europe                 Americas     AOA        Waters      Nutrition
           Sales           11.2                   20.9        14.0        5.6          5.8         10.1
        CHF bn rounded


6   October 18th, 2012   2012 Nine Month Sales
Zone Americas
     Sales CHF 20.9 bn                           OG   5.5%   RIG 0.4%


                                                              Zone:

                                                                 RIG positive after H1 dip – North driver of acceleration

                                                              North America:

                                                                 General improvement in frozen aisle – to continue into Q4

                                                                 Coffee-Mate, Nescafé, PetCare performed well

                                                              Latin America:

                                                                 Growth in all categories, most countries and regions

                                                                 Xmas sell-in to benefit Q4 in Brazil (2011 benefit in Q3)


7   October 18th, 2012   2012 Nine Month Sales
Zone Europe
     Sales CHF 11.2 bn                           OG   1.9%   RIG 0.5%


     Western Europe:

         Good momentum in Nescafé, PetCare;
          a pick-up in ice cream

         France & the UK performed well;
          Greece resilient

     Eastern Europe:

         Russia continued its trend of improvement

         Other regions also contributed positively


8   October 18th, 2012   2012 Nine Month Sales
Zone Asia, Oceania & Africa
     Sales CHF 14 bn                             OG   9.4%   RIG 6.3%


                                                                       “Zone CNN” impact heavy in Q3:
                                                                        Business disruption

                                                                       Reported sales up 25.9% - Chinese partnerships

                                                                       Emerging markets double digit:
                                                                        Africa, Middle East, China...

                                                                       Japan growing – Nescafé and Kit Kat

                                                                       Most categories double digit – dairy, culinary,
                                                                        chocolate, powdered & RTD beverages, ice cream...


9   October 18th, 2012   2012 Nine Month Sales
Nestlé Nutrition
      Sales CHF 5.8 bn                            OG   6.6%   RIG 2.4%


      Infant Nutrition

          Strong performance in emerging markets

          Pick up in growth & improving shares in North
           America and Europe

      Performance Nutrition & Weight Management

          Trends unchanged


10   October 18th, 2012   2012 Nine Month Sales
Nestlé Waters
                    Sales CHF 5.6 bn                            OG   5.8%   RIG 4.0%


                                                                                      All segments drove growth in North America:
                                                                                       S. Pellegrino, Perrier, regional brands &
                                                                                       Nestlé Pure Life

                                                                                      France, Italy & UK performed well as Europe
                                                                                       had a good quarter

                                                                                      Emerging markets continued to grow double
                                                                                       digit
© Loran Dhérines


         11        October 18th, 2012   2012 Nine Month Sales
Other
      Sales CHF 10.1 bn                           OG   8.9%   RIG 6.3%


      Nestlé Professional                                           Nestlé Health Science

          Good growth in a challenged environment                      Performed well; acquisitions
                                                                         integrated & in line with
      Nespresso                                                          expectations

          Continued double-digit growth                            Joint Ventures

                                                                        Performed broadly in line with
                                                                         market


12   October 18th, 2012   2012 Nine Month Sales
Product Categories – Growth Across the Board

                                                                                                       % OG             % RIG
                         9.5

                                                                                                          7.8
                                                       6.4
                                 5.7
                                                                                         4.7                      4.3
                                                                                                 2.7
                                                             1.3        1.0


                                                                              -0.9
                Powdered &                           Milk Products   Prepared Dishes   Confectionery      PetCare
             Liquid Beverages                        & Ice Cream      & Cooking Aids
       Sales       14.4                                   14.1             10.4                7.2              7.9
     CHF bn rounded


13      October 18th, 2012   2012 Nine Month Sales
Conclusion

          Quarter impacted by some one-offs:
           Not a good guide to Q4

          RIG momentum is solid

          Outlook confirmed
           5% to 6% organic growth, together with an
           improvement in margins & EPS in constant currencies


14   October 18th, 2012   2012 Nine Month Sales
2012 Nine Months Sales


                                                   Discussion


October 20th, 2011   2011 Nine Month Sales
Weighted Average Exchange Rates

                              CHF per             9m 2011   9m 2012   (%)*

                              US Dollar (1)        0.88      0.94     +7.3

                              Euro (1)             1.23      1.20     -2.4

                              £ Sterling (1)       1.42      1.48     +4.8

                              Real (100)           53.80     49.06    -8.8

                              Mex. Peso (100)      7.30      7.11     -2.6

                              Yen (100)            1.09      1.18     +8.1


* % rounded

16   October 18th, 2012   2012 Nine Month Sales
FX Impact on All Businesses

                              (%)                 1Q 2012   HY 2012   9m 2012

                              Nestlé Waters        -4.5      -0.5      +3.8

                              Zone Americas        -4.2      -0.8      +3.5

                              Nestlé Nutrition     -5.3      -2.6      +1.4

                              Zone AOA             -3.8      -0.6      +3.5

                              Other                -4.4      -2.4      +1.3

                              Zone Europe          -5.9      -4.4      -1.2

                              Total                -4.6      -1.8      +2.2


17   October 18th, 2012   2012 Nine Month Sales

2012 9 month sales presentation

  • 1.
    2012 Nine MonthsSales Roddy Child-Villiers Head of Investor Relations October 18th, 2012 2012 Nine Month Sales
  • 2.
    Disclaimer This presentation contains forward looking statements which reflect Management’s current views and estimates. The forward looking statements involve certain risks and uncertainties that could cause actual results to differ materially from those contained in the forward looking statements. Potential risks and uncertainties include such factors as general economic conditions, foreign exchange fluctuations, competitive product and pricing pressures and regulatory developments. 1 October 18th, 2012 2012 Nine Month Sales
  • 3.
    9 Months Highlights  Sales up 11% to CHF 67.6 billion  Organic growth: +6.1%  Pricing +3.2%; +2.9% RIG  Continued growth in developed as well as emerging markets  Outlook confirmed: 5% to 6% organic growth, together with an improvement in margins and earnings per share in constant currencies 2 October 18th, 2012 2012 Nine Month Sales
  • 4.
    Key Elements ofSales RIG +2.9% +6.1% OG Well balanced +3.2% Pricing growth Acq./Div. Total evolution +2.7% of sales: +11.0% Exchange +2.2% Rates OG = Organic Growth RIG = Real Internal Growth 3 October 18th, 2012 2012 Nine Month Sales
  • 5.
    Regional Performance 10.8  Growth in Europe & Americas: notable % OG % RIG in view of economic environment - RIG accelerated in both 7.5  AOA double digit in volatile 6.1 environment 2.5 1.5 1.1 Europe Americas AOA Sales* 19.0 30.0 18.6 CHF bn * Each region includes Zones, Nestlé Waters, Nestlé Nutrition, Nestlé Professional, Nespresso, NHSc, and JVs 4 October 18th, 2012 2012 Nine Month Sales
  • 6.
    Broad-spread Growth 11.7 12.0 11.4 6.1 2.4 -1.1 Group Emerging Markets BRIC PPP Developed Markets Portugal, Italy, Greece & Spain % OG 5 October 18th, 2012 2012 Nine Month Sales
  • 7.
    Operating Segments –Growth Across the Board % OG % RIG 9.4 8.9 6.3 6.6 6.3 5.5 5.8 4.0 2.4 1.9 0.5 0.4 Zone Zone Zone Nestlé Nestlé Other Europe Americas AOA Waters Nutrition Sales 11.2 20.9 14.0 5.6 5.8 10.1 CHF bn rounded 6 October 18th, 2012 2012 Nine Month Sales
  • 8.
    Zone Americas Sales CHF 20.9 bn OG 5.5% RIG 0.4% Zone:  RIG positive after H1 dip – North driver of acceleration North America:  General improvement in frozen aisle – to continue into Q4  Coffee-Mate, Nescafé, PetCare performed well Latin America:  Growth in all categories, most countries and regions  Xmas sell-in to benefit Q4 in Brazil (2011 benefit in Q3) 7 October 18th, 2012 2012 Nine Month Sales
  • 9.
    Zone Europe Sales CHF 11.2 bn OG 1.9% RIG 0.5% Western Europe:  Good momentum in Nescafé, PetCare; a pick-up in ice cream  France & the UK performed well; Greece resilient Eastern Europe:  Russia continued its trend of improvement  Other regions also contributed positively 8 October 18th, 2012 2012 Nine Month Sales
  • 10.
    Zone Asia, Oceania& Africa Sales CHF 14 bn OG 9.4% RIG 6.3%  “Zone CNN” impact heavy in Q3: Business disruption  Reported sales up 25.9% - Chinese partnerships  Emerging markets double digit: Africa, Middle East, China...  Japan growing – Nescafé and Kit Kat  Most categories double digit – dairy, culinary, chocolate, powdered & RTD beverages, ice cream... 9 October 18th, 2012 2012 Nine Month Sales
  • 11.
    Nestlé Nutrition Sales CHF 5.8 bn OG 6.6% RIG 2.4% Infant Nutrition  Strong performance in emerging markets  Pick up in growth & improving shares in North America and Europe Performance Nutrition & Weight Management  Trends unchanged 10 October 18th, 2012 2012 Nine Month Sales
  • 12.
    Nestlé Waters Sales CHF 5.6 bn OG 5.8% RIG 4.0%  All segments drove growth in North America: S. Pellegrino, Perrier, regional brands & Nestlé Pure Life  France, Italy & UK performed well as Europe had a good quarter  Emerging markets continued to grow double digit © Loran Dhérines 11 October 18th, 2012 2012 Nine Month Sales
  • 13.
    Other Sales CHF 10.1 bn OG 8.9% RIG 6.3% Nestlé Professional Nestlé Health Science  Good growth in a challenged environment  Performed well; acquisitions integrated & in line with Nespresso expectations  Continued double-digit growth Joint Ventures  Performed broadly in line with market 12 October 18th, 2012 2012 Nine Month Sales
  • 14.
    Product Categories –Growth Across the Board % OG % RIG 9.5 7.8 6.4 5.7 4.7 4.3 2.7 1.3 1.0 -0.9 Powdered & Milk Products Prepared Dishes Confectionery PetCare Liquid Beverages & Ice Cream & Cooking Aids Sales 14.4 14.1 10.4 7.2 7.9 CHF bn rounded 13 October 18th, 2012 2012 Nine Month Sales
  • 15.
    Conclusion  Quarter impacted by some one-offs: Not a good guide to Q4  RIG momentum is solid  Outlook confirmed 5% to 6% organic growth, together with an improvement in margins & EPS in constant currencies 14 October 18th, 2012 2012 Nine Month Sales
  • 16.
    2012 Nine MonthsSales Discussion October 20th, 2011 2011 Nine Month Sales
  • 17.
    Weighted Average ExchangeRates CHF per 9m 2011 9m 2012 (%)* US Dollar (1) 0.88 0.94 +7.3 Euro (1) 1.23 1.20 -2.4 £ Sterling (1) 1.42 1.48 +4.8 Real (100) 53.80 49.06 -8.8 Mex. Peso (100) 7.30 7.11 -2.6 Yen (100) 1.09 1.18 +8.1 * % rounded 16 October 18th, 2012 2012 Nine Month Sales
  • 18.
    FX Impact onAll Businesses (%) 1Q 2012 HY 2012 9m 2012 Nestlé Waters -4.5 -0.5 +3.8 Zone Americas -4.2 -0.8 +3.5 Nestlé Nutrition -5.3 -2.6 +1.4 Zone AOA -3.8 -0.6 +3.5 Other -4.4 -2.4 +1.3 Zone Europe -5.9 -4.4 -1.2 Total -4.6 -1.8 +2.2 17 October 18th, 2012 2012 Nine Month Sales