Highlights For ThePeriod
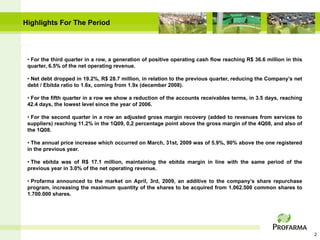
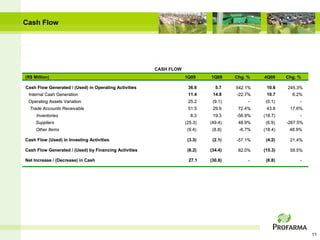
• For the third quarter in a row, a generation of positive operating cash flow reaching R$ 36.6 million in this
quarter, 6.5% of the net operating revenue.
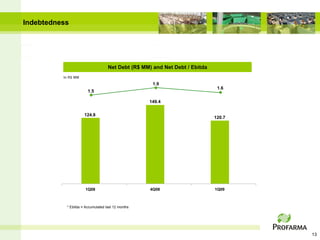
• Net debt dropped in 19.2%, R$ 28.7 million, in relation to the previous quarter, reducing the Company’s net
debt / Ebitda ratio to 1.6x, coming from 1.9x (december 2008).
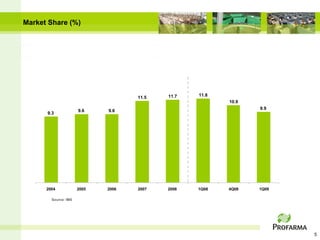
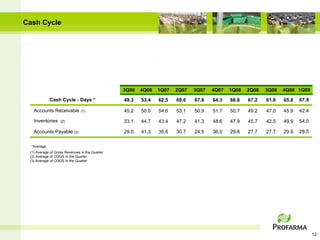
• For the fifth quarter in a row we show a reduction of the accounts receivables terms, in 3.5 days, reaching
42.4 days, the lowest level since the year of 2006.
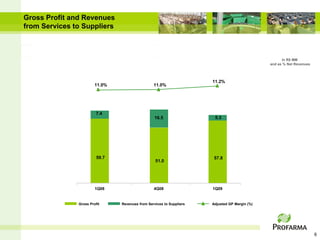
• For the second quarter in a row an adjusted gross margin recovery (added to revenues from services to
suppliers) reaching 11.2% in the 1Q09, 0,2 percentage point above the gross margin of the 4Q08, and also of
the 1Q08.
• The annual price increase which occurred on March, 31st, 2009 was of 5.9%, 90% above the one registered
in the previous year.
• The ebitda was of R$ 17.1 million, maintaining the ebitda margin in line with the same period of the
previous year in 3.0% of the net operating revenue.
• Profarma announced to the market on April, 3rd, 2009, an additive to the company’s share repurchase
program, increasing the maximum quantity of the shares to be acquired from 1.062.500 common shares to
1.700.000 shares.
2
Gross Profit andRevenues
from Services to Suppliers
In R$ MM
and as % Net Revenues
11.2%
11.0% 11.0%
7.4
16.5 5.3
59.7 57.8
51.0
1Q08 4Q08 1Q09
Gross Profit Revenues from Services to Suppliers Adjusted GP Margin (%)
6
7.
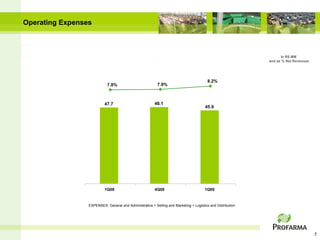
Operating Expenses
In R$ MM
and as % Net Revenues
8.2%
7.8% 7.9%
47.7 48.1
45.9
1Q08 4Q08 1Q09
EXPENSES: General and Administrative + Selling and Marketing + Logistics and Distribution
7
8.
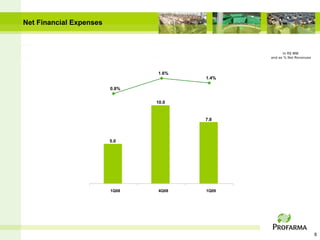
Net Financial Expenses
In R$ MM
and as % Net Revenues
1.6%
1.4%
0.8%
10.0
7.8
5.0
1Q08 4Q08 1Q09
8
9.
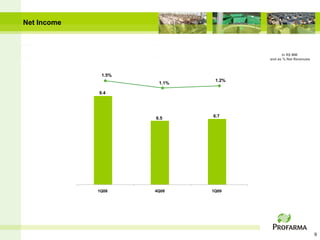
Net Income
In R$ MM
and as % Net Revenues
1.5%
1.2%
1.1%
9.4
6.5 6.7
1Q08 4Q08 1Q09
9
10.
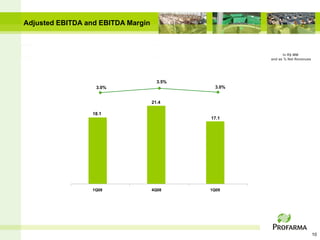
Adjusted EBITDA andEBITDA Margin
In R$ MM
and as % Net Revenues
3.5%
3.0% 3.0%
21.4
18.1
17.1
1Q08 4Q08 1Q09
10
IR Contacts
Max Fischer
CFO and IR Director
Beatriz Diez
IR Coordenador
Telephone.: 55 (21) 4009 0276
E-mail: ri@profarma.com.br
www.profarma.com.br/ir