Download as PPSX, PPTX


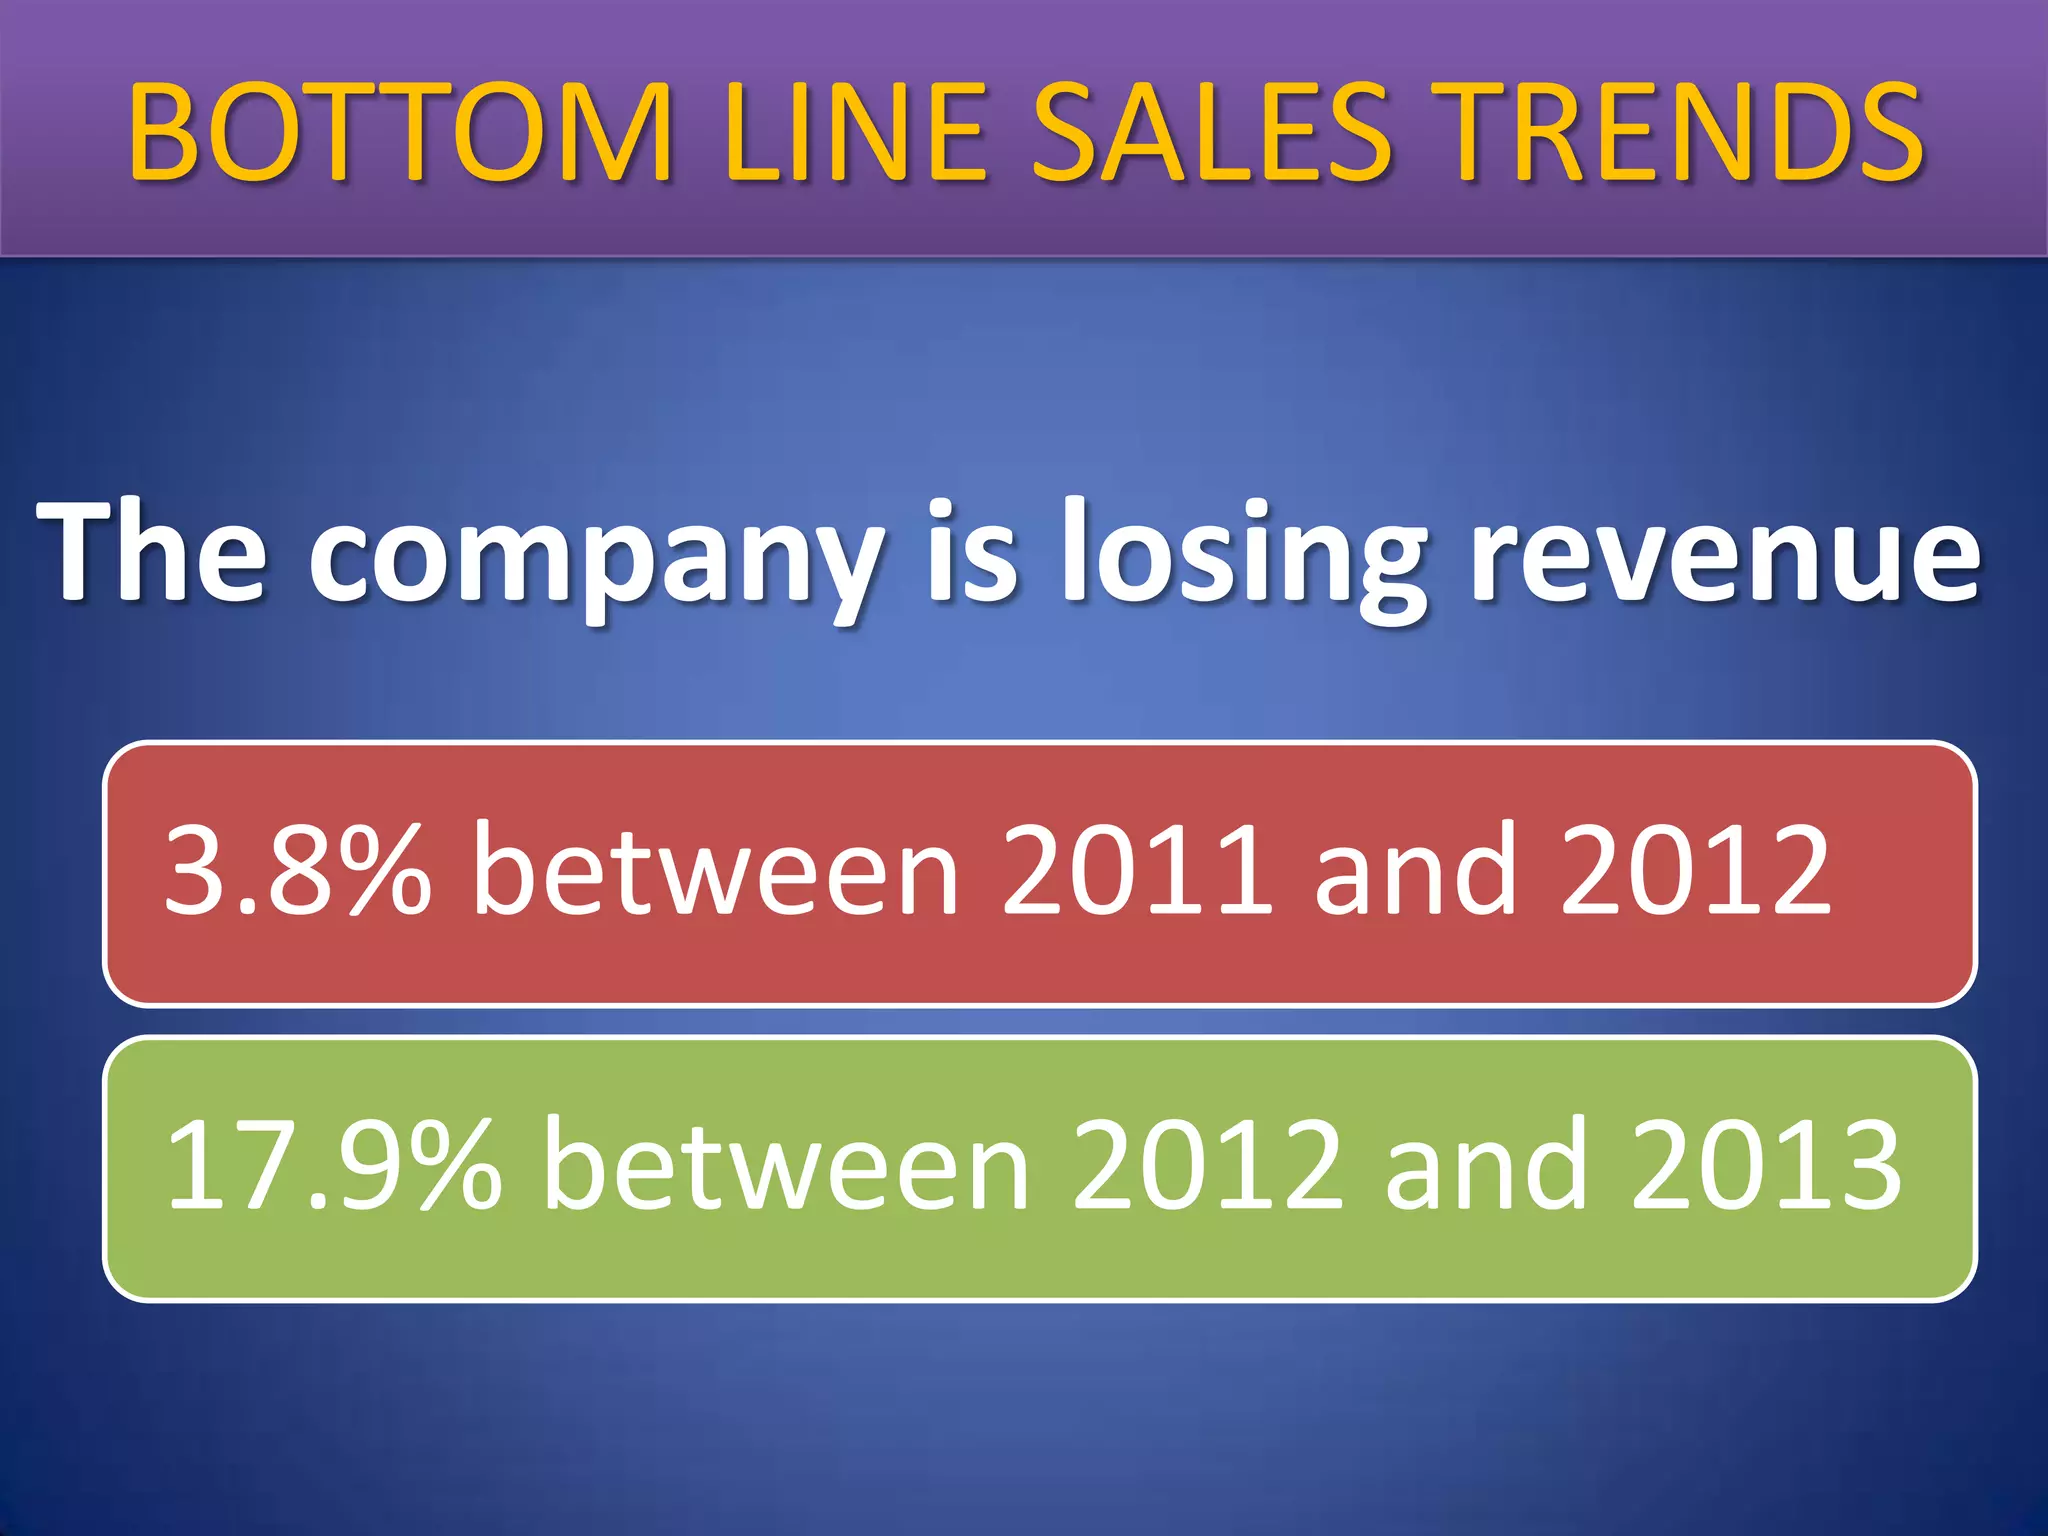

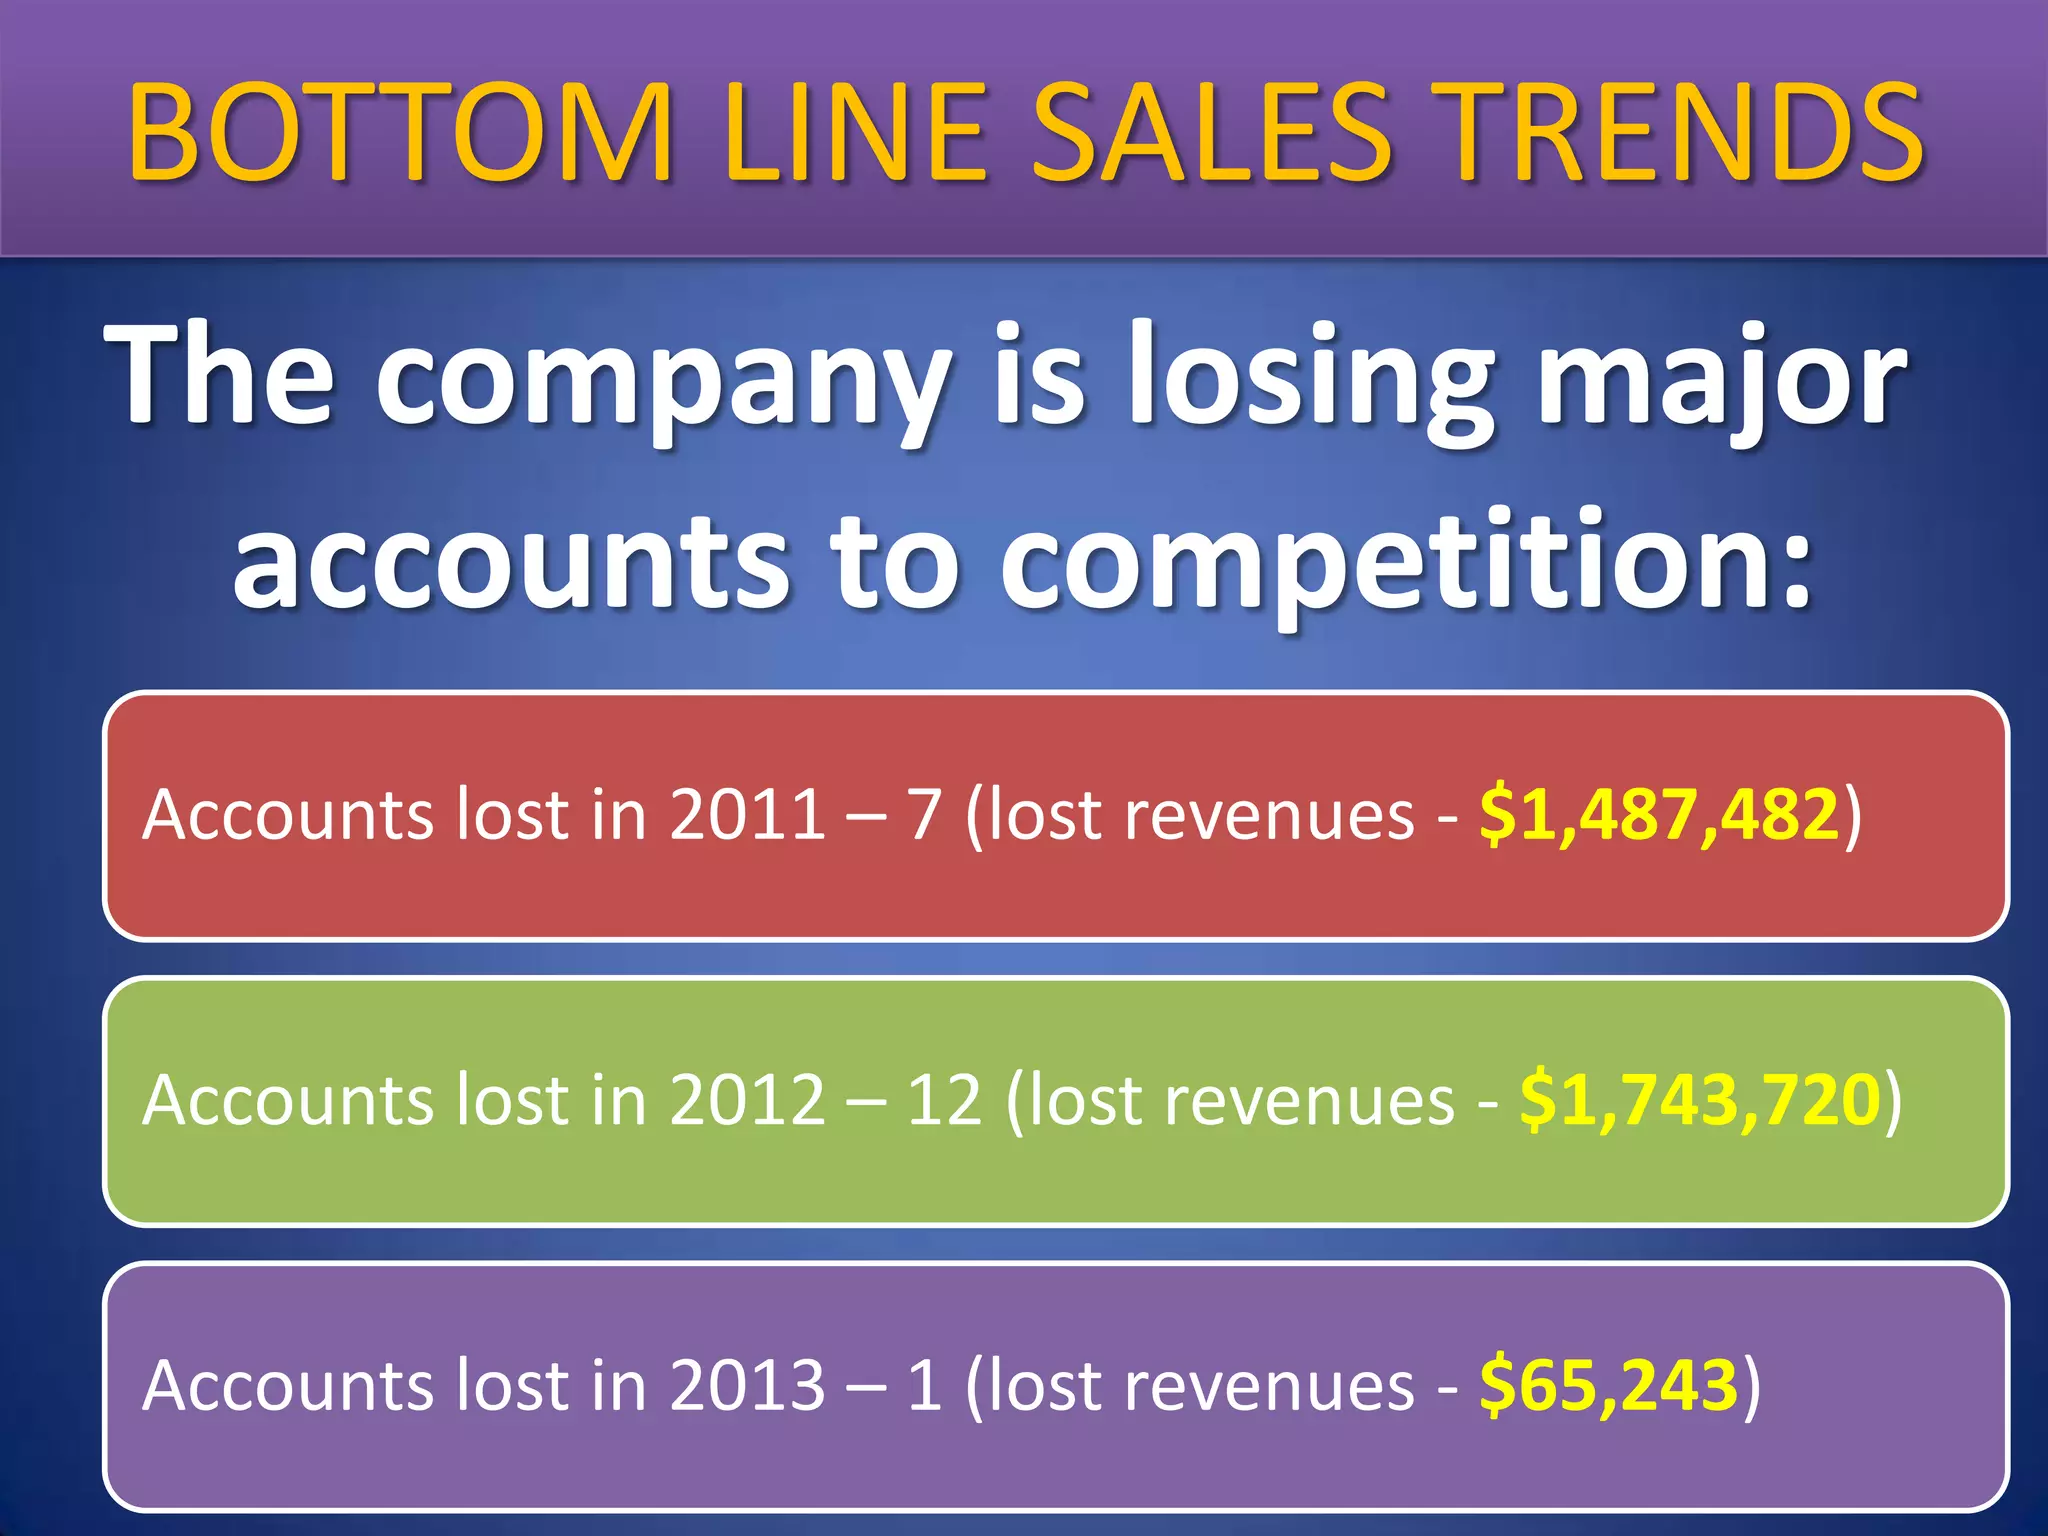

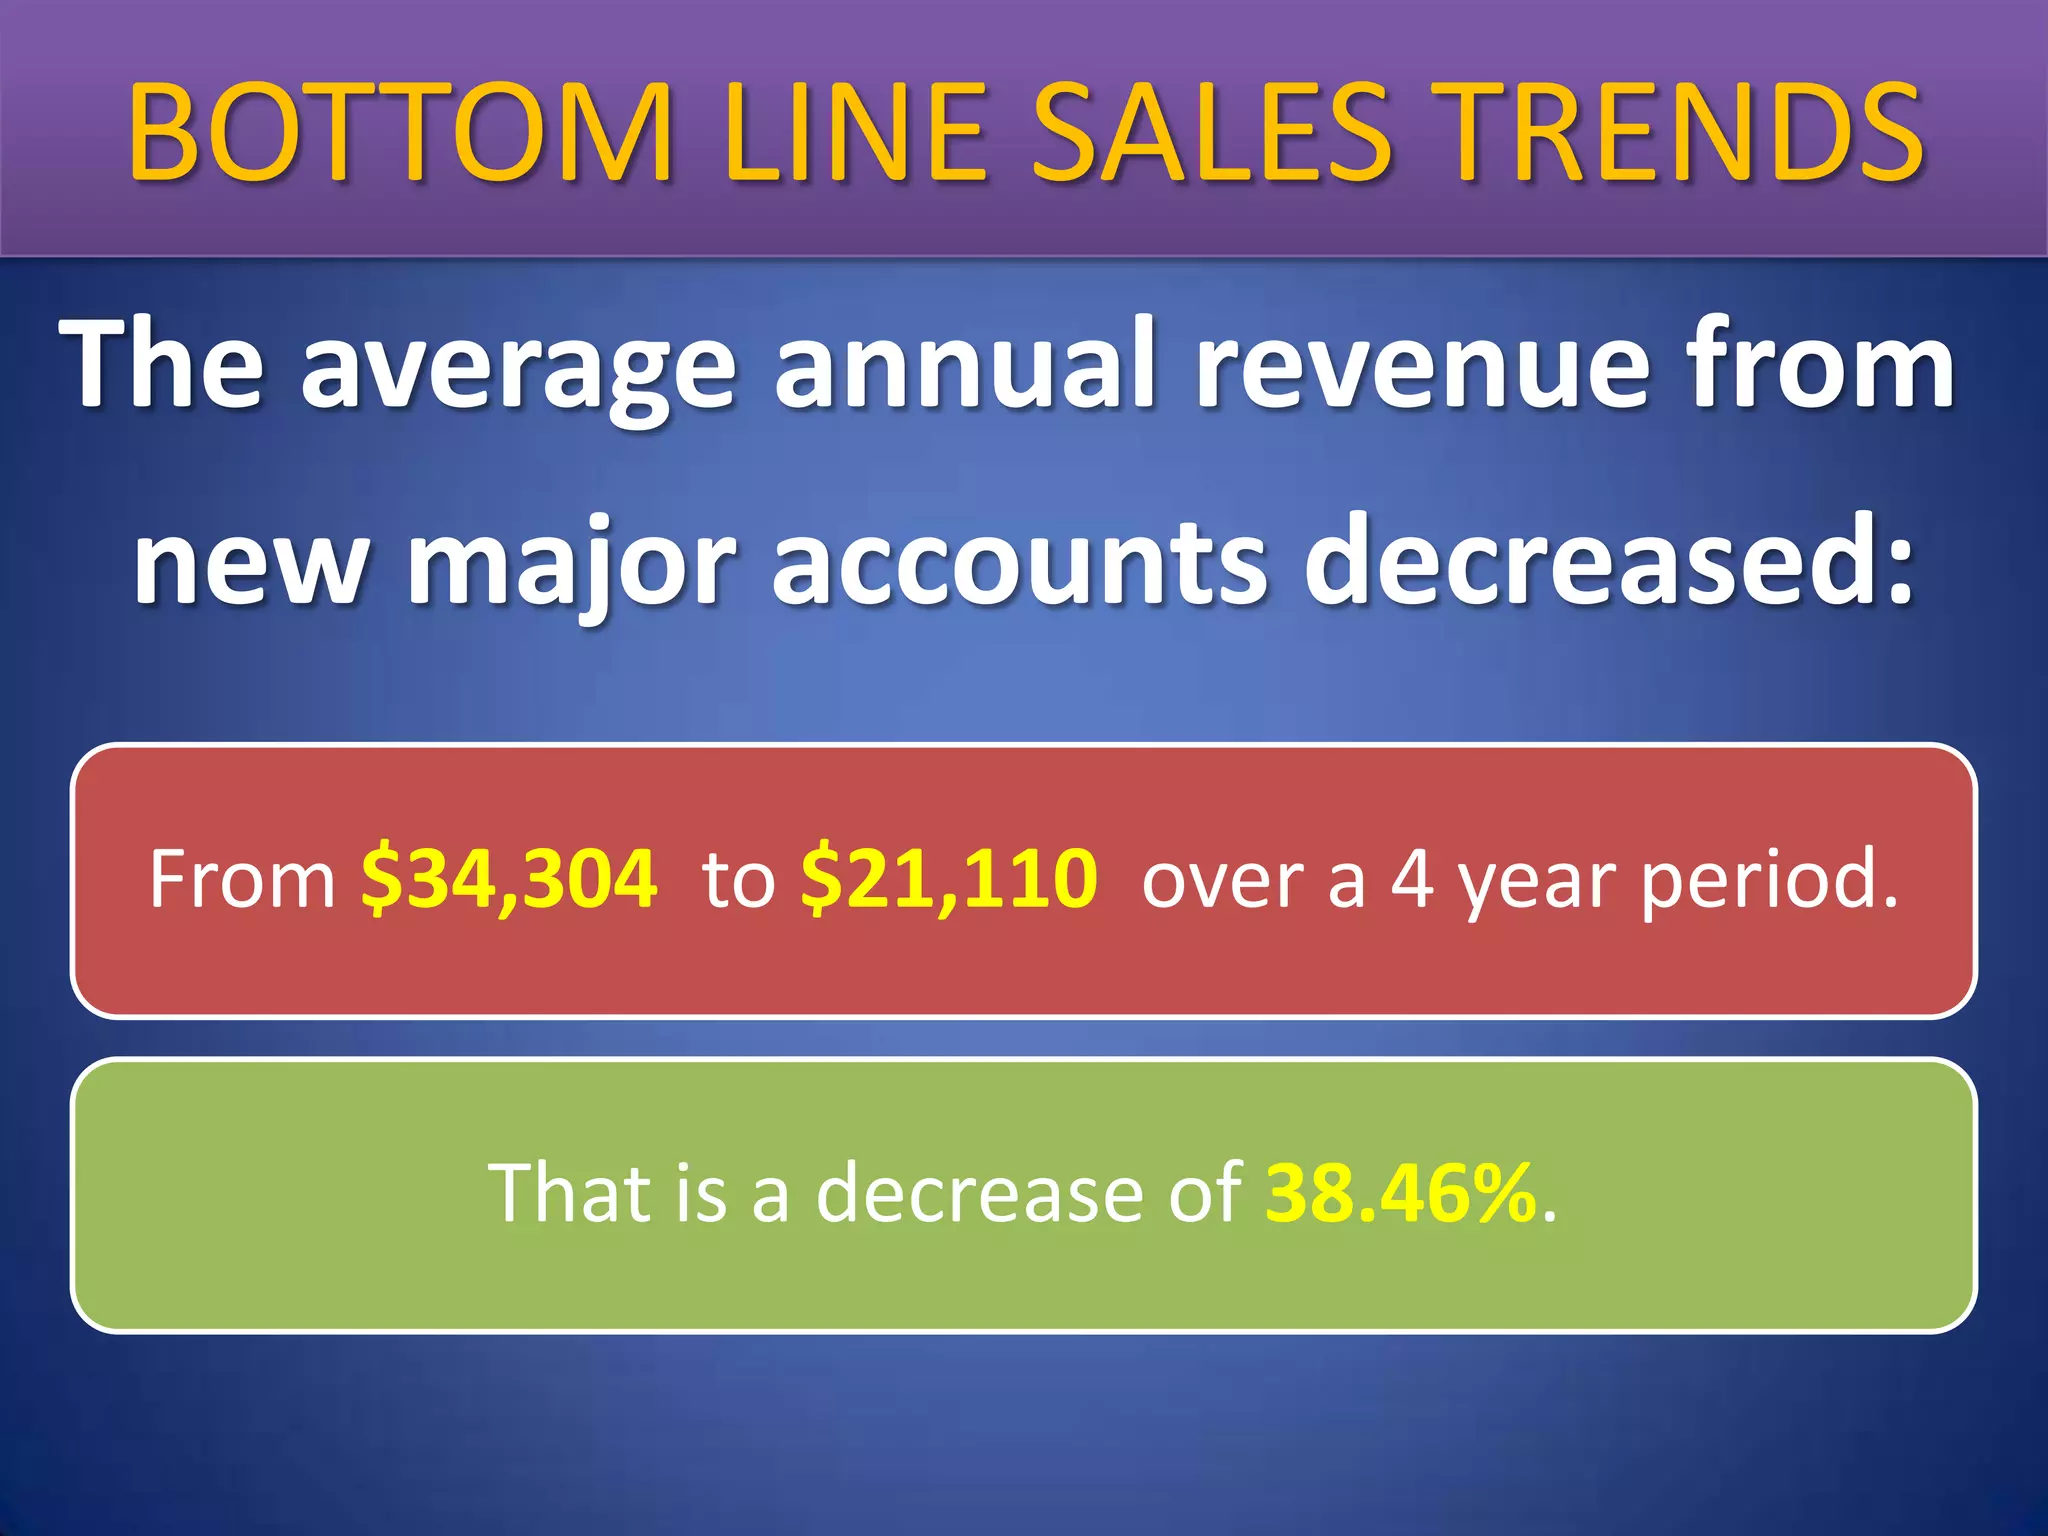

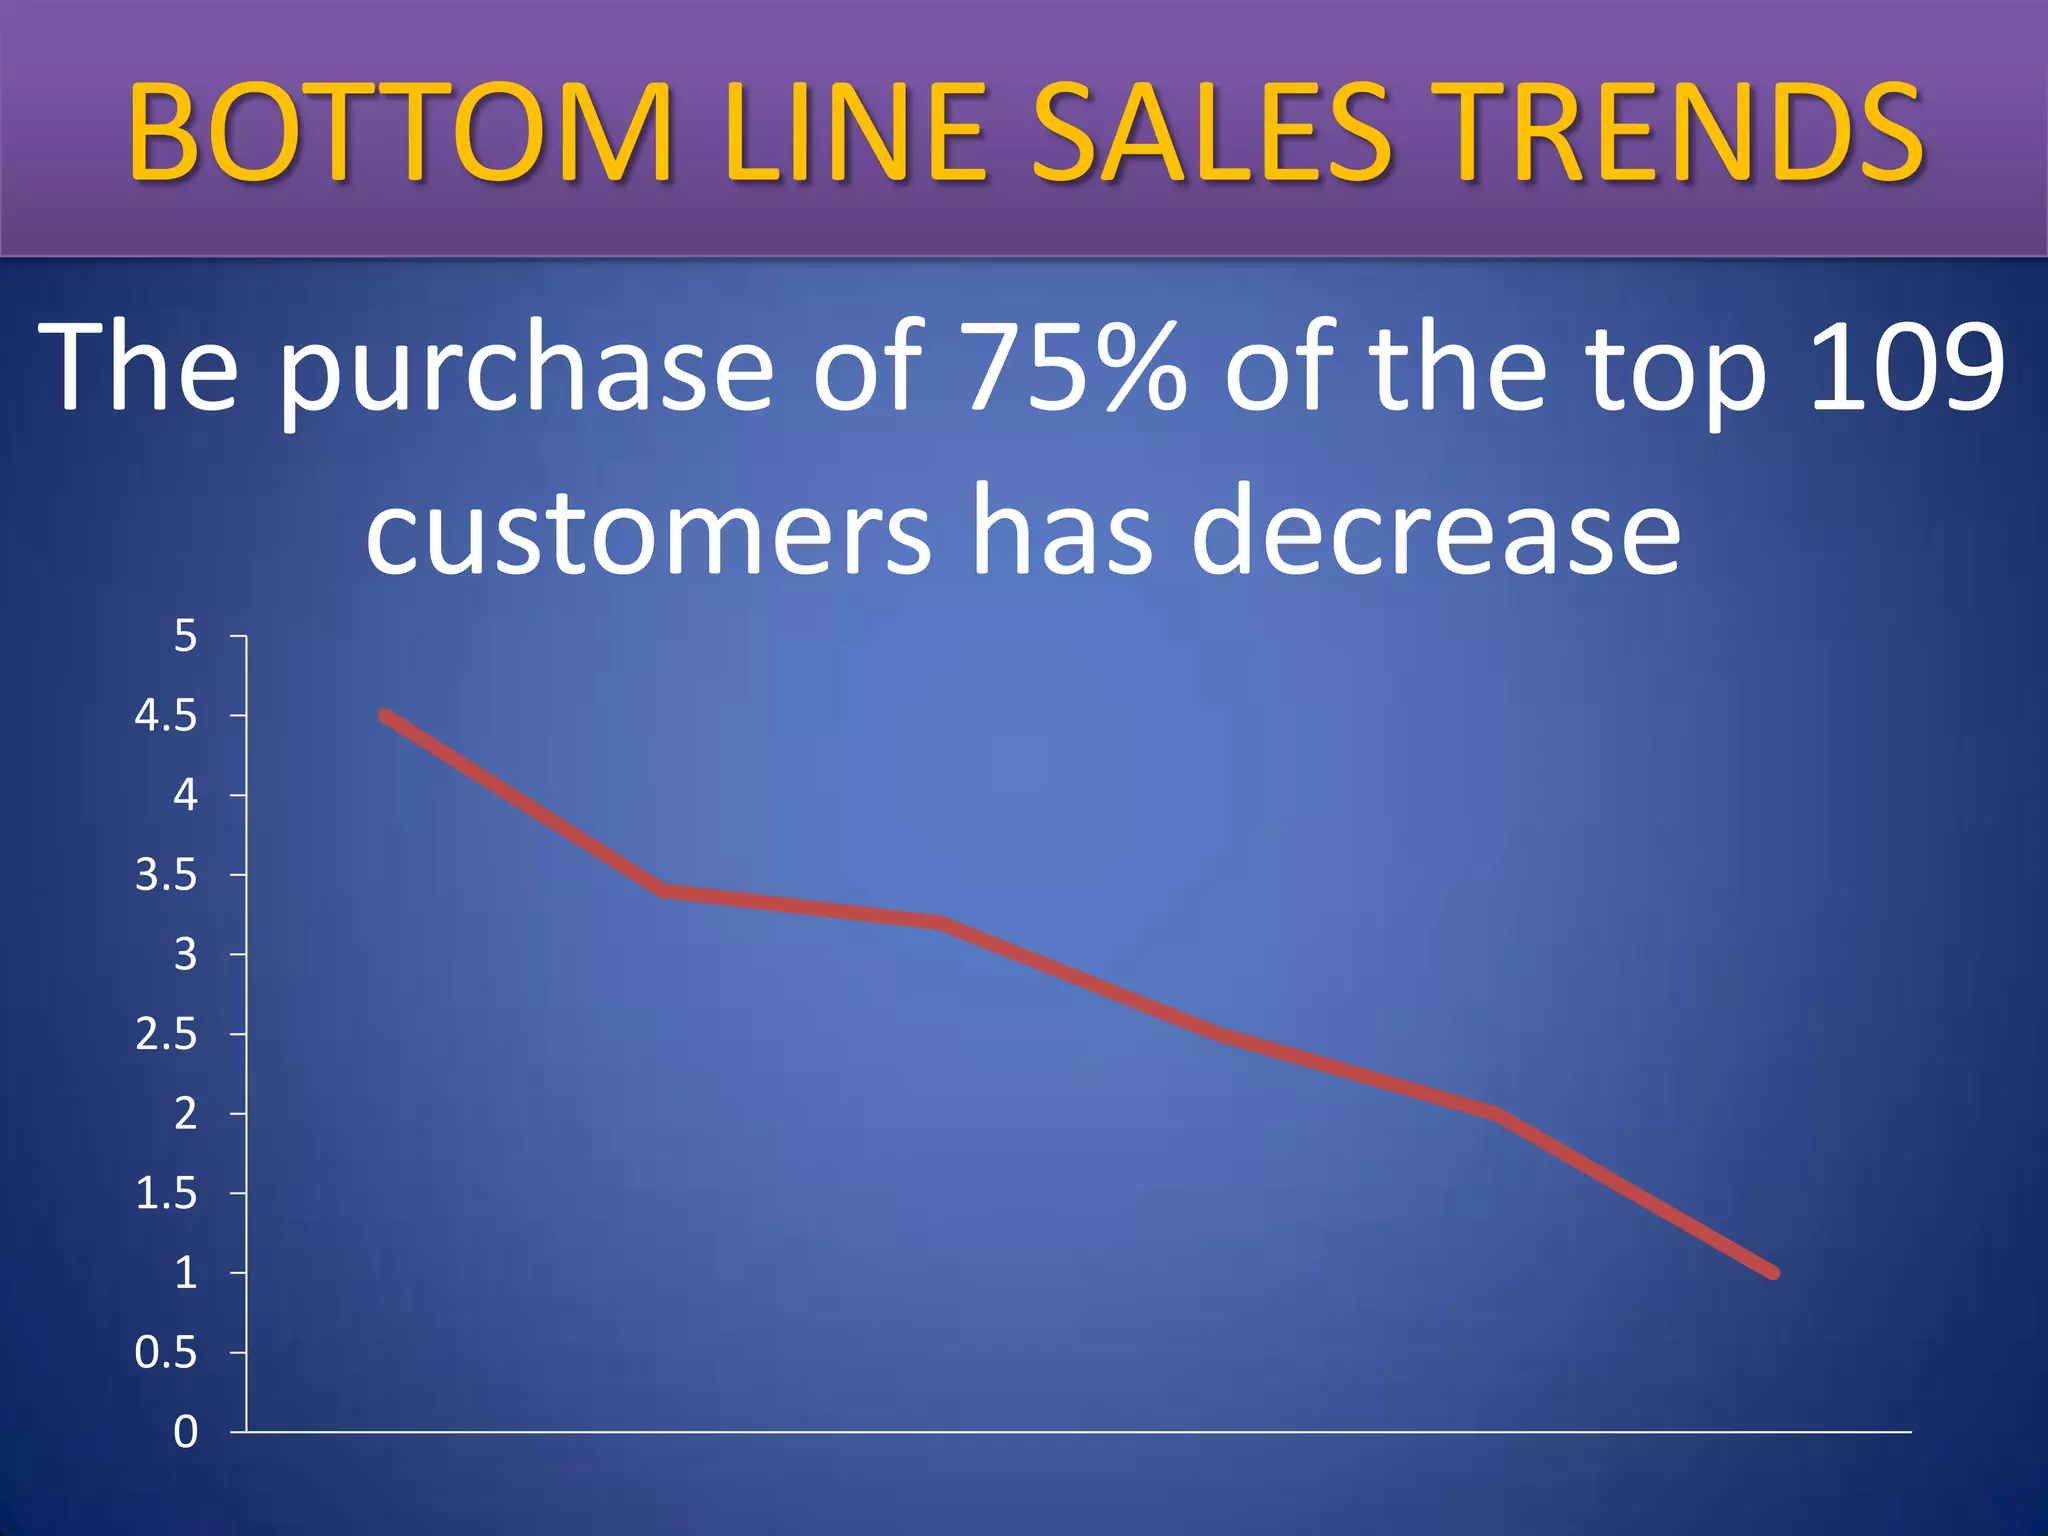

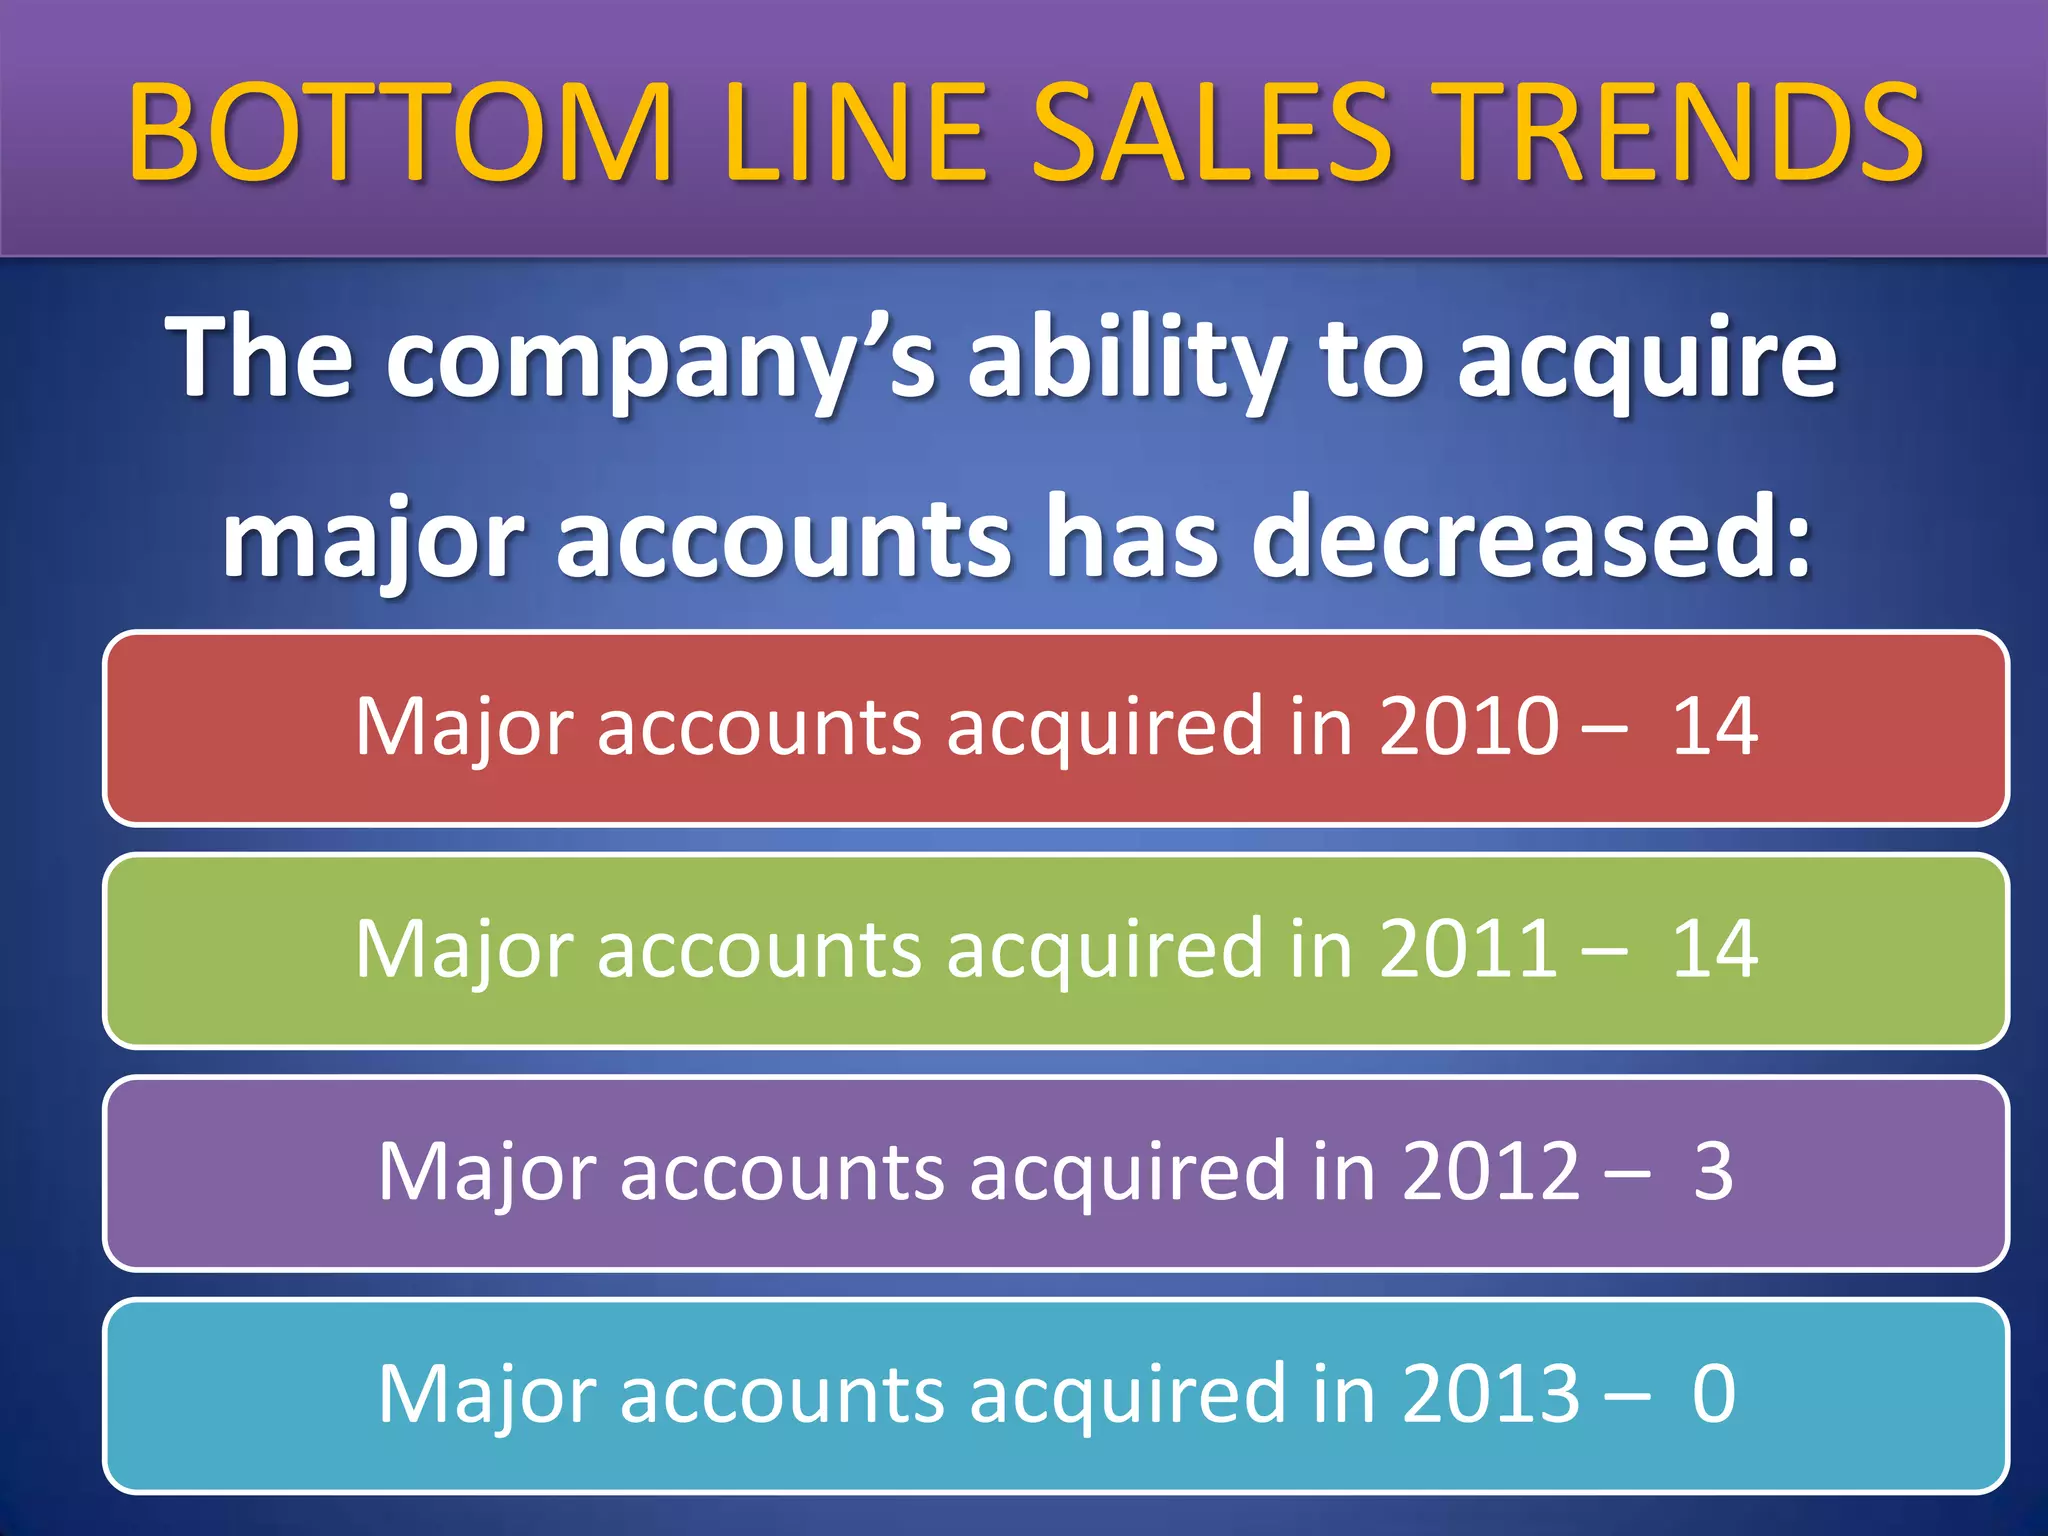
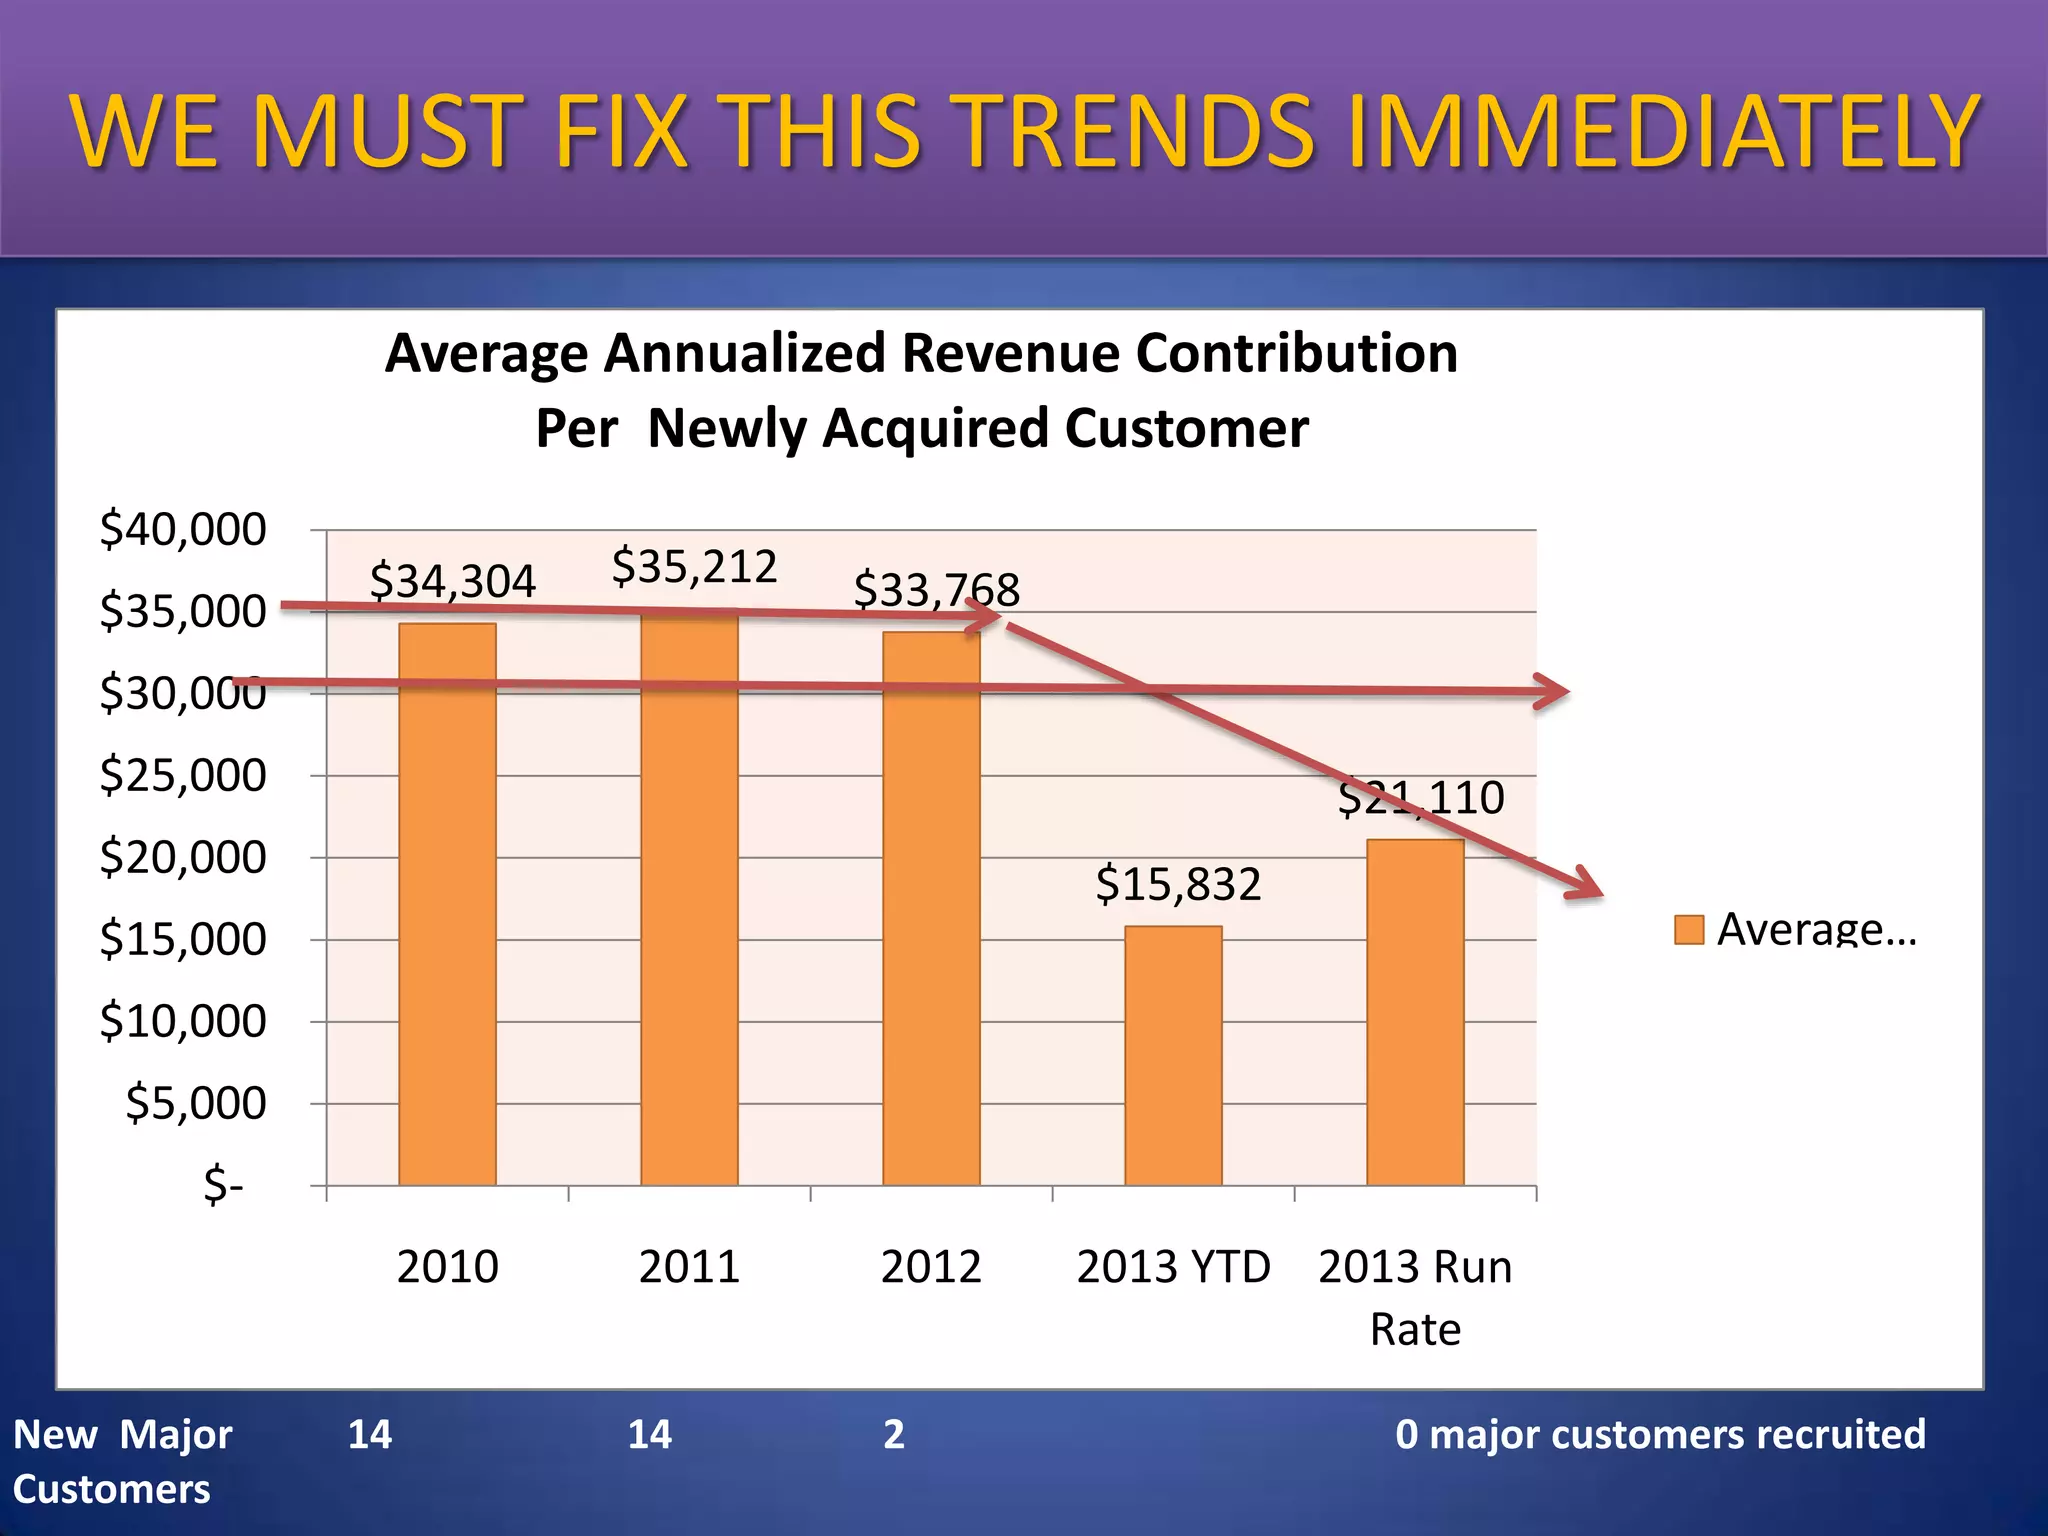
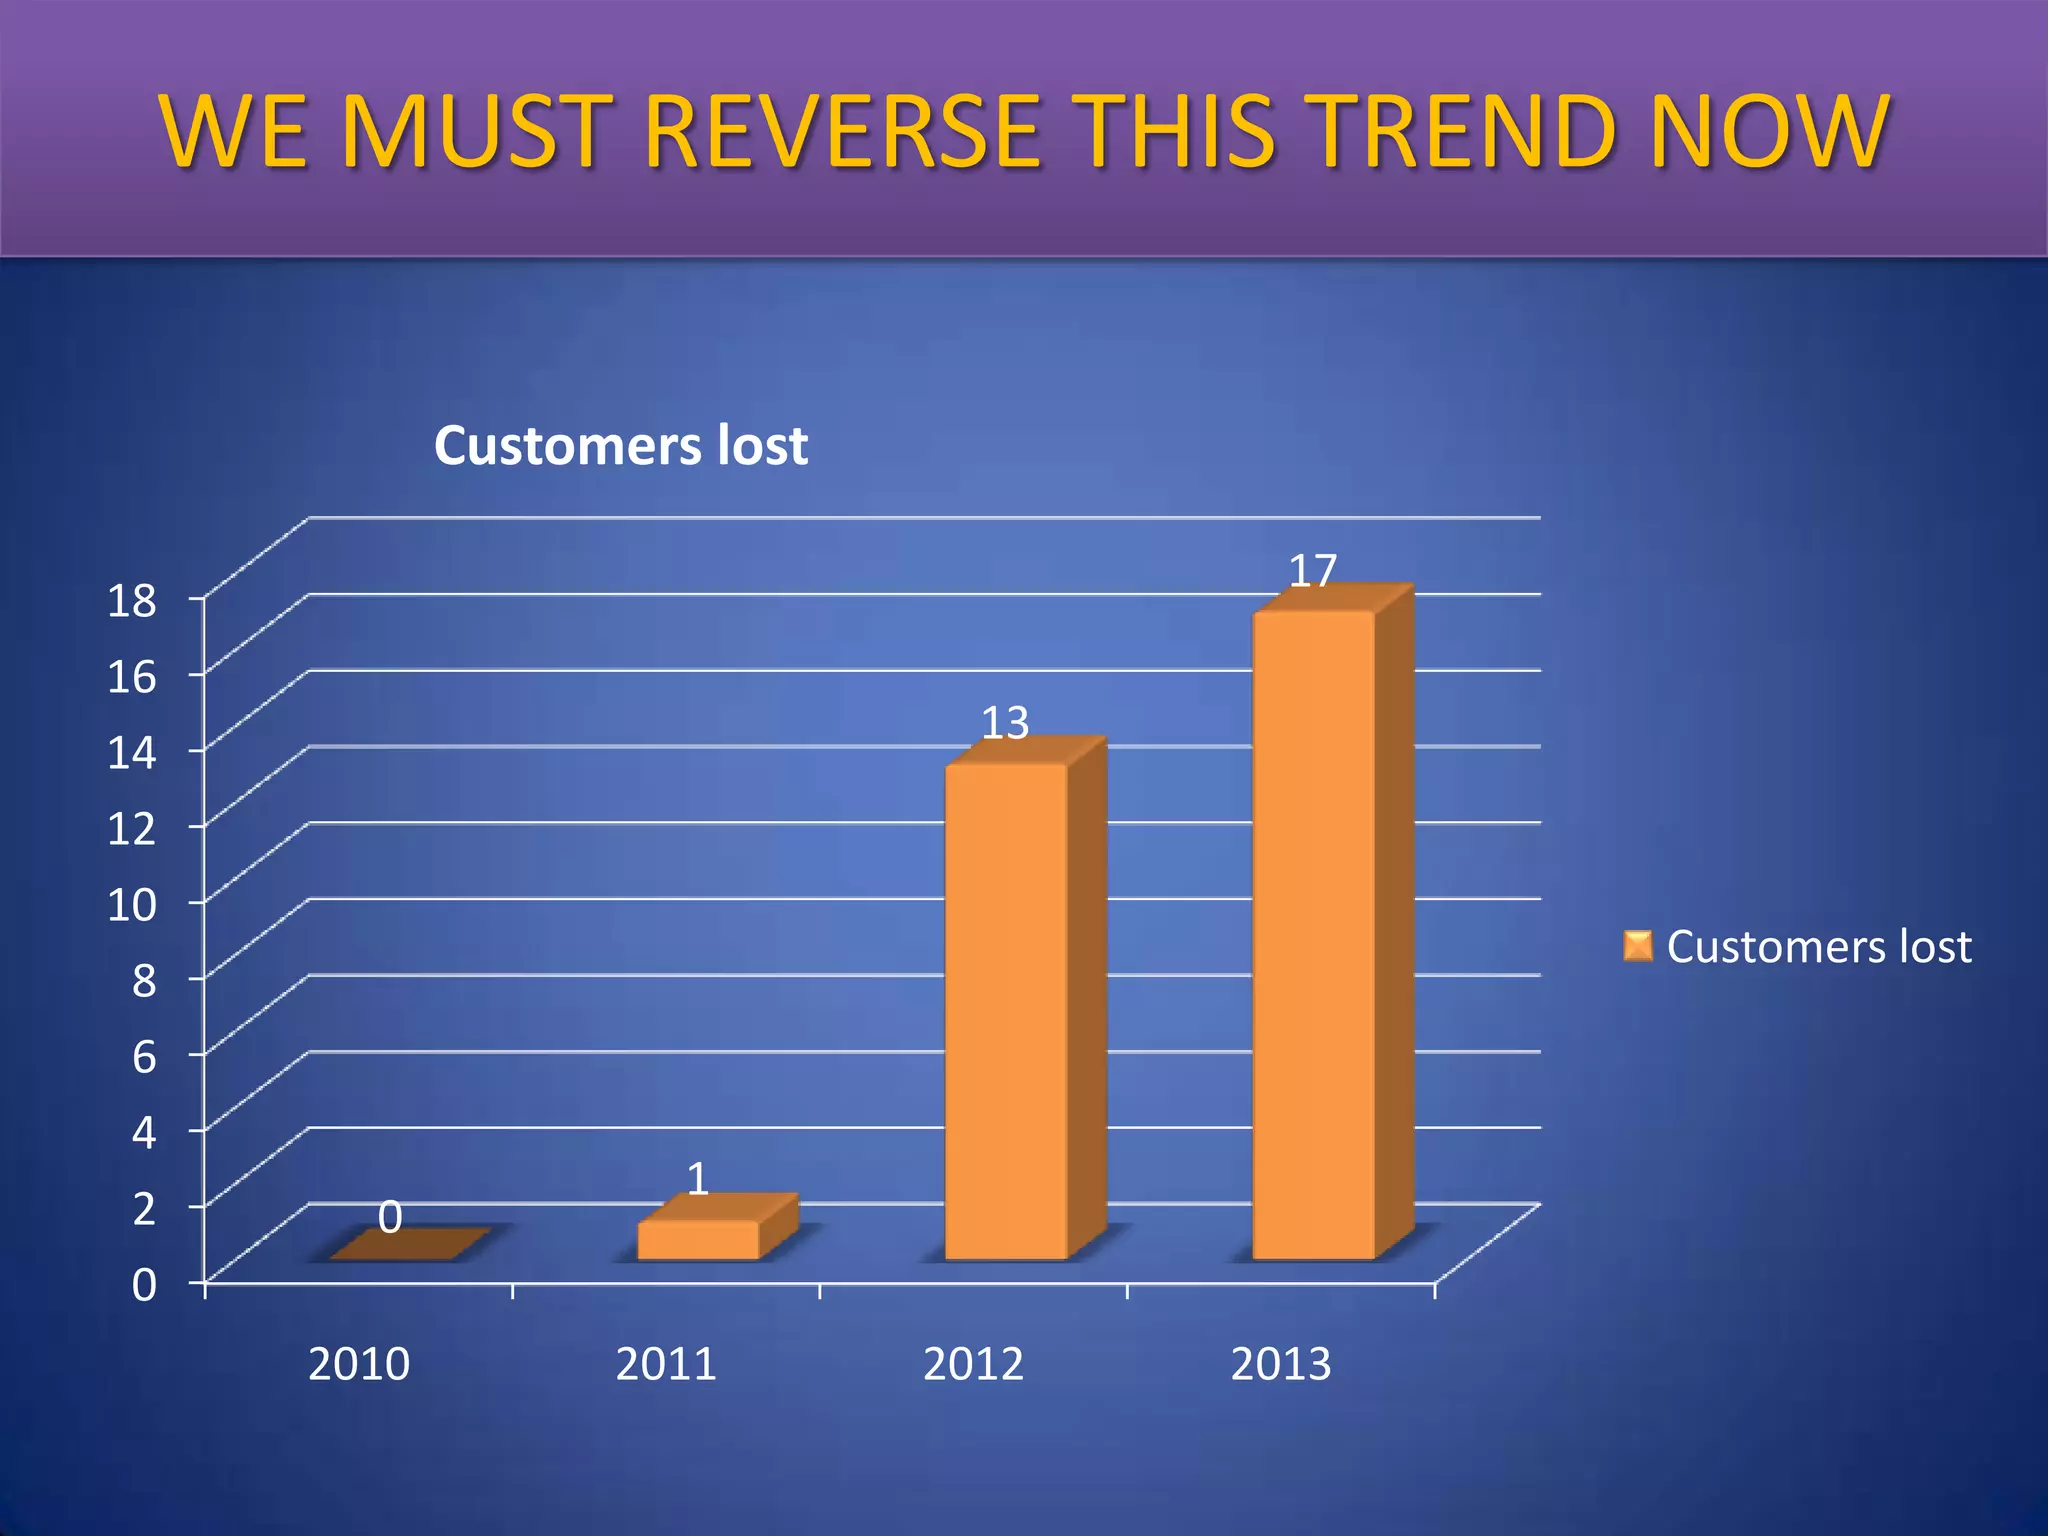
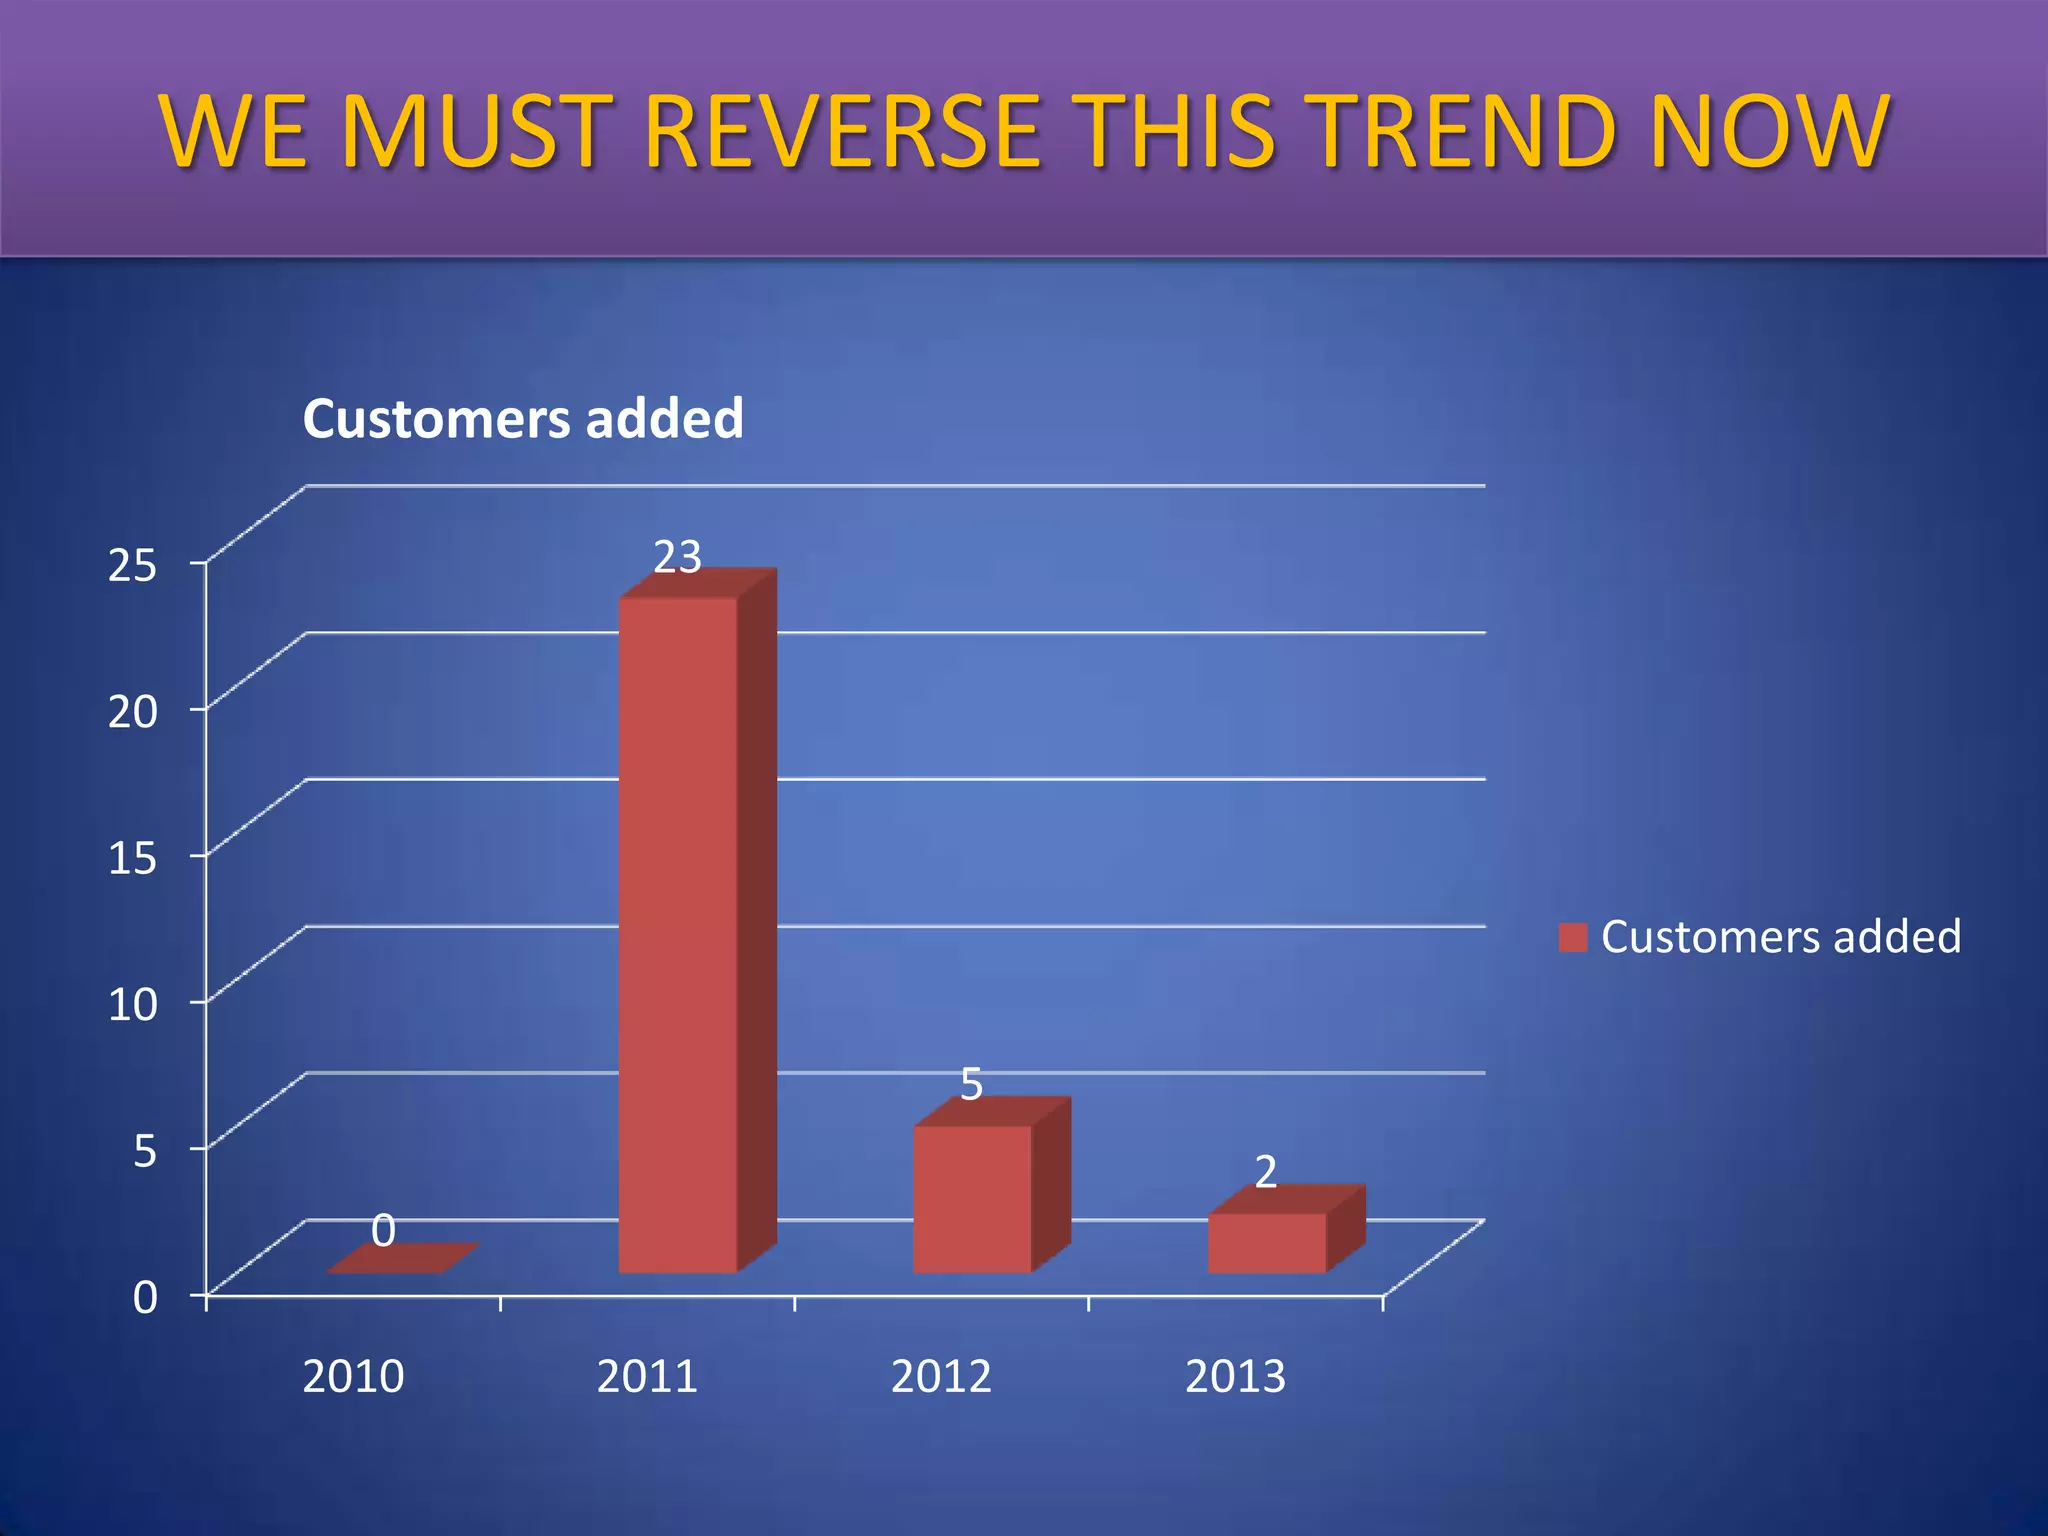
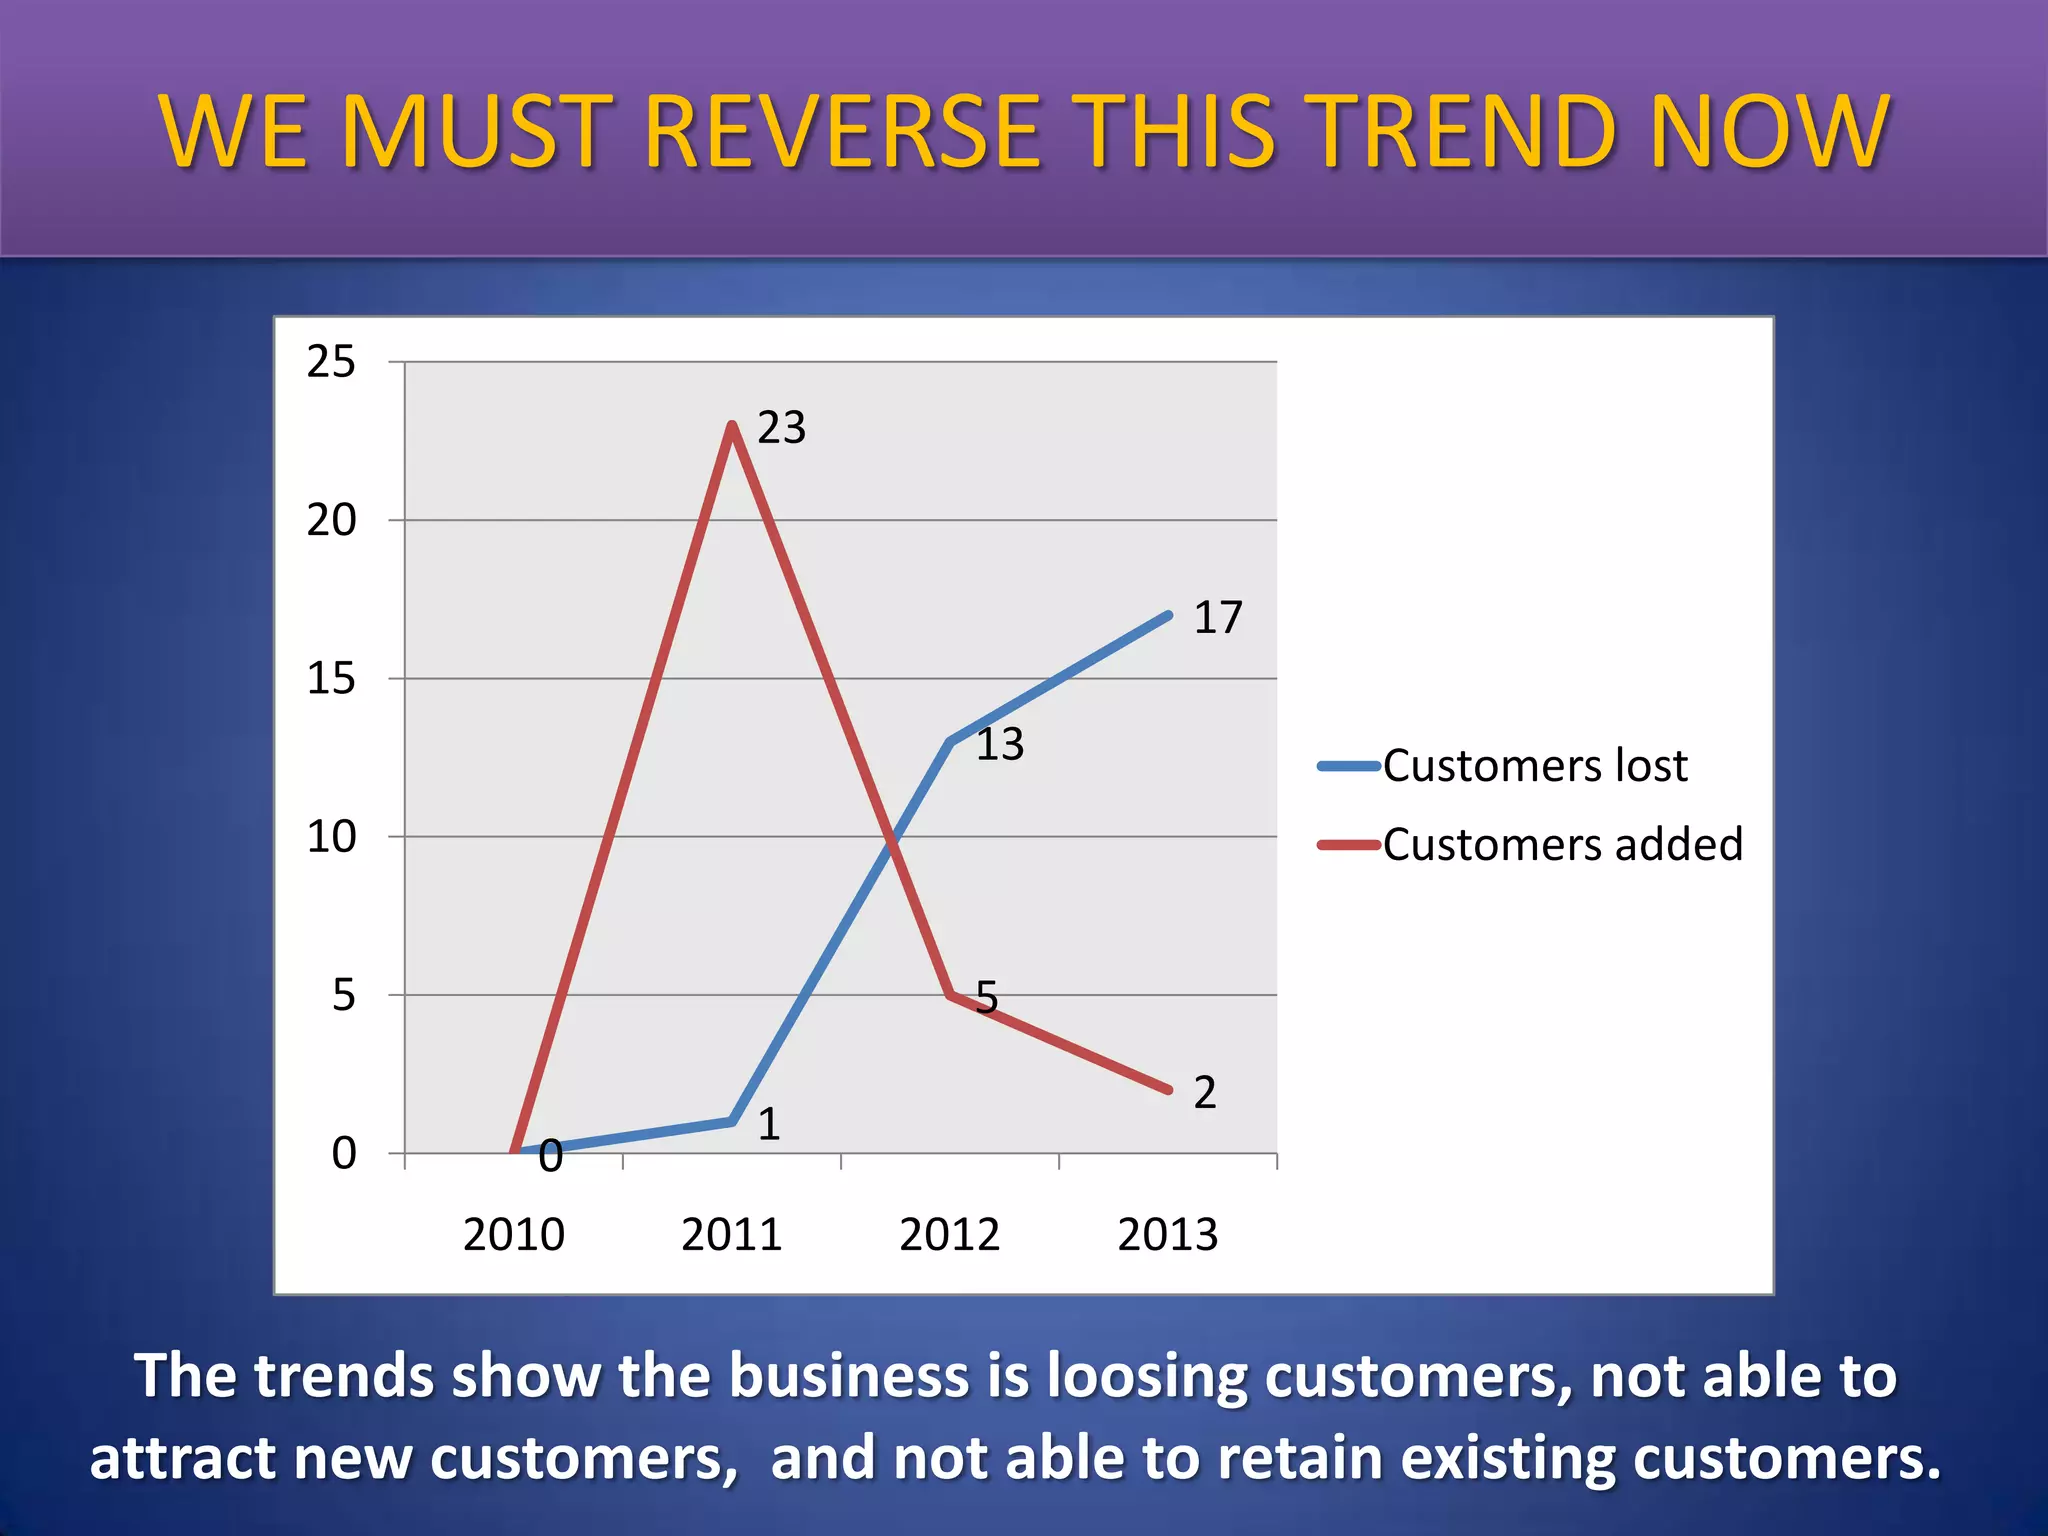
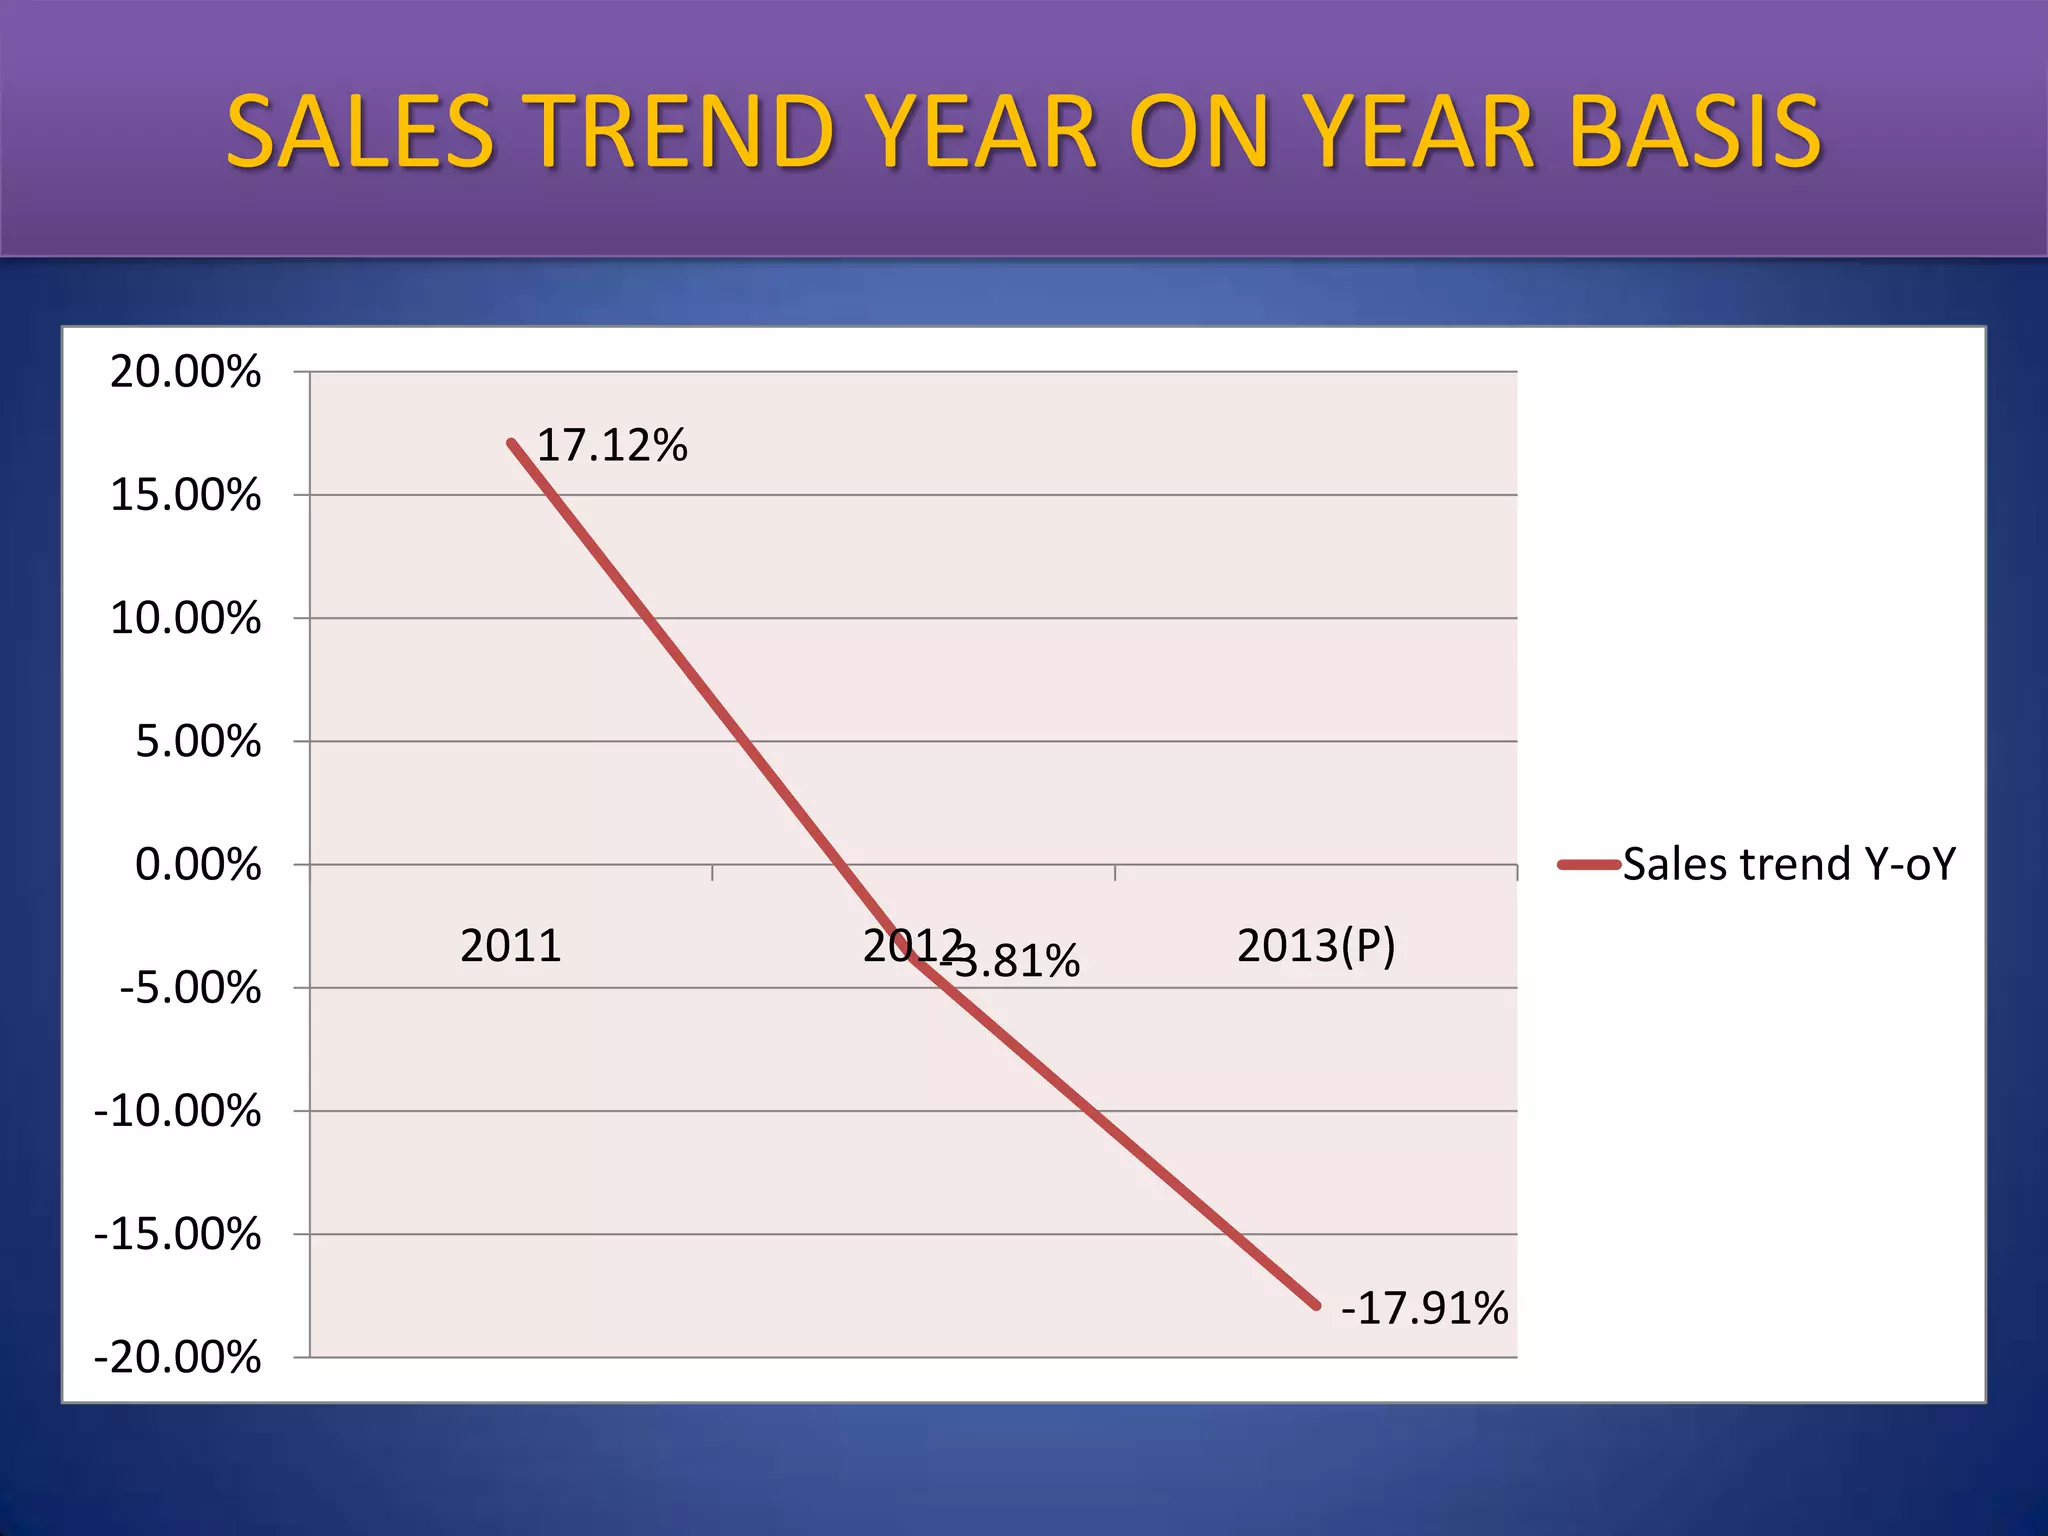

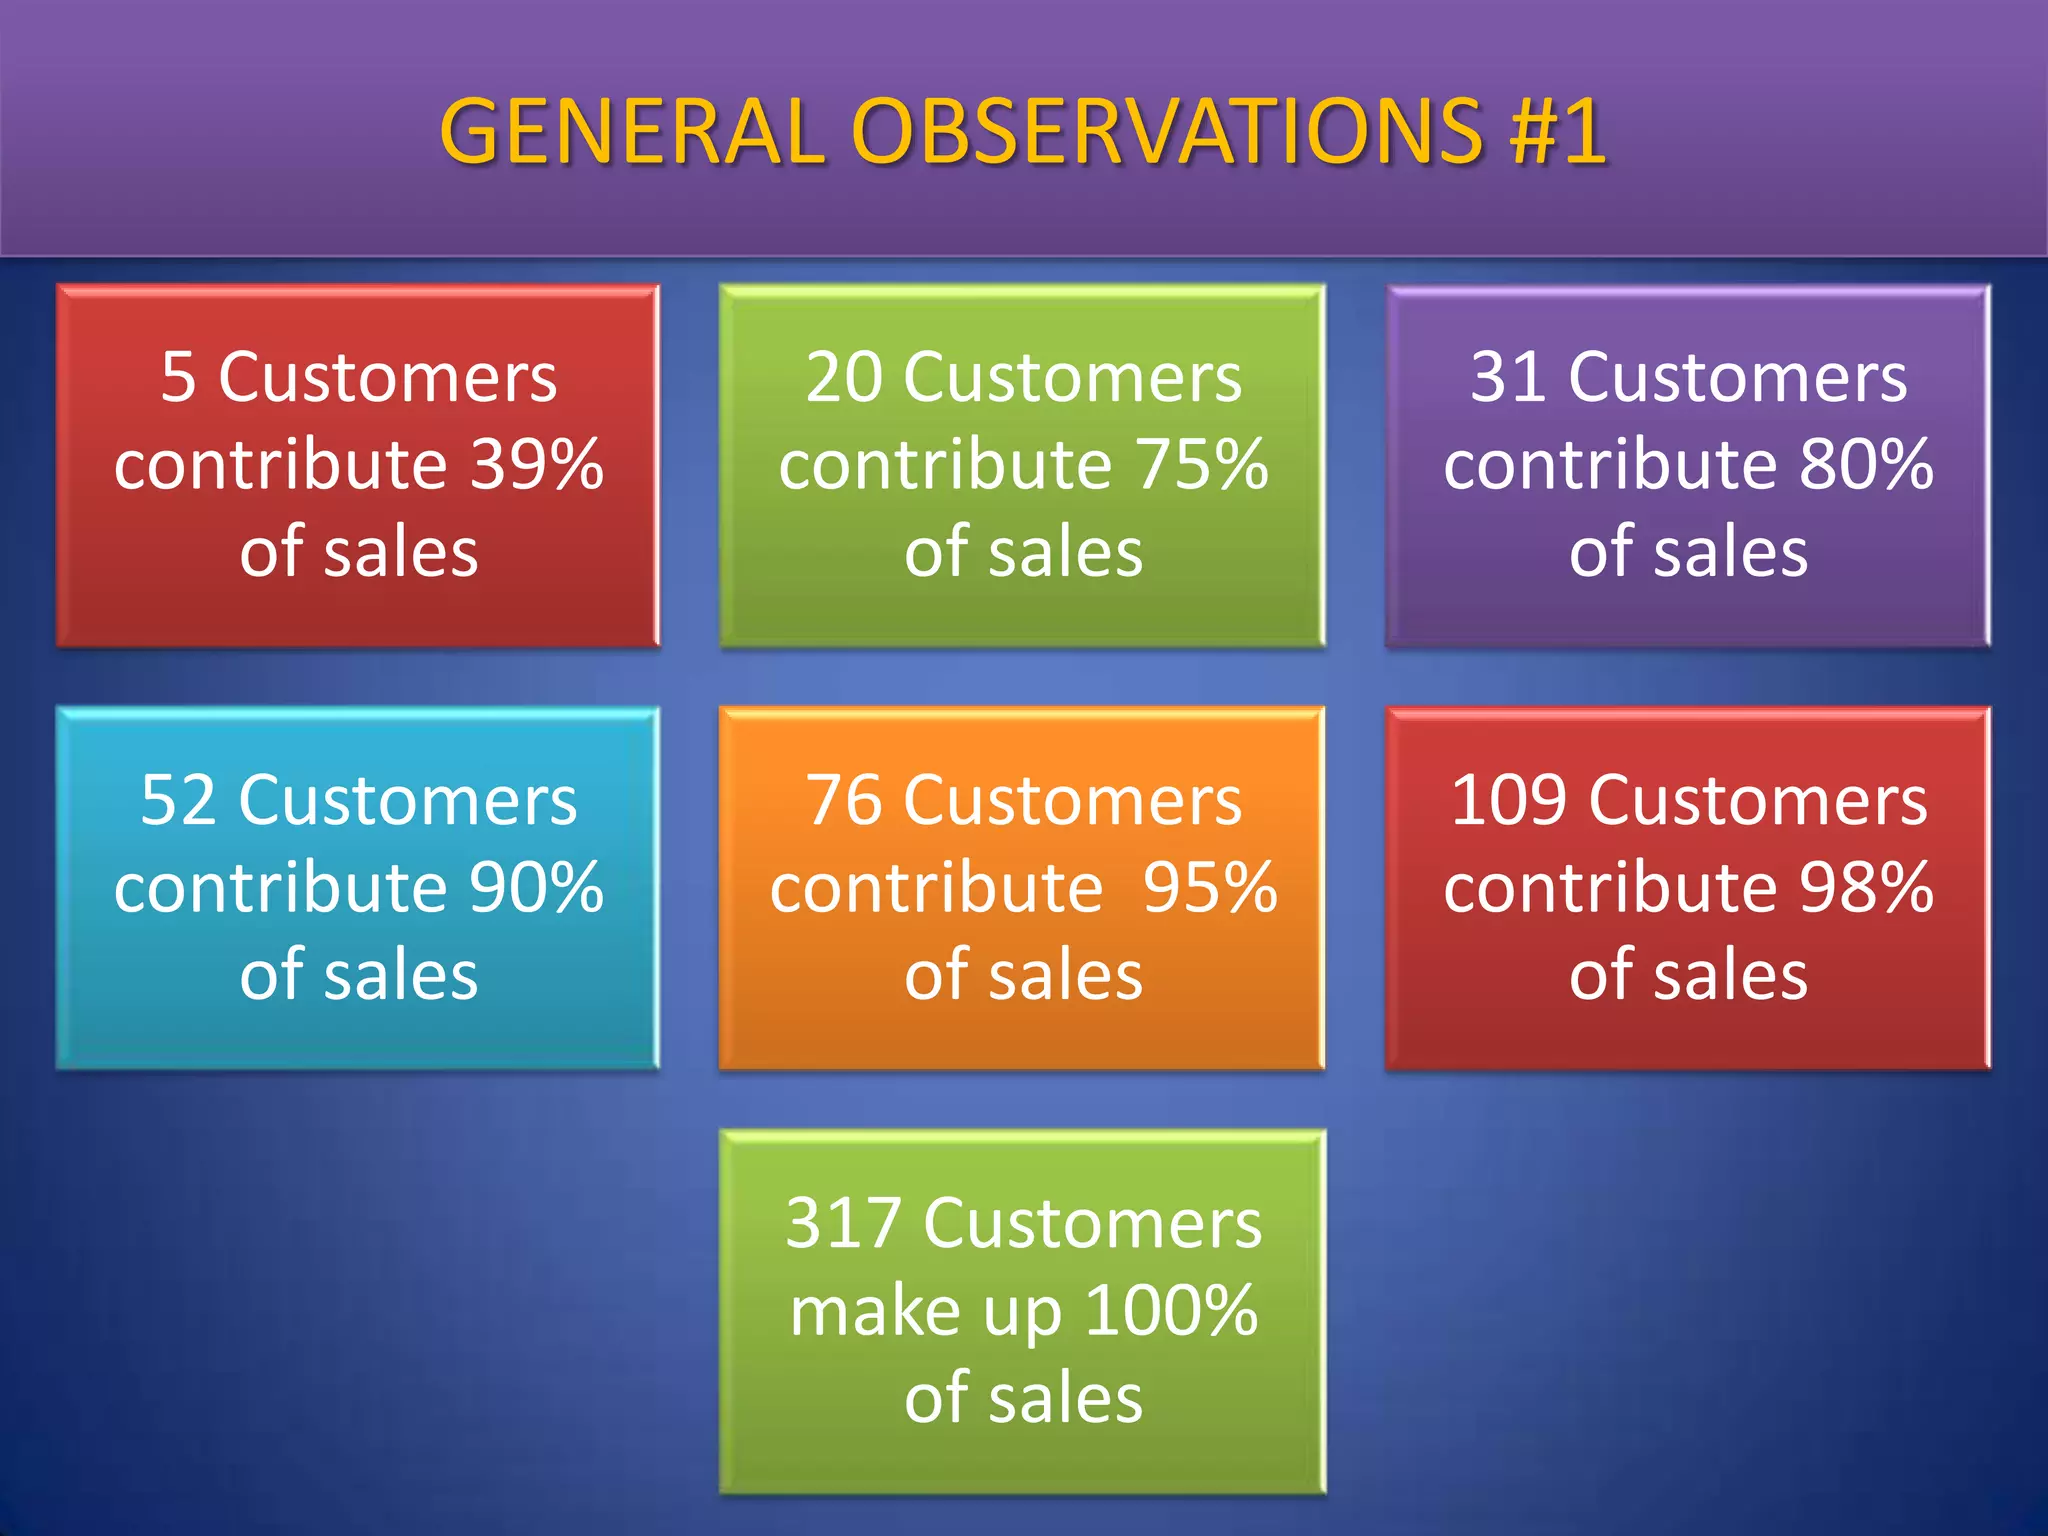
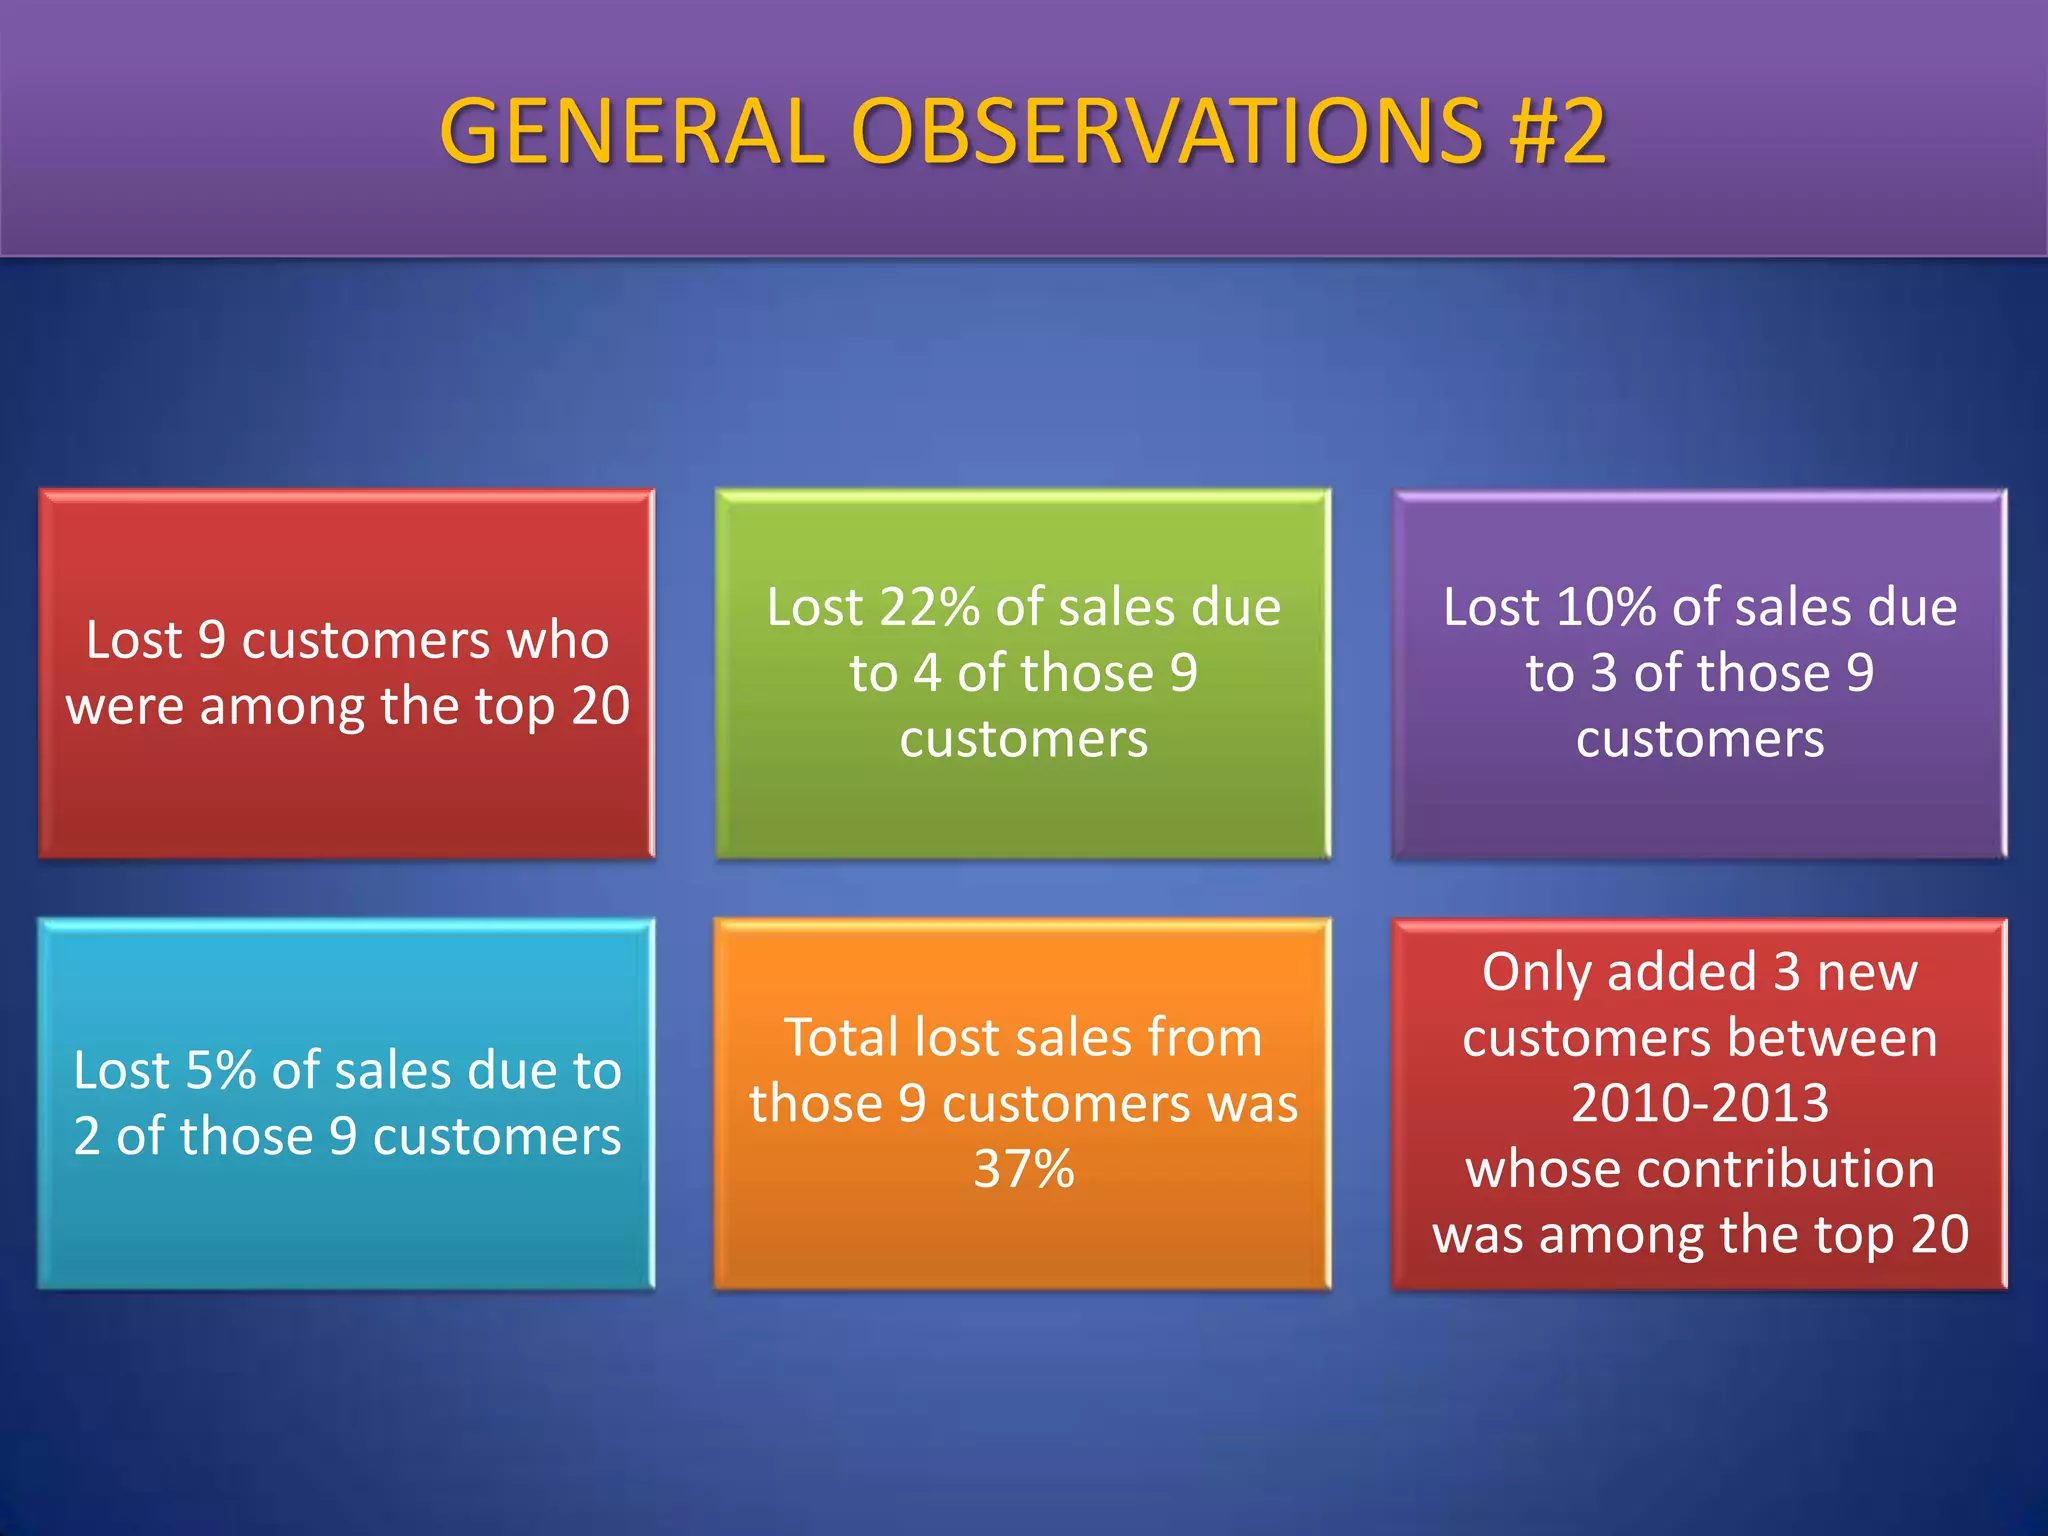
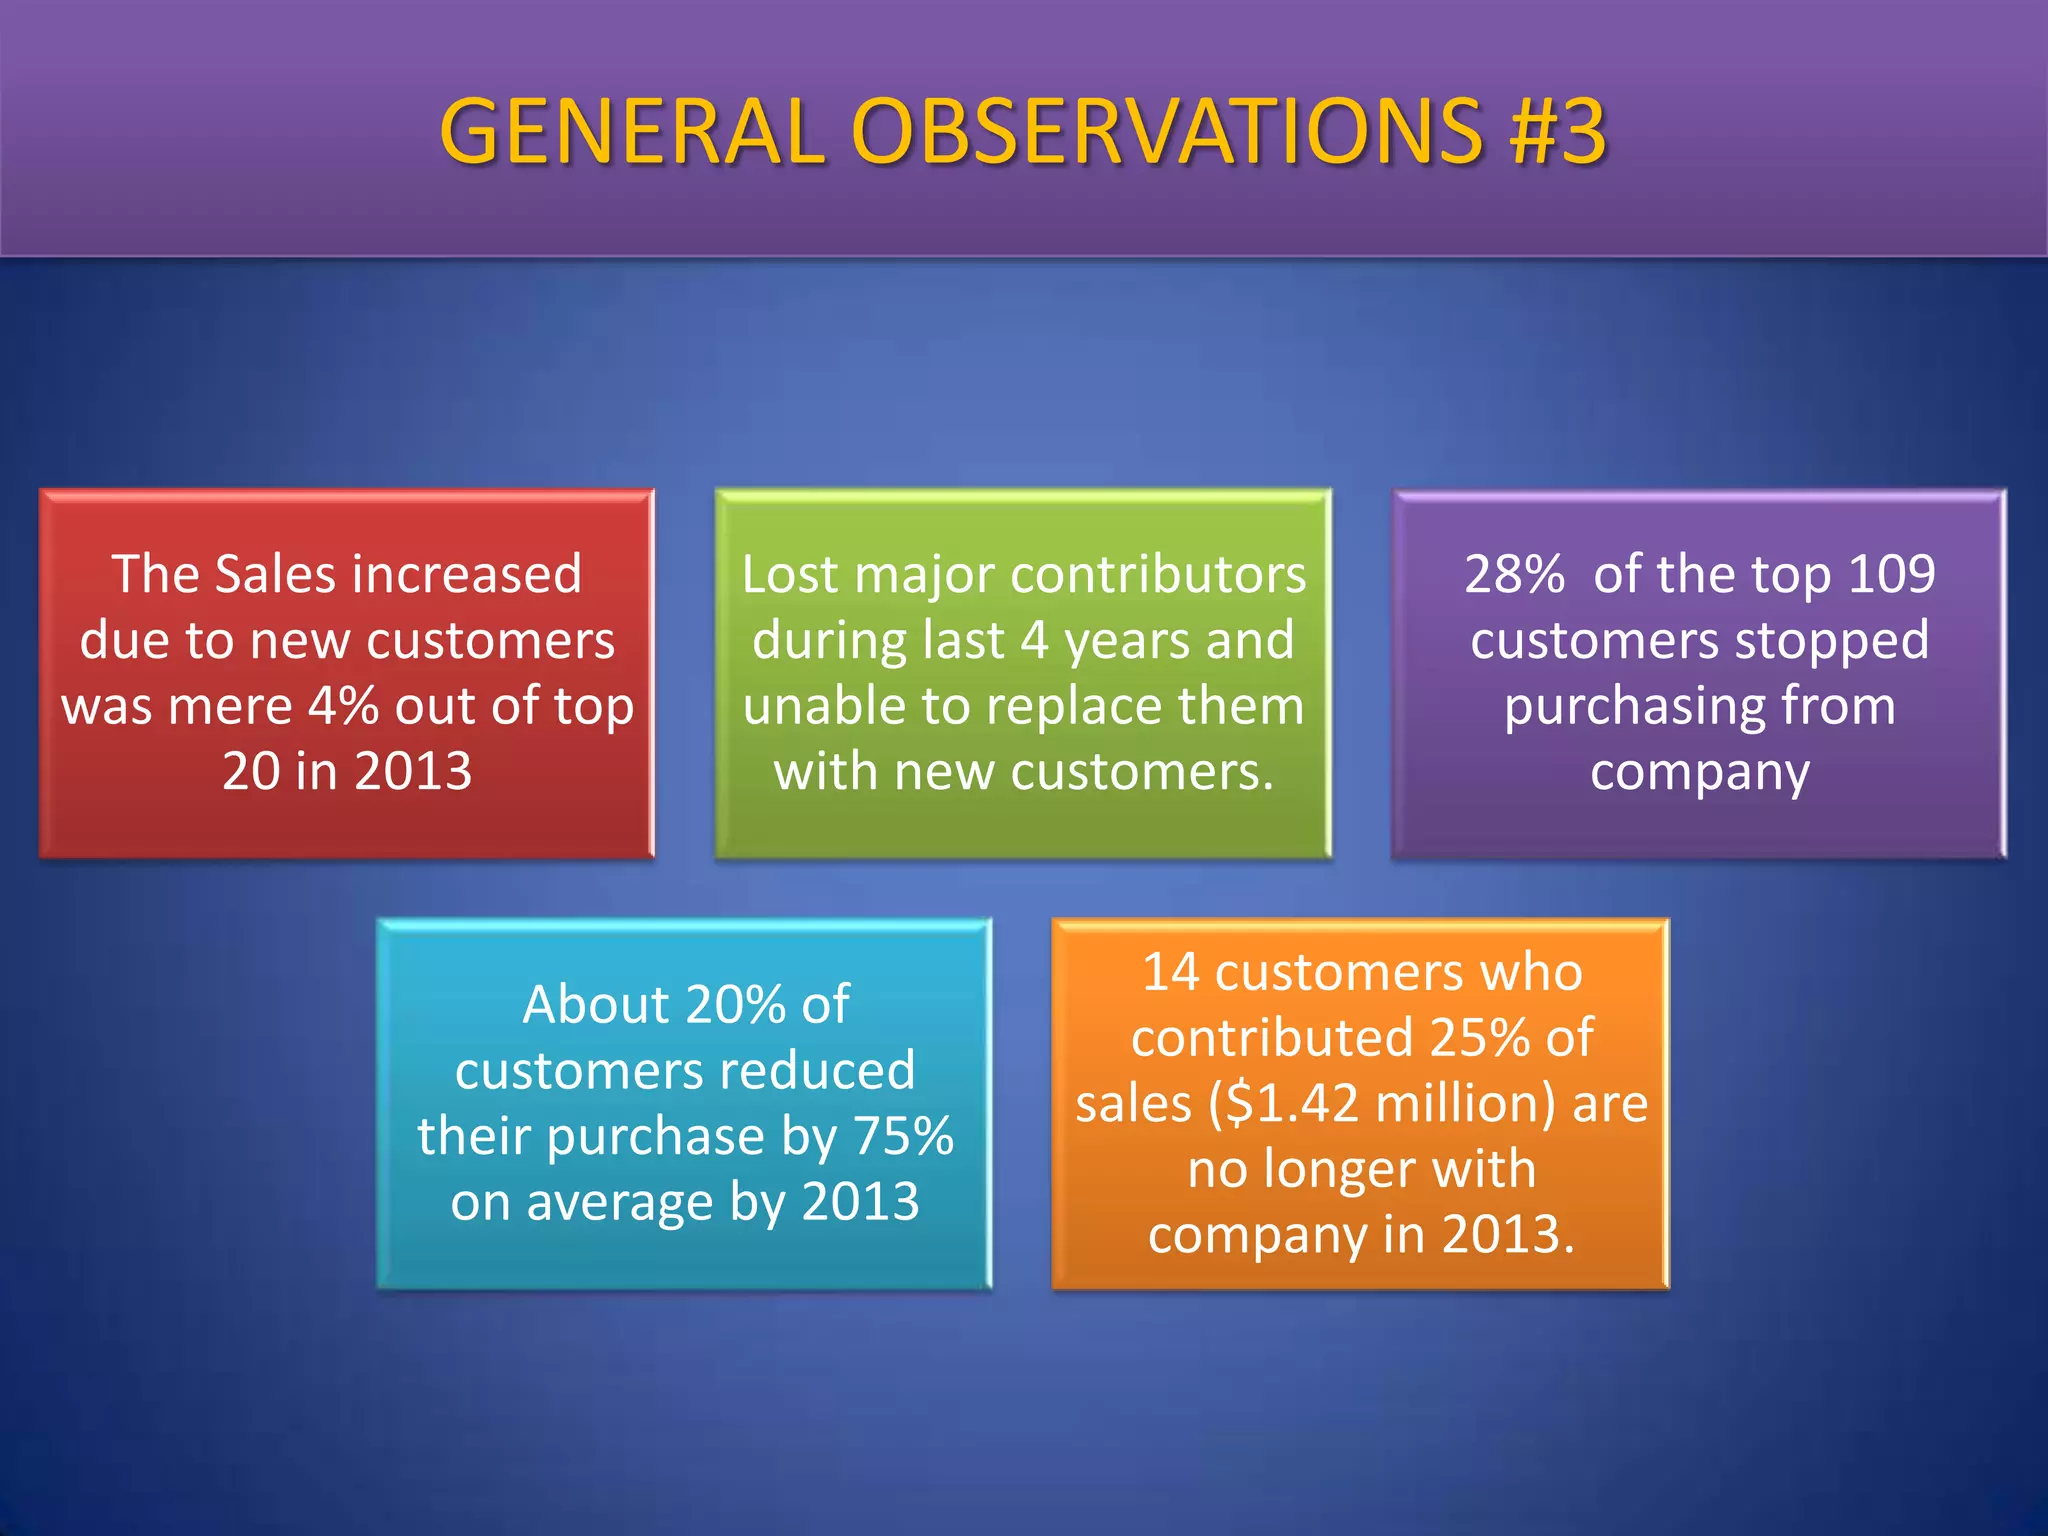
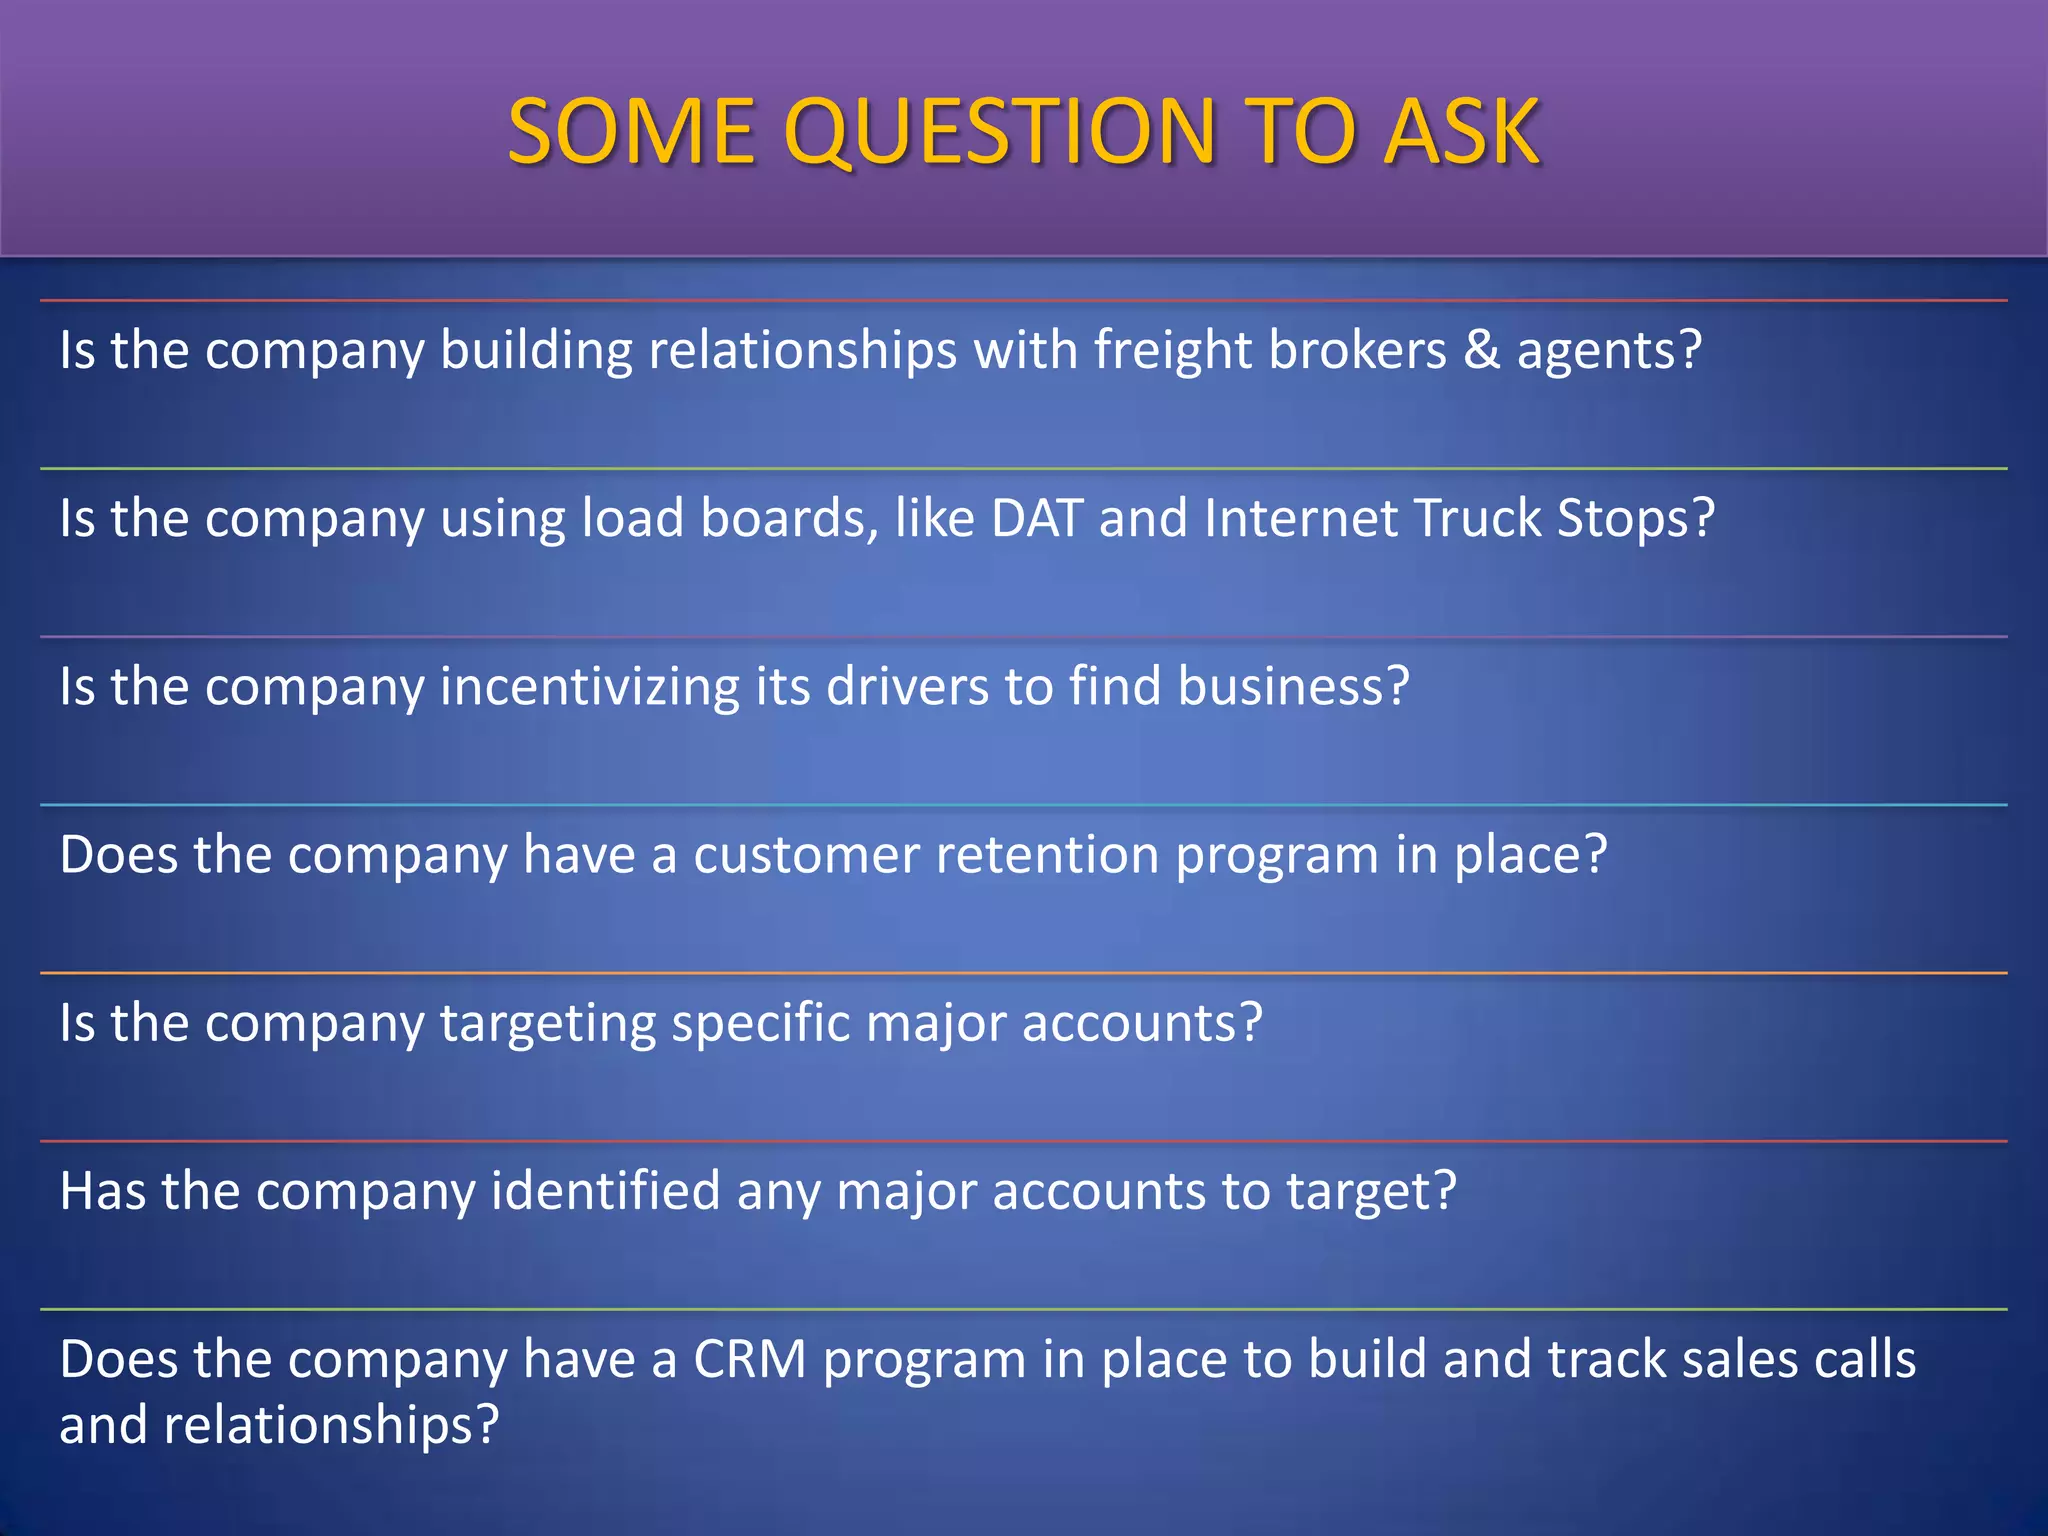


The document outlines a sales analysis for a company, indicating a decline in revenues of 3.8% from 2011 to 2012 and 17.9% from 2012 to 2013, with significant losses in major accounts over these years. It highlights the failure to attract new customers, retention issues, and a 38.46% decrease in average revenue from new major accounts, emphasizing the need for immediate strategic changes. Recommendations for improvement include assessing customer relationship management and incentivizing driver performance to enhance sales engagement.