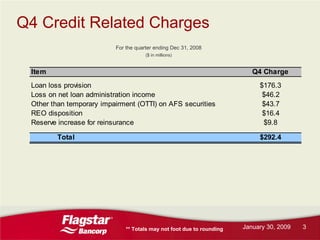
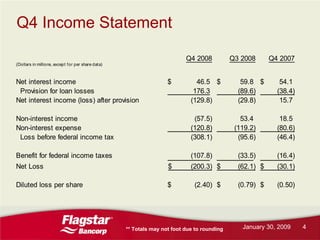
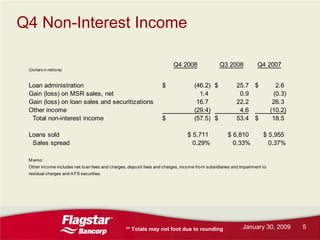
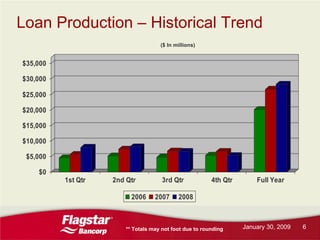
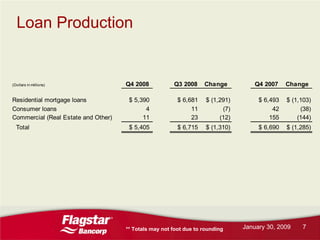
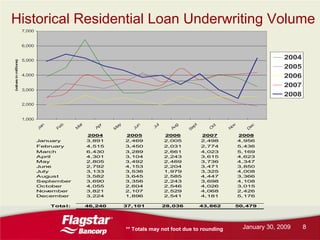
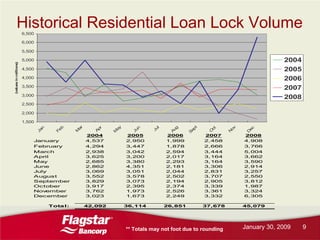
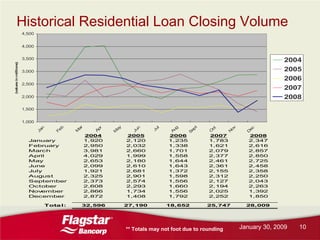
The document provides financial results for Flagstar Bancorp for Q4 2008, including a net loss of $200.3 million compared to a net loss of $62.1 million in Q3 2008. It also discusses factors impacting results such as a $176.3 million provision for loan losses. Additionally, the document reviews historical trends in loan production, underwriting, locks, and closings which have declined significantly from 2007 levels.
USDA Loans in California: A Comprehensive Overview.pptxmarketing367770
USDA Loans in California: A Comprehensive Overview
If you're dreaming of owning a home in California's rural or suburban areas, a USDA loan might be the perfect solution. The U.S. Department of Agriculture (USDA) offers these loans to help low-to-moderate-income individuals and families achieve homeownership.
Key Features of USDA Loans:
Zero Down Payment: USDA loans require no down payment, making homeownership more accessible.
Competitive Interest Rates: These loans often come with lower interest rates compared to conventional loans.
Flexible Credit Requirements: USDA loans have more lenient credit score requirements, helping those with less-than-perfect credit.
Guaranteed Loan Program: The USDA guarantees a portion of the loan, reducing risk for lenders and expanding borrowing options.
Eligibility Criteria:
Location: The property must be located in a USDA-designated rural or suburban area. Many areas in California qualify.
Income Limits: Applicants must meet income guidelines, which vary by region and household size.
Primary Residence: The home must be used as the borrower's primary residence.
Application Process:
Find a USDA-Approved Lender: Not all lenders offer USDA loans, so it's essential to choose one approved by the USDA.
Pre-Qualification: Determine your eligibility and the amount you can borrow.
Property Search: Look for properties in eligible rural or suburban areas.
Loan Application: Submit your application, including financial and personal information.
Processing and Approval: The lender and USDA will review your application. If approved, you can proceed to closing.
USDA loans are an excellent option for those looking to buy a home in California's rural and suburban areas. With no down payment and flexible requirements, these loans make homeownership more attainable for many families. Explore your eligibility today and take the first step toward owning your dream home.
Exploring Abhay Bhutada’s Views After Poonawalla Fincorp’s Collaboration With...beulahfernandes8
The financial landscape in India has witnessed a significant development with the recent collaboration between Poonawalla Fincorp and IndusInd Bank.
The launch of the co-branded credit card, the IndusInd Bank Poonawalla Fincorp eLITE RuPay Platinum Credit Card, marks a major milestone for both entities.
This strategic move aims to redefine and elevate the banking experience for customers.
how to sell pi coins in all Africa Countries.DOT TECH
Yes. You can sell your pi network for other cryptocurrencies like Bitcoin, usdt , Ethereum and other currencies And this is done easily with the help from a pi merchant.
What is a pi merchant ?
Since pi is not launched yet in any exchange. The only way you can sell right now is through merchants.
A verified Pi merchant is someone who buys pi network coins from miners and resell them to investors looking forward to hold massive quantities of pi coins before mainnet launch in 2026.
I will leave the telegram contact of my personal pi merchant to trade with.
@Pi_vendor_247
The Evolution of Non-Banking Financial Companies (NBFCs) in India: Challenges...beulahfernandes8
Role in Financial System
NBFCs are critical in bridging the financial inclusion gap.
They provide specialized financial services that cater to segments often neglected by traditional banks.
Economic Impact
NBFCs contribute significantly to India's GDP.
They support sectors like micro, small, and medium enterprises (MSMEs), housing finance, and personal loans.
how can i use my minded pi coins I need some funds.DOT TECH
If you are interested in selling your pi coins, i have a verified pi merchant, who buys pi coins and resell them to exchanges looking forward to hold till mainnet launch.
Because the core team has announced that pi network will not be doing any pre-sale. The only way exchanges like huobi, bitmart and hotbit can get pi is by buying from miners.
Now a merchant stands in between these exchanges and the miners. As a link to make transactions smooth. Because right now in the enclosed mainnet you can't sell pi coins your self. You need the help of a merchant,
i will leave the telegram contact of my personal pi merchant below. 👇 I and my friends has traded more than 3000pi coins with him successfully.
@Pi_vendor_247
Poonawalla Fincorp and IndusInd Bank Introduce New Co-Branded Credit Cardnickysharmasucks
The unveiling of the IndusInd Bank Poonawalla Fincorp eLITE RuPay Platinum Credit Card marks a notable milestone in the Indian financial landscape, showcasing a successful partnership between two leading institutions, Poonawalla Fincorp and IndusInd Bank. This co-branded credit card not only offers users a plethora of benefits but also reflects a commitment to innovation and adaptation. With a focus on providing value-driven and customer-centric solutions, this launch represents more than just a new product—it signifies a step towards redefining the banking experience for millions. Promising convenience, rewards, and a touch of luxury in everyday financial transactions, this collaboration aims to cater to the evolving needs of customers and set new standards in the industry.
when will pi network coin be available on crypto exchange.DOT TECH
There is no set date for when Pi coins will enter the market.
However, the developers are working hard to get them released as soon as possible.
Once they are available, users will be able to exchange other cryptocurrencies for Pi coins on designated exchanges.
But for now the only way to sell your pi coins is through verified pi vendor.
Here is the telegram contact of my personal pi vendor
@Pi_vendor_247
how to sell pi coins effectively (from 50 - 100k pi)DOT TECH
Anywhere in the world, including Africa, America, and Europe, you can sell Pi Network Coins online and receive cash through online payment options.
Pi has not yet been launched on any exchange because we are currently using the confined Mainnet. The planned launch date for Pi is June 28, 2026.
Reselling to investors who want to hold until the mainnet launch in 2026 is currently the sole way to sell.
Consequently, right now. All you need to do is select the right pi network provider.
Who is a pi merchant?
An individual who buys coins from miners on the pi network and resells them to investors hoping to hang onto them until the mainnet is launched is known as a pi merchant.
debuts.
I'll provide you the Telegram username
@Pi_vendor_247
The secret way to sell pi coins effortlessly.DOT TECH
Well as we all know pi isn't launched yet. But you can still sell your pi coins effortlessly because some whales in China are interested in holding massive pi coins. And they are willing to pay good money for it. If you are interested in selling I will leave a contact for you. Just telegram this number below. I sold about 3000 pi coins to him and he paid me immediately.
Telegram: @Pi_vendor_247
how to swap pi coins to foreign currency withdrawable.DOT TECH
As of my last update, Pi is still in the testing phase and is not tradable on any exchanges.
However, Pi Network has announced plans to launch its Testnet and Mainnet in the future, which may include listing Pi on exchanges.
The current method for selling pi coins involves exchanging them with a pi vendor who purchases pi coins for investment reasons.
If you want to sell your pi coins, reach out to a pi vendor and sell them to anyone looking to sell pi coins from any country around the globe.
Below is the contact information for my personal pi vendor.
Telegram: @Pi_vendor_247
Currently pi network is not tradable on binance or any other exchange because we are still in the enclosed mainnet.
Right now the only way to sell pi coins is by trading with a verified merchant.
What is a pi merchant?
A pi merchant is someone verified by pi network team and allowed to barter pi coins for goods and services.
Since pi network is not doing any pre-sale The only way exchanges like binance/huobi or crypto whales can get pi is by buying from miners. And a merchant stands in between the exchanges and the miners.
I will leave the telegram contact of my personal pi merchant. I and my friends has traded more than 6000pi coins successfully
Tele-gram
@Pi_vendor_247
Turin Startup Ecosystem 2024 - Ricerca sulle Startup e il Sistema dell'Innov...Quotidiano Piemontese
Turin Startup Ecosystem 2024
Una ricerca de il Club degli Investitori, in collaborazione con ToTeM Torino Tech Map e con il supporto della ESCP Business School e di Growth Capital
Turin Startup Ecosystem 2024 - Ricerca sulle Startup e il Sistema dell'Innov...
Flagstar Bancorp Q42008 earnings report
1. Flagstar Bancorp
Troy, Michigan
Q4 2008 Results
Presenter:
Thomas J. Hammond
Chairman of the Board
January 30, 2009
2. Legal Disclaimer
The information contained in this presentation is not intended as a solicitation to buy Flagstar Bancorp, Inc. stock and is provided for
general information.
This presentation may include forward-looking statements and include comments with respect to our objectives and strategies, and the
results of our operations and our business. Forward-looking statements can be identified by the fact that they do not relate strictly to
historical or current facts. They often include words such as “expects,” “assumes”, “anticipates,” “intends,” “plans,” “believes,”
“seeks,” “estimates,” or words of similar meaning, or future or conditional verbs such as “assuming”, “will,” “would,” “should,” “could”
or “may.”
Forward-looking statements provide our expectations or predictions of future conditions, events or results. They are not guarantees of
future performance. By their nature, these forward-looking statements involve numerous assumptions, uncertainties and
opportunities, both general and specific. These statements speak only as of the date they are made. We do not undertake to update
forward-looking statements to reflect the impact of circumstances or events that arise after the date the forward-looking statements
were made. There a number of factors, many of which are beyond our control that could cause actual conditions, events or results to
differ significantly from those described in the forward looking statements. Some of these are:
- Volatile interest rates that impact, amongst other things, (i) the mortgage banking business, (ii) our ability to originate loans and sell
assets at a profit, (iii) prepayment speeds and (iv) our cost of funds, could adversely affect earnings, growth opportunities and our
ability to pay dividends to shareholders.
- Our ability to raise additional capital, either through the TARP Capital Purchase program or through private sources.
- Competitive factors for loans could negatively impact gain on loan sale margins.
- Competition from banking and non-banking companies for deposits and loans can affect our growth opportunities, earnings, gain on
sale margins and our ability to open new branches, as well as our market share and our ability to diversify our commercial and
residential loan portfolio.
- Changes in the regulation of financial services companies and government-sponsored housing enterprises, and in particular, declines
in the liquidity of the mortgage loan secondary market, could adversely affect business.
- Changes in regulatory capital requirements or an inability to achieve desired capital ratios could adversely affect our growth and
earnings opportunities and our ability to originate certain types of loans, as well as our ability to sell certain types of assets for fair
market value.
- General business and economic conditions, including unemployment rates, movements in interest rates, the slope of the yield curve,
any increase in mortgage fraud and other criminal activity and the potential decline of housing prices in certain geographic markets,
may significantly affect the company’s business activities, loan losses, reserves and earnings.
- Factors concerning the implementation of proposed enhancements could result in slower implementation times than we anticipate and
negate any competitive advantage that we may enjoy.
When relying on forward-looking statements to make decisions, investors should carefully consider the aforementioned factors as well
as other uncertainties and events.
January 30, 2009 2
3. Q4 Credit Related Charges
For the quarter ending Dec 31, 2008
($ in millions)
Item Q4 Charge
Loan loss provision $176.3
Loss on net loan administration income $46.2
Other than temporary impairment (OTTI) on AFS securities $43.7
REO disposition $16.4
Reserve increase for reinsurance $9.8
Total $292.4
January 30, 2009 3
** Totals may not foot due to rounding
4. Q4 Income Statement
Q4 2008 Q3 2008 Q4 2007
(Dollars in millions, except for per share data)
Net interest income $ 46.5 $ 59.8 $ 54.1
Provision for loan losses 176.3 (89.6) (38.4)
Net interest income (loss) after provision (129.8) (29.8) 15.7
Non-interest income (57.5) 53.4 18.5
Non-interest expense (120.8) (119.2) (80.6)
Loss before federal income tax (308.1) (95.6) (46.4)
Benefit for federal income taxes (107.8) (33.5) (16.4)
Net Loss $ (200.3) $ (62.1) $ (30.1)
Diluted loss per share $ (2.40) $ (0.79) $ (0.50)
January 30, 2009 4
** Totals may not foot due to rounding
5. Q4 Non-Interest Income
Q4 2008 Q3 2008 Q4 2007
(Dollars in millions)
Loan administration $ (46.2) $ 25.7 $ 2.6
Gain (loss) on MSR sales, net 1.4 0.9 (0.3)
Gain (loss) on loan sales and securitizations 16.7 22.2 26.3
Other income (29.4) 4.6 (10.2)
Total non-interest income $ (57.5) $ 53.4 $ 18.5
Loans sold $ 5,711 $ 6,810 $ 5,955
Sales spread 0.29% 0.33% 0.37%
M emo :
Other inco me includes net lo an fees and charges, depo sit fees and charges, inco me fro m subsidiaries and impairment to
residual charges and A FS securities
January 30, 2009 5
** Totals may not foot due to rounding
6. Loan Production – Historical Trend
($ In millions)
$35,000
$30,000
$25,000
$20,000
$15,000
$10,000
$5,000
$0
1st Qtr 2nd Qtr 3rd Qtr 4th Qtr Full Year
2006 2007 2008
January 30, 2009 6
** Totals may not foot due to rounding
7. Loan Production
Q4 2008 Q3 2008 Change Q4 2007 Change
(Dollars in millions)
Residential mortgage loans $ 5,390 $ 6,681 $ (1,291) $ 6,493 $ (1,103)
Consumer loans 4 11 (7) 42 (38)
Commercial (Real Estate and Other) 11 23 (12) 155 (144)
Total $ 5,405 $ 6,715 $ (1,310) $ 6,690 $ (1,285)
January 30, 2009 7
** Totals may not foot due to rounding
8. Historical Residential Loan Underwriting Volume
7,000
6,000
2004
5,000
illions)
2005
(values in m
2006
4,000
2007
3,000
2008
2,000
1,000
t
l
ar r ct
ay ov
b g ec
n n
Ju ep
Ap Au
Ja Ju
Fe M O N
M D
S
2004 2005 2006 2007 2008
January 3,891 2,469 2,005 2,498 4,956
February 4,515 3,450 2,031 2,774 5,436
March 6,430 3,289 2,661 4,023 5,169
April 4,301 3,104 2,243 3,615 4,623
May 2,805 3,492 2,469 3,736 4,347
June 2,792 4,153 2,204 3,471 3,850
July 3,133 3,536 1,979 3,325 4,008
August 3,582 3,645 2,585 4,447 3,366
September 3,690 3,356 2,243 3,698 4,108
October 4,055 2,604 2,546 4,026 3,015
Nov ember 3,821 2,107 2,529 4,068 2,426
December 3,224 1,896 2,541 4,181 5,176
Tota l: 46,240 37,101 28,036 43,862 50,479
January 30, 2009 8
** Totals may not foot due to rounding
9. Historical Residential Loan Lock Volume
6,500
6,000
5,500
2004
5,000
illions)
2005
4,500
(values in m
2006
4,000
2007
3,500
3,000
2008
2,500
2,000
1,500
t
l
ar r ct
ay ov
b g ec
n n
Ju ep
Ap Au
Ja Ju
Fe M O N
M D
S
2004 2005 2006 2007 2008
January 4,537 2,950 1,999 2,458 4,908
February 4,294 3,447 1,878 2,666 3,766
March 2,938 3,042 2,594 3,444 5,004
April 3,625 3,200 2,017 3,164 3,662
May 2,685 3,380 2,293 3,164 3,590
June 2,862 4,351 2,181 3,306 2,914
July 3,069 3,051 2,044 2,831 3,257
August 3,552 3,578 2,502 3,707 2,550
September 3,829 3,073 2,194 2,905 3,812
October 3,917 2,395 2,374 3,339 1,987
Nov ember 3,762 1,973 2,526 3,361 3,324
December 3,023 1,673 2,249 3,332 6,305
Tota l: 42,092 36,114 26,851 37,678 45,079
January 30, 2009 9
** Totals may not foot due to rounding
10. Historical Residential Loan Closing Volume
4,500
4,000
2004
3,500
illions)
2005
3,000
(values in m
2006
2,500
2007
2008
2,000
1,500
1,000
t
l
ar r ct
ay ov
b g ec
n n
Ju ep
Ap Au
Ja Ju
Fe M O N
M D
S
2004 2005 2006 2007 2008
January 1,920 2,120 1,235 1,783 2,347
February 2,950 2,032 1,338 1,621 2,616
March 3,981 2,660 1,701 2,079 2,857
April 4,029 1,999 1,558 2,377 2,850
May 2,653 2,180 1,644 2,461 2,725
June 2,099 2,610 1,643 2,361 2,458
July 1,921 2,681 1,372 2,155 2,358
August 2,325 2,901 1,598 2,312 2,250
September 2,373 2,574 1,556 2,127 2,043
October 2,608 2,293 1,660 2,194 2,263
Nov ember 2,866 1,734 1,556 2,025 1,392
December 2,872 1,408 1,792 2,252 1,850
Tota l: 32,596 27,190 18,652 25,747 28,009
January 30, 2009 10
** Totals may not foot due to rounding
11. Deposits
As of Dec 31, 2008 As of Sep 30, 2008 As of Dec 31, 2007
(Dollars in millions)
Weighted Weighted Weighted
Balance Average Rate Balance Average Rate Balance Average Rate
Demand deposits $ 417 0.47% $ 419 0.63% $ 436 1.60%
Savings deposits 408 2.24% 410 2.50% 238 2.90%
Money market deposits 562 2.61% 521 2.68% 532 3.86%
Certificates of deposit 3.93% 4.03% 4.99%
3,968 3,531 3,871
Total retail deposits $ 5,354 3.40% $ 4,881 3.48% $ 5,076 4.48%
Custodial Deposits 535 - 469 - 473 -
Municipal deposits 598 2.84% 1,101 3.12% 1,545 5.04%
Wholesale deposits 1,354 4.41% 970 4.59% 1,142 4.64%
Total deposits $ 7,841 3.30% $ 7,421 3.35% $ 8,237 4.35%
Number of banking branches 175 173 164
January 30, 2009 11
** Totals may not foot due to rounding
12. Selected Balance Sheet Items
As of
Dec 31, 2008 Sep 30, 2008 Dec 31, 2007
(Dollars in millions, except for per share data)
Total assets $ 14,209.7 $ 14,159.4 $ 15,792.7
First mortgage loans 5,959 6,134 5,824
Second mortgage loans 287 292 57
Commercial real estate loans 1,779 1,737 1,542
Consumer loans 543 537 282
Other investment loans 514 435 429
Investment loan portfolio $ 9,082 $ 9,135 $ 8,134
Loans held for sale $ 1,484.7 $ 1,961.4 $ 3,511.3
Investment securities avail. for sale 1,118 1,041 1,309
Mortgage servicing rights 511 732 414
Stockholders' equity 478 676 693
Mortgage loans serviced for others $ 55,870 $ 51,831 $ 32,487
January 30, 2009 12
** Totals may not foot due to rounding
13. Residential First Mortgage – By State
Residential First Mortgages *
As of Dec 31, 2008
($ in thousands)
AFS HFI
State % of First Power % of
ARM Fixed Total ARM Fixed Balloon Total
Total HELOC Option ARM Total
$ 9,230 $ 298,281 $ 307,511 $ 1,156,680 $ 518,911 $ 1,827 $ 483 $ 21,590 $ 1,699,491
CA 20.7% 28.7%
165 77,119 77,283 636,747 165,150 2,607 2,212 23,123 829,839
FL 5.2% 14.0%
1,760 98,892 100,652 465,159 65,744 8,950 1,039 4,635 545,528
MI 6.8% 9.2%
1,901 72,251 74,151 223,909 80,764 525 - 6,429 311,627
WA 5.0% 5.3%
282 56,869 57,151 178,512 70,414 1,685 7 2,698 253,316
AZ 3.8% 4.3%
1,108 74,955 76,062 105,077 74,400 584 - 3,564 183,625
TX 5.1% 3.1%
751 43,911 44,662 159,555 37,865 3,366 328 1,278 202,391
CO 3.0% 3.4%
1,765 46,788 48,553 98,669 38,230 371 - 483 137,753
MD 3.3% 2.3%
674 43,707 44,381 98,733 27,032 165 - 2,774 128,705
VA 3.0% 2.2%
- 23,722 23,722 113,686 26,814 2,631 - 1,791 144,922
NV 1.6% 2.5%
541 43,603 44,144 63,069 53,721 514 - 1,100 118,404
NY 3.0% 2.0%
390 33,236 33,627 64,105 26,269 32,081 - 533 122,988
GA 2.3% 2.1%
486 42,635 43,121 83,175 22,640 540 - 1,097 107,451
IL 2.9% 1.8%
304 31,114 31,418 73,500 41,081 455 517 2,069 117,621
NJ 2.1% 2.0%
- 31,342 31,342 82,727 16,171 713 123 78 99,812
OH 2.1% 1.7%
6,644 440,171 446,814 614,274 251,165 31,923 1,963 11,637 910,962
OTHER 30.1% 15.4%
Total : $ 26,001 $ 1,458,593 $ 1,484,593 100% $ 4,217,578 $ 1,516,370 $ 88,936 $ 6,672 $ 84,878 $ 5,914,433 100%
* Excludes net prem/disc, FAS 91, negative escrow and participation loans
January 30, 2009 13
** Totals may not foot due to rounding
14. Residential First Mortgage – By LTV
Residential First Mortgages *
As of Dec 31, 2008
($ in thousands)
AFS HFI
Power
LTV % of First
ARM Fixed Total ARM Fixed Balloon Option Total % of Total
Total HELOC
ARM
$ 6,500 $ 175,463 $ 181,963 $ 1,448,013 $ 587,879 $ 10,790 $ 2,888 $ 2,260 $ 2,051,830
< 70% 12.3% 34.7%
7,088 158,854 165,942 1,808,590 683,863 10,774 2,464 2,896 2,508,586
70% - 79.99% 11.2% 42.4%
2,842 204,700 207,543 752,314 154,182 51,017 1,320 79,722 1,038,556
80% - 90% 14.0% 17.6%
9,570 919,576 929,146 208,661 90,446 16,355 - - 315,462
> 90% 62.6% 5.3%
Total : $ 26,001 $ 1,458,593 $1,484,593 100% $ 4,217,578 $ 1,516,370 $ 88,936 $ 6,672 $ 84,878 $ 5,914,433 100%
* Excludes net prem/disc, FAS 91, negative escrow and participation loans
January 30, 2009 14
** Totals may not foot due to rounding
15. Residential First Mortgage – By FICO
Residential First Mortgages *
As of Dec 31, 2008
($ in thousands)
AFS HFI
Power
FICO First
ARM Fixed Total % of Total ARM Fixed Balloon Total % of Total
Option
HELOC
ARM
$ - $ 89,800 $ 89,800 $ 28,198 $ 10,480 $ - $ 6,672 $ - $ 45,351
No score 6.0% 0.8%
406 15,684 16,090 41,101 26,442 - - - 67,543
< 580 1.1% 1.1%
1,864 164,749 166,613 52,962 31,908 - - - 84,870
580 - 619 11.2% 1.4%
6,411 267,659 274,071 238,423 90,681 1,998 - 150 331,252
620 - 659 18.5% 5.6%
5,442 286,394 291,836 1,126,594 382,910 20,428 - 1,840 1,531,772
660 - 699 19.7% 25.9%
11,877 634,307 646,184 2,730,299 973,947 66,510 - 82,889 3,853,645
> 700 43.5% 65.2%
Total : $ 26,001 $ 1,458,593 $1,484,593 100% $ 4,217,578 $ 1,516,370 $ 88,936 $ 6,672 $ 84,878 $ 5,914,433 100%
* Excludes net prem/disc, FAS 91, negative escrow and participation loans
January 30, 2009 15
** Totals may not foot due to rounding
16. Residential First Mortgage – By Vintage
Residential First Mortgages *
As of Dec 31, 2008
($ in thousands)
AFS HFI
Vintage % of First Power % of
ARM Fixed Total ARM Fixed Balloon Total
Total HELOC Option ARM Total
$ - $ - $ - $ 66,043 $ 27,289 $ 516 $ - $ - $ 93,847
2000 and older 0.0% 1.6%
- - - 11,401 11,130 115 - - 22,646
2001 0.0% 0.4%
- - - 37,454 17,340 80 - 585 55,459
2002 0.0% 0.9%
- - - 485,810 58,913 11,047 - 3,032 558,801
2003 0.0% 9.4%
- - - 1,114,644 53,165 2,269 3,992 1,499 1,175,570
2004 0.0% 19.9%
- - - 1,151,405 39,456 2,519 1,780 13,296 1,208,457
2005 0.0% 20.4%
- 138 138 351,378 282,490 40,813 383 39,179 714,242
2006 0.0% 12.1%
236 - 236 950,030 995,360 30,007 517 27,288 2,003,202
2007 0.0% 33.9%
25,765 1,458,454 1,484,219 49,413 31,226 1,570 - - 82,209
2008 100.0% 1.4%
Total : $ 26,001 $ 1,458,593 $ 1,484,593 100% $ 4,217,578 $ 1,516,370 $ 88,936 $ 6,672 $ 84,878 $ 5,914,433 100%
* Excludes net prem/disc, FAS 91, negative escrow and participation loans
January 30, 2009 16
** Totals may not foot due to rounding
17. Non Agency Investment Securities Available for Sale Portfolio
As of Dec 31, 2008
($ in 000’s)
Ratings
Balances
Initial Current
Current OTTI OCI/Mark-to- Net Book
Principal1
Security CUSIP Impairment Market Value M SP F M SP F
CWHl 2006-J8 23245LAD2 $38,627,178 ($19,000,525) $- $19,626,653 NR AAA AAA NR B CC
CWALT 2007-1T1 23246KAA9 41,796,612 (24,691,469) - 17,105,143 Aaa AAA AAA Baa2 B CC
CWHL 2007-J1 12669MAA6 85,217,290 (16,309,146) 68,908,144 NR AAA AAA NR BB A *-
GSR 2006 7F 36298NAD6 42,729,099 (14,370,592) 28,358,508 Aaa NR AAA Ba2 NR AAA
CWALT 2006-45T1 02149JAU0 38,120,371 (18,678,505) 19,441,866 Aaa AAA AAA Aaa AAA BB
JPMMT 2006 S4 46629SAG7 79,159,559 (24,731,704) 54,427,855 Aaa AAA AAA Baa2 A AAA
CWHL 2007-3 12543RAA7 44,425,620 (23,052,278) 21,373,342 NR AAA AAA NR BBB AAA
GSR 2006 9F 3622X7AD8 41,825,592 (11,285,671) 30,539,922 Aaa NR AAA A1 NR AAA
CWHL 2005-23 126694GU6 42,543,896 (7,664,207) 34,879,689 NR AAA AAA NR AAA AAA
CWHL 2006-18 12543WAA6 40,460,968 (11,046,266) 29,414,701 NR AAA AAA NR AAA AAA
CWHL 2006-1 126694XC7 35,645,381 (11,665,355) 23,980,027 NR AAA AAA NR AAA AAA
$530,551,567 ($43,691,994) ($138,803,723) $348,055,849
Subtotal
GMS Trust 2006-1 33848FAA1 $230,004,951 ($14,978,249) $215,026,702 Aaa AAA NR Baa1 AAA NR
$230,004,951 $- ($14,978,249) $215,026,702
Subtotal
$760,556,518 ($43,691,994) ($153,781,972) $563,082,552
Total
January 30, 2009 17
** Totals may not foot due to rounding
18. Real Estate Owned Portfolio
As of Dec 31, 2008
($ in 000’s)
Manufactured Single Family
Commercial % Construction % % % Total %
Homes Homes
$2,235 $ 285.76 $ 51.00 $6,191 $8,763
Current month 10.9% 9.7% 6.2% 7.3% 8.0%
30 days - - 353 - - - 12,136 14.3% 12,489 11.4%
60 days 399 2.0% 1,114 37.6% 67 8.2% 11,930 14.0% 13,510 12.4%
90 days 197 - 214 7.2% - - 8,295 9.8% 8,706 8.0%
91 - 180 days 3,974 19.4% 399 13.5% 329 40.2% 18,582 21.9% 23,284 21.3%
181 - 365 days 8,124 39.7% 465 15.7% 66 8.1% 16,765 19.7% 25,420 23.3%
1 - 2 years 2,710 - - - 128 15.6% 9,820 11.6% 12,658 11.6%
2 - 3 years 1,333 6.5% 93 3.1% 67 8.2% 816 1.0% 2,309 2.1%
3 - 4 years 1,471 7.2% 38 1.3% - - 383 0.5% 1,893 1.7%
4 - 5 years - - - - - - 95 0.1% 95 0.1%
Over 5 years - - - - 110 13.4% - - 110 0.1%
In Process - - - - - - - - 60 0.1%
Total: $20,444 85.8% $2,961 88.1% $818 100.0% $85,014 100.0% $109,297 100.0%
January 30, 2009 18
** Totals may not foot due to rounding
19. Asset Quality
As of / For the Quarter Ending
Dec 31, 2008 Sep 30, 2008 Dec 31, 2007
Delinquency rate (90+ days)1 6.93% 4.53% 2.42%
Non-performing assets 2 to total assets 5.33% 3.87% 1.90%
Net charge-off ratio3 1.08% 0.83% 0.58%
Net charge-offs (in millions) $ 24.3 $ 19.6 $ 12.2
Non-performing loans (in millions) $ 629.5 $ 413.7 $ 197.1
Allowance to non-performing loans 59.7% 54.1% 52.8%
Allowance to loans held for investment 4.14% 2.45% 1.28%
Allowance for loan losses (in millions) $ 376.0 $ 224.0 $ 104.0
Calculated using the OTS Method
1
Includes non-performing loans, real estate ow ned and repurchased assets
2
Ratio of charge-offs to average investment loans
3
January 30, 2009 19
** Totals may not foot due to rounding
20. Asset Quality by Loan Type - HFI
(unaudited)
($ in 000's) As of Dec 31, 2008
Non Annualized Q4 Total
Total General
% of Overall Total
Performing
Balance % of Balance '08 Charge Off Specific
2
Delinquencies Reserves
Reserves
1
Ratio Reserves
Loans
Mortgage $5,958,748 $432,652 7.26% 68.73% 0.73% $142,027 $14,776 $156,802
Second Mortgage 287,350 10,148 3.53% 1.61% 4.39% 16,674 - 16,674
HELOC 408,366 13,148 3.22% 2.09% 2.04% 12,500 742 13,242
Commercial Real Estate 1,779,363 164,496 9.24% 26.13% 0.87% 74,143 99,061 173,204
Commercial 24,668 1,744 7.07% 0.28% 0.13% 289 746 1,036
Construction 54,749 5,674 10.36% 0.90% 2.66% 1,735 1,617 3,352
Warehouse 434,140 - - - 0.29% 3,432 - 3,432
Other Consumer 134,737 1,595 1.18% 0.25% 1.01% 1,804 75 1,879
Total : $9,082,121 $629,457 6.93% 100.00% 1.03% $252,603 $117,017 $369,620
1. 90 day + matured, calculated using OTS method.
2. General reserves do not include $5.5 million in unallocated reserve and $146 thousand of reserve allocated to deposits
January 30, 2009 20
** Totals may not foot due to rounding
21. Historical Delinquency Trends - HFI
7.00%
6.00%
5.00%
4.00%
3.00%
2.00%
1.00%
0.00%
08
07
8
08
08
-0
n-
c-
p-
c-
ar
Ju
De
Se
De
M
30 day delinquency rate - LHI 60 day delinquency rate - LHI 90+ day delinquency - LHI
12/31/07 03/31/08 06/30/08 09/30/08 12/31/08
0.74% 0.95% 1.05% 1.17% 1.74%
30 day delinquency rate - LHI *
0.87% 0.57% 0.77% 1.21% 1.48%
60 day delinquency rate - LHI *
2.42% 2.96% 3.66% 4.53% 6.93%
90+ day delinquency rate - LHI *
* Calculated using OTS method
January 30, 2009 21
** Totals may not foot due to rounding
22. Commercial Real Estate (CRE) Loan Portfolio
As of Dec 31, 2008 *
($ in 000’s)
Percentage of Total ($) OTS 90 Days (%) Specific General
Property Type Balance Loans 30 Days 60 Days 90 Days Delinquent Delinquent Reserve Reserve
Office $408,486 22.96% $8,376 2,397 $13,772 $24,545 3.37% $9,542 $17,000
Retail 305,766 17.18% 2,491 8,343 9,465 20,300 3.10% 9,571 12,725
Shopping Center 323,743 18.19% 2,764 3,088 7,811 13,663 2.41% 4,344 13,473
Residential Development 222,285 12.49% - 86 125,266 125,352 56.35% 64,278 9,251
Other 163,110 9.17% 2,753 - - 2,753 - 2,147 6,788
Non-residential Development 32,858 1.85% - 8,443 1,844 10,287 5.61% 533 1,264
Industrial 135,868 7.64% - 14,994 - 14,994 - 2,995 5,654
Multi-Family 116,514 6.55% 135 153 2,823 3,111 2.42% 2,413 4,849
Warehouse 59,777 3.36% - - - - - 1,193 2,488
Single Family 11,474 0.64% - 65 466 532 4.07% 723 477
Land 4,200 0.24% - - 3,048 3,048 72.58% 1,322 175
CIP, Premium, FAS 91 (4,717) -0.27% N/A N/A N/A N/A N/A NA NA
Totals $1,779,363 100.00% $16,519 $37,569 $164,496 $218,585 9.24% $99,061 $74,143
* 90 day + matured, calculated using OTS method
Auto Related Loans Amount % of portfolio
Direct (borrower in auto industry) $8,973 1%
60,979
Indirect (borrower's tenant(s) in auto industry) 3%
$69,952 4%
January 30, 2009 22
** Totals may not foot due to rounding
23. 1
2008 / 2009 Outlook
2009 Outlook
As of Oct 30, 2008 As of Jan 30, 2009
New branches 3 3
Target asset size 1 $15.5 - $17.6 billion $17.0 - $18.5 billion
1
$32 – $42 billion $36 – $44 billion
Residential mortgage loan originations
Loan sales 1 $29 – $39 billion $36 – $44 billion
Gain on loan sale margin 64 – 74 bps 64 – 74 bps
Net interest margin (bank) 195 – 205 bps 240 – 270 bps
Retail deposit growth 2% – 6% 5% – 10%
Net loan administration income $65 - $75 million $60 - $80 million
Loan charge off's $90 - $110 million $90 - $150 million
Allowance as a % of loans held for investment 245 - 300 bps 400 - 500 bps
1. Assumes participation by Flagstar in the TARP Capital Purchase Program combined with an infusion of private
capital
January 30, 2009 23
25. Historical Asset Quality
• Continue to actively manage allowance in relation to asset quality
8.00%
7.00%
6.00%
5.00%
4.00%
3.00%
2.00%
1.00%
0.00%
Se 2
Se 3
Se 0 4
Se 0 5
Se 6
Se 7
Se 8
01
Ju 2
De 2
M2
Ju 3
De 3
M3
Ju 4
De 4
M4
Ju 5
De 5
M5
Ju 6
De 6
M6
Ju 7
De 7
M7
Ju 8
De 8
08
0
0
0
0
0
0
0
0
0
0
0
0
0
0
0
0
0
0
-0
-0
-0
-0
-0
-0
-0
n-
n-
n-
n-
n-
n-
n-
c-
c-
c-
c-
p-
p-
c-
p-
c-
p-
p-
c-
p-
c-
p-
ar
ar
ar
ar
ar
ar
ar
De
M
ALL to LHI 90 + Delinquency rate - LHI * Net Charge off Ratio NPA to Total Assets
* Calculated using OTS method
January 30, 2009 25
** Totals may not foot due to rounding
26. Delinquent Loans by Loan Type - HFI
(unaudited) As of Dec 31, 2008
($ in 000's) 30 Day 60 Day 90 Day + Matured
Delinquent Delinquent Delinquent
% of % of % of
(1) (1) (1)
Balance Loans Balance Loans Balance Loans Balance
Mortgage $5,958,748 $127,460 2.14% $85,357 1.43% $432,652 7.26%
Second Mortgage 287,350 4,696 1.63% 4,233 1.47% 10,148 3.53%
HELOC 408,366 3,492 0.86% 4,038 0.99% 13,148 3.22%
Commercial Real Estate 1,779,363 16,519 0.93% 37,569 2.11% 164,496 9.24%
Commercial 24,668 - 0.00% 88 0.36% 1,744 7.07%
Construction 54,749 4,316 7.88% 2,285 4.17% 5,674 10.36%
Warehouse 434,140 - 0.00% - 0.00% - 0.00%
Other Consumer 134,737 1,200 0.89% 1,115 0.83% 1,595 1.18%
Total : $9,082,121 $157,683 1.74% $134,685 1.48% $629,457 6.93%
1. Calculated using OTS method
January 30, 2009 26
** Totals may not foot due to rounding
27. HFI Residential 1st Mortgage Non Performing Loans – by
FICO and by LTV
HFI Residential First Mortgage Non Performing Loans*
As of Dec 31, 2008
($ in thousands)
LTV
FICO < 70% 70% - 79.99% 80% - 90% > 90% Total
No Score $243 $855 $2,635 $1,681 $5,414
< 580 964 1,847 3,188 8,928 $14,926
580 - 619 892 1,927 4,281 9,732 $16,831
620 - 659 4,140 5,635 4,415 11,568 $25,759
660 - 699 24,916 72,495 31,614 7,244 $136,270
> 700 37,007 92,381 88,219 15,846 $233,453
Total $68,163 $175,139 $134,352 $54,999 $432,652
* 90 day + matured, calculated using OTS method
January 30, 2009 27
** Totals may not foot due to rounding
28. Non Performing Loans – by State - HFI
Non Performing Loans*
As of Dec 31, 2008
($ in thousands)
Percent of Second Commercial Percent of
State Mortgage HELOC Commercial Construction Consumer Total
Mortgage Mortgage Real Estate Total
FL $141,983 33% $1,525 $2,384 $6,625 $ - $0 $239 $152,757 24%
MI 26,184 6% 886 2,413 109,612 782 446 1,116 141,440 22%
CA 80,586 19% 2,655 3,162 8,466 - 448 - 95,317 15%
AZ 20,789 5% 433 973 5,086 - - - 27,280 4%
CO 15,672 4% 54 86 10,948 - - - 26,760 4%
GA 18,491 4% 283 189 3,946 - - 43 22,952 4%
NV 18,294 4% 1,040 299 - - 787 - 20,420 3%
OH 13,500 3% 260 146 4,604 315 - 17 18,842 3%
IL 6,150 1% - 259 9,607 - - - 16,016 3%
NY 4,848 1% 315 753 5,603 - - - 11,519 2%
WA 9,756 2% 127 607 - - - - 10,490 2%
NJ 9,226 2% - 377 - - 764 - 10,366 2%
UT 7,874 2% 285 20 - - 751 - 8,930 1%
OR 5,942 1% 221 50 - - - - 6,213 1%
TX 6,025 1% 181 - - - - - 6,206 1%
Other 47,332 11% 1,884 1,431 - 647 2,478 178 53,949 9%
Total $432,652 100% $10,148 $13,149 $164,496 $1,744 $5,673 $1,594 $629,458 100%
* 90 day + matured, calculated using OTS method
January 30, 2009 28
** Totals may not foot due to rounding
29. Non Performing Loans – by Vintage - HFI
Non Performing Loans*
As of Dec 31, 2008
($ in thousands)
Percent of Second Commercial Percent of
Vintage Mortgage HELOC Commercial Construction Consumer Total
Mortgage Mortgage Real Estate Total
Older $8,982 2% $60 $232 $417 $ - $70 $45 $9,806 2%
2001 1,918 0% 236 124 - - - 23 2,301 0%
2002 2,226 1% 85 346 686 - - 37 3,380 1%
2003 13,104 3% 36 1,184 4,016 394 - 6 18,740 3%
2004 46,546 11% 123 2,249 14,501 - - 53 63,472 10%
2005 111,811 26% 170 2,667 58,185 - - 692 173,525 28%
2006 87,426 20% 2,450 1,151 56,324 - 1,061 265 148,677 24%
2007 151,291 35% 6,990 4,945 29,192 1,350 4,542 361 198,671 32%
2008 9,346 2% - 250 1,176 - - 112 10,884 2%
Total $432,652 100% $10,148 $13,149 $164,496 $1,744 $5,673 $1,594 $629,458 100%
* 90 day + matured, calculated using OTS method
January 30, 2009 29
** Totals may not foot due to rounding
30. Commercial Real Estate (CRE) Loan Portfolio – by Vintage
Commercial Real Estate Portfolio*
As of Dec 31, 2008
($ in 000’s)
Non-
Shopping Residential Industrial /
Vintage Office Retail Other Residential Multi-fam ily Total
Center Developm ent Warehouse
Developm ent
1997 $160 $ - $ - $ - $2,462 $ - $ - $10 $2,633
1998 0 342 3,022 - 727 - 1,478 - $5,569
1999 3,258 337 2,755 - 9,869 745 5,897 1,342 $24,202
2000 785 3,438 1,064 - 3,149 - 4,387 222 $13,045
2001 9,766 2,099 3,189 4,376 6,304 - 3,288 440 $29,461
2002 9,906 3,047 4,734 - 7,547 - 23,333 2,570 $51,138
2003 29,055 11,669 14,902 - 16,899 - 17,449 7,317 $97,292
2004 90,568 41,410 10,634 3,664 16,609 - 16,441 6,627 $185,953
2005 49,497 37,041 27,222 62,149 32,745 2,246 22,738 13,204 $246,842
2006 79,578 75,740 119,243 60,287 48,739 14,129 39,308 14,292 $451,315
2007 99,843 57,400 92,432 89,471 25,939 15,738 44,806 49,477 $475,105
2008 36,069 73,244 44,546 2,338 7,794 - 16,520 6,559 $187,070
Total $408,486 $305,766 $323,743 $222,285 $178,784 $32,858 $195,645 $102,059 $1,769,625
* Excludes Commercial Letters of Credit, CIP, Premium and FAS 91
January 30, 2009 30
** Totals may not foot due to rounding
31. Commercial Real Estate (CRE) Loan Portfolio – by State
Commercial Real Estate Portfolio*
As of Dec 31, 2008
($ in 000’s)
Non-
Shopping Residential Industrial /
State Office Retail Other Residential Multi-fam ily Total
Center Develpom ent Warehouse
Developm ent
MI $230,965 $189,116 $118,060 $102,351 $125,656 $7,048 $117,636 $72,175 $963,007
GA 47,492 34,891 125,006 49,498 7,194 312 7,236 3,400 $275,027
CA 51,507 42,939 13,700 10,377 5,272 - 39,994 2,721 $166,511
IN 6,568 21,390 11,232 543 15,449 7,277 12,688 530 $75,676
AZ 36,771 459 11,167 - - - 552 - $48,950
IL - - 5,255 21,507 1,580 - - 12,089 $40,431
FL - 1,832 4,985 7,748 952 9,593 11,005 - $36,115
VA - 1,134 24,690 - - - - - $25,824
NY 975 - - 5,603 14,909 - - 1,731 $23,218
KY 22,863 - - - - - - - $22,863
ID 2,397 - 2,353 - - 8,443 - - $13,193
CO - - - 10,948 - - 157 - $11,105
OH 1,377 - 1,566 4,604 1,295 - - - $8,842
PA - 719 - - 3,420 - 1,850 2,603 $8,591
NC 6,515 1,432 - - - - - - $7,947
OTHER 1,056 11,855 5,729 9,107 3,057 185 4,527 6,809 $42,325
Total $408,486 $305,766 $323,743 $222,285 $178,784 $32,858 $195,645 $102,059 $1,769,625
* Excludes Commercial Letters of Credit, CIP, Premium and FAS 91
January 30, 2009 31