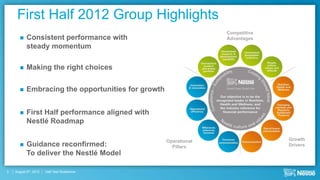
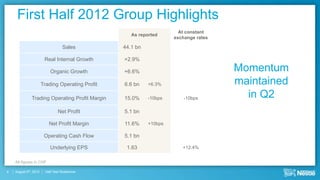
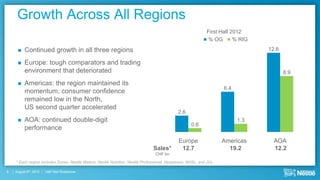
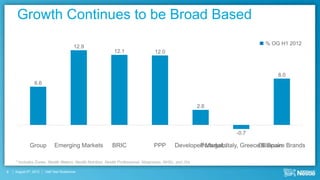
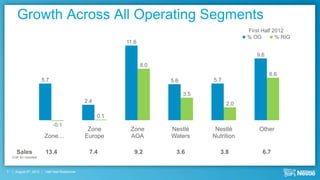
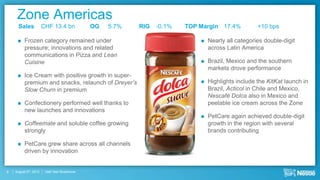
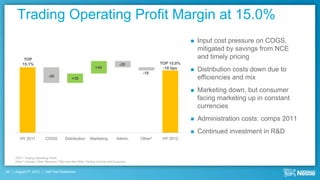
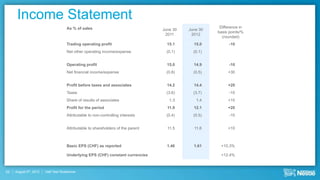
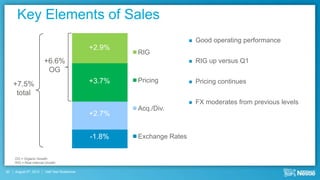
2012 First Half Results


                                               Wan Ling Martello
                                              Chief Financial Officer


August 9th, 2012   Half Year Roadshow
Disclaimer

     This presentation contains forward looking
     statements which reflect Management’s current
     views and estimates. The forward looking
     statements involve certain risks and uncertainties
     that could cause actual results to differ materially
     from those contained in the forward looking
     statements. Potential risks and uncertainties include
     such factors as general economic conditions, foreign
     exchange fluctuations, competitive product and
     pricing pressures and regulatory developments.

1   August 9th, 2012   Half Year Roadshow
Agenda

        First Half 2012 Group Highlights

        First Half 2012 Business Performance

        Cash Flow

        Concluding Remarks


2   August 9th, 2012   Half Year Roadshow
First Half 2012 Group Highlights
                                                                  Competitive
          Consistent performance with                            Advantages
           steady momentum

          Making the right choices

          Embracing the opportunities for growth


          First Half performance aligned with
           Nestlé Roadmap

                                                    Operational                 Growth
          Guidance reconfirmed:                      Pillars                   Drivers
           To deliver the Nestlé Model

3   August 9th, 2012   Half Year Roadshow
First Half 2012 Group Highlights
                                                                       At constant
                                                     As reported
                                                                     exchange rates

                                  Sales           44.1 bn

                        Real Internal Growth      +2.9%

                           Organic Growth         +6.6%                               Momentum
                       Trading Operating Profit   6.6 bn    +6.3%                     maintained
              Trading Operating Profit Margin     15.0%     -10bps       -10bps         in Q2
                               Net Profit         5.1 bn

                          Net Profit Margin       11.6%     +10bps

                        Operating Cash Flow       5.1 bn

                           Underlying EPS          1.63                 +12.4%


    All figures in CHF

4   August 9th, 2012    Half Year Roadshow
Growth Across All Regions
                                                                                                            First Half 2012
                                                                                                             % OG       % RIG

         Continued growth in all three regions                                                                                 12.6

         Europe: tough comparators and trading
          environment that deteriorated                                                                                                8.9

         Americas: the region maintained its
                                                                                                                   6.4
          momentum, consumer confidence
          remained low in the North,
          US second quarter accelerated
                                                                                             2.6
         AOA: continued double-digit                                                                                    1.3
                                                                                                    0.6
          performance
                                                                                             Europe                Americas       AOA
                                                                               Sales*         12.7                   19.2         12.2
                                                                                CHF bn

    * Each region includes Zones, Nestlé Waters, Nestlé Nutrition, Nestlé Professional, Nespresso, NHSc, and JVs

5   August 9th, 2012   Half Year Roadshow
Growth Continues to be Broad Based
                                                                                                                            % OG H1 2012
                                       12.9
                                                          12.1                  12.0


                                                                                                                                 8.0
                6.6


                                                                                                       2.6


                                                                                                                 -0.7

             Group          Emerging Markets             BRIC                   PPP        Developed MarketsItaly, GreeceBillionaire Brands
                                                                                                   Portugal,              & Spain

    * Includes Zones, Nestlé Waters, Nestlé Nutrition, Nestlé Professional, Nespresso, NHSc, and JVs

6   August 9th, 2012   Half Year Roadshow
Growth Across All Operating Segments
                                                                                               First Half 2012
                                                                                               % OG        % RIG
                                                          11.6

                                                                                                  9.6
                                                                 8.0
                                                                                                        6.6
                        5.7                                            5.6         5.7

                                                                             3.5
                                              2.4                                        2.0

                                                    0.1
                              -0.1
                                               Zone        Zone        Nestlé       Nestlé         Other
                         Zone…                Europe       AOA         Waters      Nutrition

      Sales              13.4                  7.4           9.2         3.6          3.8            6.7
    CHF bn rounded


7    August 9th, 2012    Half Year Roadshow
Zone Americas
      Sales            CHF 13.4 bn           OG   5.7%   RIG   -0.1%   TOP Margin 17.4%           +10 bps

         Frozen category remained under                                      Nearly all categories double-digit
          pressure; innovations and related                                    across Latin America
          communications in Pizza and Lean
          Cuisine                                                             Brazil, Mexico and the southern
                                                                               markets drove performance
         Ice Cream with positive growth in super-
          premium and snacks, relaunch of Dreyer’s                            Highlights include the KitKat launch in
          Slow Churn in premium                                                Brazil, Acticol in Chile and Mexico,
                                                                               Nescafé Dolca also in Mexico and
         Confectionery performed well thanks to                               peelable ice cream across the Zone
          new launches and innovations
                                                                              PetCare again achieved double-digit
         Coffeemate and soluble coffee growing                                growth in the region with several
          strongly                                                             brands contributing

         PetCare grew share across all channels
          driven by innovation


8   August 9th, 2012    Half Year Roadshow
Zone Europe
      Sales            CHF 7.4 bn            OG   2.4%   RIG   0.1%   TOP Margin   15.4%   -100 bps


         Innovation, Premium and PPPs helped drive
          growth in an environment that deteriorated

         Western Europe key highlights were France, GB
          region and Benelux

         Central and Eastern Europe had continued strong
          performance by Ukraine, Adriatic and Romania.
          Russia recovering

         PIGS remained positive

         Brand highlights included Nescafé, Herta, Kitkat,
          and many PetCare brands


9   August 9th, 2012    Half Year Roadshow
Zone Asia, Oceania & Africa
       Sales            CHF 9.2 bn            OG   11.6%   RIG   8.0%   TOP Margin 18.9%   -60 bps


          Continued double-digit growth building on a strong 2011

          Emerging markets double-digit in almost all categories
           and geographies

          China, India, Africa and the Middle East were highlights
           of the Zone

          Japan accelerated through the period driven by coffee
           and chocolate

          The PPP model continued to drive value and volume
           growth across the Zone


10   August 9th, 2012    Half Year Roadshow
Nestlé Nutrition
       Sales            CHF 3.8 bn            OG   5.7%   RIG   2.0%   TOP Margin   20.6%   -50 bps

      Infant nutrition
          Double-digit growth in emerging markets
          Good momentum across existing product range
           and acceleration from new launches such as
           Nestlé NAN AR, Lactogen Gut Comfort and
           Baby&me

      Weight management
          Remained challenged in the US affected by
           economic and competitive environment

      Performance nutrition
          Growth driven by new product launches in Europe
           and refocusing on high performance athletes


11   August 9th, 2012    Half Year Roadshow
Nestlé Waters
       Sales            CHF 3.6 bn            OG   5.6%   RIG   3.5%      TOP Margin     10.0%        +140 bps


          Good growth driven by North America and                  Nestlé Pure Life and international premium
           emerging markets                                          sparkling waters continued to do well
          Growth in Europe impacted by slow start to the           Local brand highlights include Poland Spring
           season versus 2011                                        in the US, Al Manhal in Saudi Arabia, Minéré
                                                                     in Thailand and Baraka in Egypt


12   August 9th, 2012    Half Year Roadshow
Other
       Sales            CHF 6.7 bn            OG   9.6%   RIG   6.6%   TOP Margin 17.6%   +10 bps

      Professional
          Good growth driven by beverage and
           culinary solutions
          Nescafé Milano continues to build on a
           successful launch

      Nespresso
          Double-digit growth
          Environment remains competitive

      Nestlé Health Science
          Continues to build on core platforms for
           future growth


13   August 9th, 2012    Half Year Roadshow
Product Segments
                                                                                                  First Half 2012
                                                                                                  % OG         % RIG
                        10.8

                                                                                                8.2
                                                6.7                               6.4
                               5.8
                                                                                                      4.8
                                                                                        4.0

                                                                 1.5
                                                      0.8


                                                                       -0.9

              Powdered &                      Milk Products   Prepared Dishes   Confectionery   PetCare
           Liquid Beverages                   & Ice Cream     & Cooking Aids
     Sales        9.6                              9.1              6.9              4.6          5.2
 CHF bn rounded

TOP Margin               23.7%                   14.4%            13.3%            14.0%        20.7%
                        -60 bps                 +30 bps           -10 bps         -210 bps      +70 bps
14   August 9th, 2012    Half Year Roadshow
Product Segment Review


15   August 9th, 2012   Half Year Roadshow
Product Segment Review


16   August 9th, 2012   Half Year Roadshow
Product Segment Review


17   August 9th, 2012   Half Year Roadshow
Product Segment Review


18   August 9th, 2012   Half Year Roadshow
Product Segment Review


19   August 9th, 2012   Half Year Roadshow
Trading Operating Profit Margin at 15.0%
                                                                                                            Input cost pressure on COGS,
                                                                                                             mitigated by savings from NCE
           TOP                                                                                               and timely pricing
          15.1%                                                             -20              TOP 15.0%
                                                            +40                               -10 bps
                                                                                     -10
                                                                                                            Distribution costs down due to
                           -50
                                           +30                                                               efficiencies and mix
                                                                                                            Marketing down, but consumer
                                                                                                             facing marketing up in constant
                                                                                                             currencies
                                                                                                            Administration costs: comps 2011
                                                                                                            Continued investment in R&D
        HY 2011          COGS          Distribution     Marketing         Admin.    Other*    HY 2012


     TOP = Trading Operating Profit;
     Other* includes Other Revenue, R&D and Net Other Trading Income and Expenses


20   August 9th, 2012    Half Year Roadshow
Advertising Effectiveness
              Consumer Facing Marketing spend up 1.3%
                      in constant currencies

                                       Upper quartile scores


                                                                               63
                                                                      51
                                             40
                   30


                2009                       2010                      2011   YTD 2012


Base: All Nestle Aired ads
Numbers shown are percentages of ads that fall into each category,
Note: Quartiles are based on all ads on database.


21     August 9th, 2012      Half Year Roadshow
Income Statement
                                    As % of sales                                                     Difference in
                                                                                 June 30   June 30
                                                                                                     basis points/%
                                                                                  2011      2012
                                                                                                       (rounded)
                                    Trading operating profit                       15.1      15.0          -10
                                    Net other operating income/expense             (0.1)     (0.1)


                                    Operating profit                               15.0      14.9          -10
                                    Net financial income/expense                   (0.8)     (0.5)        +30


                                    Profit before taxes and associates             14.2      14.4         +20
                                    Taxes                                          (3.6)     (3.7)         -10
                                    Share of results of associates                  1.3       1.4         +10
                                    Profit for the period                          11.9      12.1         +20
                                    Attributable to non-controlling interests      (0.4)     (0.5)         -10


                                    Attributable to shareholders of the parent     11.5      11.6         +10


                                    Basic EPS (CHF) as reported                    1.46      1.61     +10.3%

                                    Underlying EPS (CHF) constant currencies                          +12.4%


22   August 9th, 2012   Half Year Roadshow
Cash Flow – a Key Priority
         Driving performance
            –   Targeting key drivers of operating cash flow:

                    –   Operating margin & working capital management
                    –   Treasury & tax

         Improving external visibility of our performance
            – Transparency
            – Comparability


23   August 9th, 2012   Half Year Roadshow
First Half 2012 Operating Cash Flow +CHF 3.0 bn
      All Key Drivers Contributed to Improvement
                                                                           + 3.0

                                                                                       + 0.2               + 0.4
                                                                     + 1.9                                                  5.1


                                              + 0.5


                  2.1

              Operating                        Operating              Variation    Variation of other   Treasury, Taxes   Operating
              Cash Flow                      improvement             of working        operating          and Others      Cash Flow
               2011.06                                                 capital     assets/liabilities                      2012.06
      (all figures in CHF bn, based on new cash flow presentation)

24   August 9th, 2012   Half Year Roadshow
Working Capital Long-term Trend


                           2005                  2006                    2007    2008       2009     2010   2011

                                                                                TNWC as % of sales
             Notes:
             Like for like estimate
             2010 and 2011 figures exclude Alcon, Hsu Fu Chi and Yinlu


25   August 9th, 2012   Half Year Roadshow
New Cash Flow Presentation – Increased Transparency

         Effective           30 th    June 2012:

                       Enhanced transparency and disclosure of Operating Cash Flow,
                        segregated by key drivers:
                             – Cash flow before changes in operating Assets and Liabilities
                             – Working Capital and other operating Assets and Liabilities
                             – Taxes, Treasury activities and Dividends from Associates

                       Change definitions of Operating Cash Flow and Free Cash Flow,
                        to align with common practice amongst peers:
                             – Operating Cash Flow to include Dividends from Associates (mainly L’Oréal)
                             – Free Cash Flow to exclude minority interests (dividends paid, acquisitions of
                               shares)

26   August 9th, 2012   Half Year Roadshow
Alignment Behind our Roadmap Drives Performance
                                                           Competitive
                                                           Advantages


                                             Operational                 Growth
                                               Pillars                   Drivers


27   August 9th, 2012   Half Year Roadshow
2012 First Half Results


                                                Discussion


August 9th, 2012   Half Year Roadshow
Appendix


29   August 9th, 2012   Half Year Roadshow
Key Elements of Sales
                                                                         Good operating performance
                                             +2.9%
                                                     RIG
                        +6.6%                                            RIG up versus Q1
                         OG
                                             +3.7%   Pricing             Pricing continues
     +7.5%
      total
                                                                         FX moderates from previous levels
                                                     Acq./Div.
                                             +2.7%


                                             -1.8%   Exchange Rates


     OG = Organic Growth
     RIG = Real Internal Growth

30   August 9th, 2012   Half Year Roadshow
Weighted Average Exchange Rates

                                             CHF per           1H 2011   1H 2012   (%)

                                             US Dollar (1)      0.90      0.93     +2.7

                                             Euro (1)           1.27      1.20     -5.1

                                             £ Sterling (1)     1.46      1.46     +0.1

                                             Real (100)         55.36     49.90    -9.9

                                             Mex. Peso (100)    7.62      7.01     -8.0

                                             Yen (100)          1.11      1.16     +5.2


31   August 9th, 2012   Half Year Roadshow
FX Impact on Businesses

                                             (%)                1Q 2012   HY 2012

                                             Zone EUR            -5.9      -4.4

                                             Nestlé Nutrition    -5.3      -2.6

                                             Zone AMS            -4.2      -0.8

                                             Zone AOA            -3.8      -0.6

                                             Nestlé Waters       -4.5      -0.5

                                             Other               -4.4      -2.4

                                             Total               -4.6      -1.8


32   August 9th, 2012   Half Year Roadshow
First Half Group Net Debt
      In line with Seasonal Trend
                                                                                                     0.3

                                                                                                                      -3.1
                                                                                                 Exchange
                                                                                      6.2         rates &
                                                                                                   other                         -2.2
                                                -0.6                                                              Free Cash
                                                                    0.1                                              Flow
                                                                                                                                 Alcon
                                             Treasury        Acquisition           Dividends                                   proceeds
                                              shares            net of                                                         invested
                                               (net)          disposals                                                            LT
                                                                (incl. Minority)
                                                                                                                                 (net)a)           b)

                              14.3                                                                                                          15.0

                                                                                       +0.7 bn
                                                              Group Net Debt increased by CHF 0.7 billion


                            Net debt                                                                                                       Net debt
                           1 January                                                                                                       30 June


      a)   Mainly bonds, Asian equities reclassified to Liquid assets/Net debt because they will be realised within one year
      b)   Adjusted Net Debt including LT investment of Alcon cash proceeds amounts to CHF 14.3 bn

33   August 9th, 2012   Half Year Roadshow
Cash Flow
                Illustrative examples of new presentation
                 based on FY 2010 and FY 2011 figures


34   August 9th, 2012   Half Year Roadshow
Operating Cash Flow
      Old presentation (until 2011)                                              New presentation (as from 2012)
      In millions of CHF                                      2011      2010     In millions of CHF                                       2011      2010


      Operating activities                                                       Operating activities
      Profit for the period                                  9'804     35'384    Operating profit                                       12'471     38'820
      Non-cash items of income and expense                   3'039    (20'948)   Non-cash items of income and expense                    3'335    (20'563)
      Decrease/(increase) in working capital                (1'837)     (632)    Cas h flow befor e c hanges in
                                                                                                                                       15'806     18'257
      Variation of other operating assets and liabilities   (1'243)     (196)    oper ating as s ets and liabilities

      O per ating c as h flow                               9'763     13'608
                                                                                 Decrease/(increase) in working capital                 (1'983)     (907)
                                                                                 Variation of other operating assets and liabilities     (760)       210
                                                                                 Cas h gener ated fr om oper ations                    13'063     17'560


                        Seperate disclosure of taxes and treasury                Net cash flows from treasury activities                 (745)      (946)
                        operational activities                                   Taxes paid                                             (2'555)    (3'006)

                        New component of the operating cash flow                 Dividends from associates                                417        360
                                                                                 O per ating c as h flow                               10'180     13'968


35   August 9th, 2012    Half Year Roadshow
Enhanced Transparency for FY Disclosure
         Effective           31 st    December 2012:

                       Presentation of the detail components of the Free Cash Flow

                       Reconciliation between Operating Cash Flow, Free Cash Flow and evolution of
                        the Group Net Financial Debt


36   August 9th, 2012   Half Year Roadshow
Enhanced Transparency for FY DisclosureIn millions of CHF                                                                2011      2010


                                             O per ating c as h flow                                                        10'180     13'968
                                             Capital expenditure                                                             (4'779)    (4'576)

            Detail components                Expenditure on intangible assets                                                  (247)      (408)
                                             Sale of property, plant and equipment                                              111        113
            of Free Cash Flow
                                             Investments (net of disinvestments) in associates                                  (60)      (106)
                                             Other investing cash flows                                                        (448)      (439)
                                             F r ee c as h flow                                                              4'757      8'552
                                             Acquisition of businesses                                                       (3'742)    (5'582)
                                             Financial liabilities and short-term investments acquired/transferred              (76)      (330)
                                             Disposal of businesses                                                               7     27'715
                                             Outflows from long-term financial investments                                   (1'802)    (2'528)
            “Bridge” Free Cash               Reclassification of long-term investments from non-current financial assets      1'274          0
            Flow and Net Financial           Dividends paid to shareholders of the parent                                    (5'939)    (5'443)
            Debt Evolution                   Purchase of treasury shares (net sale)                                          (4'953)   (11'857)

                                             Cash flows with non-controlling interests                                         (266)      (791)
                                             Cash inflows from hedging derivative financial instruments                         394      1'118
                                             Currency retranslations and exchange differences                                  (140)       664

                                             Other movements                                                                     21       (196)
                                             ( Inc r eas e) /Dec r eas e of Net financ ial debt                            ( 10'465)   11'322
                                             Net financial debt at beginning of year (2010: including Alcon)                 (3'854)   (15'176)

                                             Net financ ial debt at end of y ear                                           ( 14'319)   ( 3'854)


37   August 9th, 2012   Half Year Roadshow
2013
                                     Pension Accounting Changes


38   August 9th, 2012   Half Year Roadshow
Main Changes Pension Accounting (IAS 19 revised)

      Impact P&L as from 2013 onwards (2012 will be restated):
          Replacement of the Expected Return on Plan Assets (ERoA) by the Discount Rate
           (DR) used for Plan Liabilities => Calculation of a net interest cost/income

          Split of the pension costs:
                    – Service costs continue to be included in Trading Operating Profit
                    – Net interest cost/income to be presented together with the Group financing
                      costs


39   August 9th, 2012   Half Year Roadshow
Impact on Nestlé of New Pension Accounting
      (as from 2013)
      Based on 2012 estimates:
         Trading Operating Profit margin: approx. -20 to -30 bps

         Net Financing Cost increase by CHF 250 million

         Net Profit decrease of approx. CHF 360 million (30-40 bps)

         Impact on EPS of approx. 10 cents per share

                                        Just an accounting change,
                                   no change of underlying performance
                                             & cash generation
40   August 9th, 2012   Half Year Roadshow
How will Nestlé Mitigate the Impact of Pension
      Liabilities Going Forward?

         Continue to progressively transition from Defined Benefit to Hybrid Plans
          (Defined Contribution oriented)

         Continued improvement in operating performance


41   August 9th, 2012   Half Year Roadshow
Comparability with Peers


         Applies for all companies reporting in accordance with IFRS

         Comparability issue with US-based competitors, as reporting of pension costs
          has not changed under US GAAP: the use of a long-term expected return on
          plan assets (as maintained under US GAAP) usually results in lower pension
          costs recognized in the P&L


42   August 9th, 2012   Half Year Roadshow

2011.08.10 H1 2012 roadshow presentation final

  • 1.
    2012 First HalfResults Wan Ling Martello Chief Financial Officer August 9th, 2012 Half Year Roadshow
  • 2.
    Disclaimer This presentation contains forward looking statements which reflect Management’s current views and estimates. The forward looking statements involve certain risks and uncertainties that could cause actual results to differ materially from those contained in the forward looking statements. Potential risks and uncertainties include such factors as general economic conditions, foreign exchange fluctuations, competitive product and pricing pressures and regulatory developments. 1 August 9th, 2012 Half Year Roadshow
  • 3.
    Agenda  First Half 2012 Group Highlights  First Half 2012 Business Performance  Cash Flow  Concluding Remarks 2 August 9th, 2012 Half Year Roadshow
  • 4.
    First Half 2012Group Highlights Competitive  Consistent performance with Advantages steady momentum  Making the right choices  Embracing the opportunities for growth  First Half performance aligned with Nestlé Roadmap Operational Growth  Guidance reconfirmed: Pillars Drivers To deliver the Nestlé Model 3 August 9th, 2012 Half Year Roadshow
  • 5.
    First Half 2012Group Highlights At constant As reported exchange rates Sales 44.1 bn Real Internal Growth +2.9% Organic Growth +6.6% Momentum Trading Operating Profit 6.6 bn +6.3% maintained Trading Operating Profit Margin 15.0% -10bps -10bps in Q2 Net Profit 5.1 bn Net Profit Margin 11.6% +10bps Operating Cash Flow 5.1 bn Underlying EPS 1.63 +12.4% All figures in CHF 4 August 9th, 2012 Half Year Roadshow
  • 6.
    Growth Across AllRegions First Half 2012 % OG % RIG  Continued growth in all three regions 12.6  Europe: tough comparators and trading environment that deteriorated 8.9  Americas: the region maintained its 6.4 momentum, consumer confidence remained low in the North, US second quarter accelerated 2.6  AOA: continued double-digit 1.3 0.6 performance Europe Americas AOA Sales* 12.7 19.2 12.2 CHF bn * Each region includes Zones, Nestlé Waters, Nestlé Nutrition, Nestlé Professional, Nespresso, NHSc, and JVs 5 August 9th, 2012 Half Year Roadshow
  • 7.
    Growth Continues tobe Broad Based % OG H1 2012 12.9 12.1 12.0 8.0 6.6 2.6 -0.7 Group Emerging Markets BRIC PPP Developed MarketsItaly, GreeceBillionaire Brands Portugal, & Spain * Includes Zones, Nestlé Waters, Nestlé Nutrition, Nestlé Professional, Nespresso, NHSc, and JVs 6 August 9th, 2012 Half Year Roadshow
  • 8.
    Growth Across AllOperating Segments First Half 2012 % OG % RIG 11.6 9.6 8.0 6.6 5.7 5.6 5.7 3.5 2.4 2.0 0.1 -0.1 Zone Zone Nestlé Nestlé Other Zone… Europe AOA Waters Nutrition Sales 13.4 7.4 9.2 3.6 3.8 6.7 CHF bn rounded 7 August 9th, 2012 Half Year Roadshow
  • 9.
    Zone Americas Sales CHF 13.4 bn OG 5.7% RIG -0.1% TOP Margin 17.4% +10 bps  Frozen category remained under  Nearly all categories double-digit pressure; innovations and related across Latin America communications in Pizza and Lean Cuisine  Brazil, Mexico and the southern markets drove performance  Ice Cream with positive growth in super- premium and snacks, relaunch of Dreyer’s  Highlights include the KitKat launch in Slow Churn in premium Brazil, Acticol in Chile and Mexico, Nescafé Dolca also in Mexico and  Confectionery performed well thanks to peelable ice cream across the Zone new launches and innovations  PetCare again achieved double-digit  Coffeemate and soluble coffee growing growth in the region with several strongly brands contributing  PetCare grew share across all channels driven by innovation 8 August 9th, 2012 Half Year Roadshow
  • 10.
    Zone Europe Sales CHF 7.4 bn OG 2.4% RIG 0.1% TOP Margin 15.4% -100 bps  Innovation, Premium and PPPs helped drive growth in an environment that deteriorated  Western Europe key highlights were France, GB region and Benelux  Central and Eastern Europe had continued strong performance by Ukraine, Adriatic and Romania. Russia recovering  PIGS remained positive  Brand highlights included Nescafé, Herta, Kitkat, and many PetCare brands 9 August 9th, 2012 Half Year Roadshow
  • 11.
    Zone Asia, Oceania& Africa Sales CHF 9.2 bn OG 11.6% RIG 8.0% TOP Margin 18.9% -60 bps  Continued double-digit growth building on a strong 2011  Emerging markets double-digit in almost all categories and geographies  China, India, Africa and the Middle East were highlights of the Zone  Japan accelerated through the period driven by coffee and chocolate  The PPP model continued to drive value and volume growth across the Zone 10 August 9th, 2012 Half Year Roadshow
  • 12.
    Nestlé Nutrition Sales CHF 3.8 bn OG 5.7% RIG 2.0% TOP Margin 20.6% -50 bps Infant nutrition  Double-digit growth in emerging markets  Good momentum across existing product range and acceleration from new launches such as Nestlé NAN AR, Lactogen Gut Comfort and Baby&me Weight management  Remained challenged in the US affected by economic and competitive environment Performance nutrition  Growth driven by new product launches in Europe and refocusing on high performance athletes 11 August 9th, 2012 Half Year Roadshow
  • 13.
    Nestlé Waters Sales CHF 3.6 bn OG 5.6% RIG 3.5% TOP Margin 10.0% +140 bps  Good growth driven by North America and  Nestlé Pure Life and international premium emerging markets sparkling waters continued to do well  Growth in Europe impacted by slow start to the  Local brand highlights include Poland Spring season versus 2011 in the US, Al Manhal in Saudi Arabia, Minéré in Thailand and Baraka in Egypt 12 August 9th, 2012 Half Year Roadshow
  • 14.
    Other Sales CHF 6.7 bn OG 9.6% RIG 6.6% TOP Margin 17.6% +10 bps Professional  Good growth driven by beverage and culinary solutions  Nescafé Milano continues to build on a successful launch Nespresso  Double-digit growth  Environment remains competitive Nestlé Health Science  Continues to build on core platforms for future growth 13 August 9th, 2012 Half Year Roadshow
  • 15.
    Product Segments First Half 2012 % OG % RIG 10.8 8.2 6.7 6.4 5.8 4.8 4.0 1.5 0.8 -0.9 Powdered & Milk Products Prepared Dishes Confectionery PetCare Liquid Beverages & Ice Cream & Cooking Aids Sales 9.6 9.1 6.9 4.6 5.2 CHF bn rounded TOP Margin 23.7% 14.4% 13.3% 14.0% 20.7% -60 bps +30 bps -10 bps -210 bps +70 bps 14 August 9th, 2012 Half Year Roadshow
  • 16.
    Product Segment Review 15 August 9th, 2012 Half Year Roadshow
  • 17.
    Product Segment Review 16 August 9th, 2012 Half Year Roadshow
  • 18.
    Product Segment Review 17 August 9th, 2012 Half Year Roadshow
  • 19.
    Product Segment Review 18 August 9th, 2012 Half Year Roadshow
  • 20.
    Product Segment Review 19 August 9th, 2012 Half Year Roadshow
  • 21.
    Trading Operating ProfitMargin at 15.0%  Input cost pressure on COGS, mitigated by savings from NCE TOP and timely pricing 15.1% -20 TOP 15.0% +40 -10 bps -10  Distribution costs down due to -50 +30 efficiencies and mix  Marketing down, but consumer facing marketing up in constant currencies  Administration costs: comps 2011  Continued investment in R&D HY 2011 COGS Distribution Marketing Admin. Other* HY 2012 TOP = Trading Operating Profit; Other* includes Other Revenue, R&D and Net Other Trading Income and Expenses 20 August 9th, 2012 Half Year Roadshow
  • 22.
    Advertising Effectiveness Consumer Facing Marketing spend up 1.3% in constant currencies Upper quartile scores 63 51 40 30 2009 2010 2011 YTD 2012 Base: All Nestle Aired ads Numbers shown are percentages of ads that fall into each category, Note: Quartiles are based on all ads on database. 21 August 9th, 2012 Half Year Roadshow
  • 23.
    Income Statement As % of sales Difference in June 30 June 30 basis points/% 2011 2012 (rounded) Trading operating profit 15.1 15.0 -10 Net other operating income/expense (0.1) (0.1) Operating profit 15.0 14.9 -10 Net financial income/expense (0.8) (0.5) +30 Profit before taxes and associates 14.2 14.4 +20 Taxes (3.6) (3.7) -10 Share of results of associates 1.3 1.4 +10 Profit for the period 11.9 12.1 +20 Attributable to non-controlling interests (0.4) (0.5) -10 Attributable to shareholders of the parent 11.5 11.6 +10 Basic EPS (CHF) as reported 1.46 1.61 +10.3% Underlying EPS (CHF) constant currencies +12.4% 22 August 9th, 2012 Half Year Roadshow
  • 24.
    Cash Flow –a Key Priority  Driving performance – Targeting key drivers of operating cash flow: – Operating margin & working capital management – Treasury & tax  Improving external visibility of our performance – Transparency – Comparability 23 August 9th, 2012 Half Year Roadshow
  • 25.
    First Half 2012Operating Cash Flow +CHF 3.0 bn All Key Drivers Contributed to Improvement + 3.0 + 0.2 + 0.4 + 1.9 5.1 + 0.5 2.1 Operating Operating Variation Variation of other Treasury, Taxes Operating Cash Flow improvement of working operating and Others Cash Flow 2011.06 capital assets/liabilities 2012.06 (all figures in CHF bn, based on new cash flow presentation) 24 August 9th, 2012 Half Year Roadshow
  • 26.
    Working Capital Long-termTrend 2005 2006 2007 2008 2009 2010 2011 TNWC as % of sales Notes: Like for like estimate 2010 and 2011 figures exclude Alcon, Hsu Fu Chi and Yinlu 25 August 9th, 2012 Half Year Roadshow
  • 27.
    New Cash FlowPresentation – Increased Transparency  Effective 30 th June 2012:  Enhanced transparency and disclosure of Operating Cash Flow, segregated by key drivers: – Cash flow before changes in operating Assets and Liabilities – Working Capital and other operating Assets and Liabilities – Taxes, Treasury activities and Dividends from Associates  Change definitions of Operating Cash Flow and Free Cash Flow, to align with common practice amongst peers: – Operating Cash Flow to include Dividends from Associates (mainly L’Oréal) – Free Cash Flow to exclude minority interests (dividends paid, acquisitions of shares) 26 August 9th, 2012 Half Year Roadshow
  • 28.
    Alignment Behind ourRoadmap Drives Performance Competitive Advantages Operational Growth Pillars Drivers 27 August 9th, 2012 Half Year Roadshow
  • 29.
    2012 First HalfResults Discussion August 9th, 2012 Half Year Roadshow
  • 30.
    Appendix 29 August 9th, 2012 Half Year Roadshow
  • 31.
    Key Elements ofSales  Good operating performance +2.9% RIG +6.6%  RIG up versus Q1 OG +3.7% Pricing  Pricing continues +7.5% total  FX moderates from previous levels Acq./Div. +2.7% -1.8% Exchange Rates OG = Organic Growth RIG = Real Internal Growth 30 August 9th, 2012 Half Year Roadshow
  • 32.
    Weighted Average ExchangeRates CHF per 1H 2011 1H 2012 (%) US Dollar (1) 0.90 0.93 +2.7 Euro (1) 1.27 1.20 -5.1 £ Sterling (1) 1.46 1.46 +0.1 Real (100) 55.36 49.90 -9.9 Mex. Peso (100) 7.62 7.01 -8.0 Yen (100) 1.11 1.16 +5.2 31 August 9th, 2012 Half Year Roadshow
  • 33.
    FX Impact onBusinesses (%) 1Q 2012 HY 2012 Zone EUR -5.9 -4.4 Nestlé Nutrition -5.3 -2.6 Zone AMS -4.2 -0.8 Zone AOA -3.8 -0.6 Nestlé Waters -4.5 -0.5 Other -4.4 -2.4 Total -4.6 -1.8 32 August 9th, 2012 Half Year Roadshow
  • 34.
    First Half GroupNet Debt In line with Seasonal Trend 0.3 -3.1 Exchange 6.2 rates & other -2.2 -0.6 Free Cash 0.1 Flow Alcon Treasury Acquisition Dividends proceeds shares net of invested (net) disposals LT (incl. Minority) (net)a) b) 14.3 15.0 +0.7 bn Group Net Debt increased by CHF 0.7 billion Net debt Net debt 1 January 30 June a) Mainly bonds, Asian equities reclassified to Liquid assets/Net debt because they will be realised within one year b) Adjusted Net Debt including LT investment of Alcon cash proceeds amounts to CHF 14.3 bn 33 August 9th, 2012 Half Year Roadshow
  • 35.
    Cash Flow Illustrative examples of new presentation based on FY 2010 and FY 2011 figures 34 August 9th, 2012 Half Year Roadshow
  • 36.
    Operating Cash Flow Old presentation (until 2011) New presentation (as from 2012) In millions of CHF 2011 2010 In millions of CHF 2011 2010 Operating activities Operating activities Profit for the period 9'804 35'384 Operating profit 12'471 38'820 Non-cash items of income and expense 3'039 (20'948) Non-cash items of income and expense 3'335 (20'563) Decrease/(increase) in working capital (1'837) (632) Cas h flow befor e c hanges in 15'806 18'257 Variation of other operating assets and liabilities (1'243) (196) oper ating as s ets and liabilities O per ating c as h flow 9'763 13'608 Decrease/(increase) in working capital (1'983) (907) Variation of other operating assets and liabilities (760) 210 Cas h gener ated fr om oper ations 13'063 17'560 Seperate disclosure of taxes and treasury Net cash flows from treasury activities (745) (946) operational activities Taxes paid (2'555) (3'006) New component of the operating cash flow Dividends from associates 417 360 O per ating c as h flow 10'180 13'968 35 August 9th, 2012 Half Year Roadshow
  • 37.
    Enhanced Transparency forFY Disclosure  Effective 31 st December 2012:  Presentation of the detail components of the Free Cash Flow  Reconciliation between Operating Cash Flow, Free Cash Flow and evolution of the Group Net Financial Debt 36 August 9th, 2012 Half Year Roadshow
  • 38.
    Enhanced Transparency forFY DisclosureIn millions of CHF 2011 2010 O per ating c as h flow 10'180 13'968 Capital expenditure (4'779) (4'576) Detail components Expenditure on intangible assets (247) (408) Sale of property, plant and equipment 111 113 of Free Cash Flow Investments (net of disinvestments) in associates (60) (106) Other investing cash flows (448) (439) F r ee c as h flow 4'757 8'552 Acquisition of businesses (3'742) (5'582) Financial liabilities and short-term investments acquired/transferred (76) (330) Disposal of businesses 7 27'715 Outflows from long-term financial investments (1'802) (2'528) “Bridge” Free Cash Reclassification of long-term investments from non-current financial assets 1'274 0 Flow and Net Financial Dividends paid to shareholders of the parent (5'939) (5'443) Debt Evolution Purchase of treasury shares (net sale) (4'953) (11'857) Cash flows with non-controlling interests (266) (791) Cash inflows from hedging derivative financial instruments 394 1'118 Currency retranslations and exchange differences (140) 664 Other movements 21 (196) ( Inc r eas e) /Dec r eas e of Net financ ial debt ( 10'465) 11'322 Net financial debt at beginning of year (2010: including Alcon) (3'854) (15'176) Net financ ial debt at end of y ear ( 14'319) ( 3'854) 37 August 9th, 2012 Half Year Roadshow
  • 39.
    2013 Pension Accounting Changes 38 August 9th, 2012 Half Year Roadshow
  • 40.
    Main Changes PensionAccounting (IAS 19 revised) Impact P&L as from 2013 onwards (2012 will be restated):  Replacement of the Expected Return on Plan Assets (ERoA) by the Discount Rate (DR) used for Plan Liabilities => Calculation of a net interest cost/income  Split of the pension costs: – Service costs continue to be included in Trading Operating Profit – Net interest cost/income to be presented together with the Group financing costs 39 August 9th, 2012 Half Year Roadshow
  • 41.
    Impact on Nestléof New Pension Accounting (as from 2013) Based on 2012 estimates:  Trading Operating Profit margin: approx. -20 to -30 bps  Net Financing Cost increase by CHF 250 million  Net Profit decrease of approx. CHF 360 million (30-40 bps)  Impact on EPS of approx. 10 cents per share Just an accounting change, no change of underlying performance & cash generation 40 August 9th, 2012 Half Year Roadshow
  • 42.
    How will NestléMitigate the Impact of Pension Liabilities Going Forward?  Continue to progressively transition from Defined Benefit to Hybrid Plans (Defined Contribution oriented)  Continued improvement in operating performance 41 August 9th, 2012 Half Year Roadshow
  • 43.
    Comparability with Peers  Applies for all companies reporting in accordance with IFRS  Comparability issue with US-based competitors, as reporting of pension costs has not changed under US GAAP: the use of a long-term expected return on plan assets (as maintained under US GAAP) usually results in lower pension costs recognized in the P&L 42 August 9th, 2012 Half Year Roadshow