Whole Foods Market had a very successful 2004 fiscal year, with record sales growth and profits. They expanded globally with new stores in Canada and acquiring stores in the UK. They also made progress on priorities like developing enhanced animal welfare standards and expanding their training university. Looking ahead, Whole Foods is focused on continued expansion, with plans to increase their store count and square footage significantly in 2005 and beyond.
Whole Foods Market is the largest natural and organic foods retailer in North America. In 2003, it had sales of $3.1 billion, operating income of $175 million, and 145 stores across the US and Canada. The company aims to reach $10 billion in sales by 2010 by continuing to open new, larger stores with an emphasis on perishables and prepared foods.
Celanese Corporation reported record fourth quarter and full year results for 2007. Key highlights include a 23% increase in fourth quarter net sales compared to the prior year and operating profit more than doubling. For the full year, net sales increased 12% and operating profit increased 21% compared to 2006. Based on continued strength in global markets, the company raised its full year 2008 outlook for adjusted earnings per share and operating EBITDA.
This annual report summarizes Dollar General's performance for the fiscal year ending February 3, 2006. Some key points:
- Dollar General grew net sales by 12% to $8.6 billion and net income by 2% to $350 million, with earnings per share of $1.08.
- The company opened 734 new stores, including 29 new Dollar General Markets, bringing the total store count to 7,929.
- Initiatives like EZstore and Project Gold Standard aimed to improve store operations and strengthen the organization. Nearly half of stores implemented the EZstore model by year-end.
- Leadership was enhanced with several new executive hires and a reorganization to better
This document is The Home Depot's 2007 Annual Report. It provides a summary of the company's financial performance for 2007, including net sales, net earnings, earnings per share, total assets, liabilities, and store count. It discusses investments made in areas like associate engagement, product excitement, availability, shopping environment, and serving professional customers. It also summarizes international performance, the company strategy of focusing on retail operations, and capital allocation plans. The report is addressed to shareholders, associates, customers, suppliers and communities.
This document provides an overview of General Mills' annual report for 2005. It highlights that General Mills saw 2% sales growth to $11.2 billion globally. Net earnings increased 18% to $1.2 billion, including proceeds from divesting two businesses. The US Retail segment achieved $7.8 billion in sales, while the Bakeries and Foodservice segment saw stabilizing profits. The International segment grew net sales 11% and operating profits over 40%. General Mills also strengthened its balance sheet by paying down $2 billion in debt. The company expects continued growth through product innovation, expanding channels, and international and margin expansion.
The document provides a summary of The Home Depot's annual report for fiscal year 2006. It discusses the company's performance highlights for 2006 including net sales of $90.8 billion and net earnings of $5.8 billion. It also lists the company's priorities going forward which include improving customer service, driving product innovation and value, improving product availability, enhancing the store environment, and serving professional contractors. Finally, it provides an overview of the company's community involvement efforts in 2006 which included responding to natural disasters and contributing to affordable housing projects.
Celanese Corporation reported record results in the first quarter of 2006, with net sales up 12% and operating profit up 26% compared to the same period last year. Diluted earnings per share were $0.68 compared to a loss of ($0.08) in 2005. The company reaffirmed its guidance for adjusted earnings per share of between $2.50-$2.90 for 2006.
The document is The Home Depot's 2002 Annual Report. It provides the following key information:
1) The Home Depot is the world's largest home improvement retailer with fiscal 2002 sales of $58.2 billion. It operates various store formats across the US, Canada, and Mexico.
2) In 2002, The Home Depot achieved net earnings of $3.7 billion, earnings per share growth of 21%, and a return on invested capital of 18.8%. It ended the year with $2.3 billion in cash after repurchasing $2 billion in stock.
3) The Home Depot made significant investments in 2002 to transform the business through technology upgrades, merchandising
This document provides an annual report for Sysco Corporation for the fiscal year ending July 3, 2004. It includes financial highlights showing sales increased 12% to $29.3 billion and net earnings increased 17% to $907 million. It discusses challenges in the year from high product cost inflation of 6.3% and fuel costs. It outlines Sysco's focus on growing profitable customer businesses and improving customer relationships. It describes Sysco's national supply chain initiative including new regional distribution centers to enhance service and reduce costs. In closing, it expresses confidence in addressing economic uncertainty through its employees, products/services, and financial resources.
The document is Jarden Corporation's 2004 annual report. It discusses Jarden's record financial results in 2004, including organic sales growth of 5% and EBITDA margins of 18% excluding non-cash charges. It also summarizes two acquisitions completed in 2004 - The United States Playing Card Company and American Household, Inc. - and how they will help Jarden expand its business and drive margin improvement towards a target of 15% over five years. The report highlights the company's focus on innovation through new product introductions and maintaining financial flexibility.
Campbell Soup Company reported strong financial results in 2006. Net sales increased to $7.34 billion from $7.07 billion in 2005. Earnings from continuing operations grew to $755 million in 2006 from $644 million in 2005. The company is focused on driving sustainable quality growth through five key strategies, including expanding their iconic brands within the categories of Simple Meals and Baked Snacks. In 2006, the company increased sales of brands like Campbell's soup, Goldfish crackers, and Pepperidge Farm cookies. The annual report discusses Campbell Soup Company's financial performance in 2006 and strategic plans for further growing their business in the coming years.
This document provides an overview and agenda for Dean Foods Company's presentation at Prudential Equity Group's 15th Annual Back-to-School Consumer Conference on September 7, 2006. The presentation discusses Dean Foods' unique beverage platform through its two main business units, Dean Dairy Group and WhiteWave Foods. Dean Dairy Group is presented as the largest dairy company in the US with a leading portfolio of national and regional dairy brands. WhiteWave Foods owns several leading organic and natural brands such as Silk soy milk and is positioned for continued strong growth. The presentation outlines Dean Foods' strategy and initiatives to drive sustained shareholder value creation through its two business units.
The document is ConAgra Foods' 2008 annual report which provides financial highlights and discusses the company's focus on its food business. It summarizes that net sales increased over $11 billion but profit growth was impacted by high inflation. The company divested non-core businesses and focused on innovation, cost reductions, and quality improvements to combat inflation and drive sustainable growth going forward.
The document provides information about Coca-Cola and PepsiCo's group members, history, mission, social responsibility, expansion efforts, impact on economic change, marketing strategies, and financial trends. It compares key financial metrics for Coca-Cola and PepsiCo such as revenues, expenses, cash flows, debt levels, and profitability ratios for 2013. While PepsiCo reported higher revenues, Coca-Cola had higher operating income and net income. Both companies increased their cash balances year-over-year and maintained reasonable debt ratios.
Celanese Corporation reported strong third quarter results, with net sales increasing 10% to $1.685 billion compared to the prior year. Operating profit more than doubled to $200 million, driven by increased volumes, higher margins, and lower charges. The company adjusted its full year earnings per share outlook to a range of $2.70 to $2.80 per share, towards the top end of its previous guidance. All business segments saw increased sales and profits compared to the third quarter of 2005.
The document provides an overview of Simply Toddy, a proposed ready-to-drink cold brew coffee beverage. It outlines the large and growing market opportunity in the RTD coffee space, customer survey results showing interest in cold brew coffee, and Simply Toddy's product strategy including initial offerings, pricing, benefits, and sustainable competitive advantages around packaging, innovation, and partnerships. The document also covers target markets, distribution channels, marketing communications, positioning, management team, risks and mitigations, financial projections, and competitive landscape.
Celanese Corporation reported strong financial results for the second quarter and first half of 2006, with net sales increasing 11% compared to the previous year. Operating profit rose 7% for the quarter and 17% for the first half, driven by continued strong demand across business segments. Adjusted earnings per share increased 34% for the quarter and 18% for the first half. All business segments saw higher sales and improved operating performance compared to the previous year.
This annual report summarizes Campbell Soup Company's financial highlights and business performance for fiscal year 2007. Key points include:
- Net sales increased 7% to $7.9 billion and adjusted earnings per share increased 13% to $1.95.
- The company achieved strong sales growth in U.S. soup, beverages, and Pepperidge Farm baked snacks. International operations also improved.
- Campbell is focusing on winning in the marketplace through products aligned with wellness trends like lower sodium soups and juices. It is also focusing on winning in the workplace by improving employee engagement.
- The company delivered superior shareholder returns and is well positioned for continued growth by expanding in key categories and new markets globally.
Campbell Soup Company reported strong financial results for fiscal year 2008 despite challenging market conditions. Net sales increased 8% to $7.998 billion and adjusted net earnings per share rose 7% to $2.09. The company's U.S. Soup, Sauces and Beverages business saw a 5% increase in sales. The Baking and Snacking business delivered an 11% increase in sales. International Soup, Sauces and Beverages sales increased 15%. Campbell remains focused on its core categories of Simple Meals, Baked Snacks, and Healthy Beverages which offer the best growth prospects globally.
The document summarizes The Home Depot's 2004 annual report. It discusses that in 2004, The Home Depot had record sales of $73.1 billion and saw increases in net earnings, earnings per share, total assets, and store count. Key accomplishments included comparable store sales growth of 5.4%, operating margin reaching 10.8%, and returning $4 billion to shareholders through stock buybacks and dividends. The company focused on enhancing its core business through merchandising resets and new products, extending into new store formats, and investing in its employees.
General Mills reported financial results for fiscal year 2006 that marked the beginning of a new phase of growth for the company. Net sales increased 4% to over $11.6 billion worldwide, and segment operating profit grew 5% despite significant input cost inflation. Earnings per share were $2.90. The company aims to deliver low single-digit sales growth, mid single-digit operating profit growth, and high single-digit earnings per share growth over the next 3-5 years. International expansion and growth in new retail channels will be important drivers of the company's future financial performance.
This annual report summarizes The Home Depot's performance in fiscal year 2005. Some key points:
- Sales reached a record $81.5 billion, up from $73.1 billion the previous year. Net earnings increased 16.7% to a record $5.8 billion.
- The company continued pursuing its strategy of enhancing its core business, extending into new areas like services, and expanding into new markets like the professional contractor segment.
- 21 acquisitions were completed in 2005 to help serve professional contractors better. The largest acquisition was Hughes Supply, to expand the company's presence in the professional market.
- Internationally, the company remains the top home improvement retailer in Canada
Celanese Corporation reported record second quarter results for 2008, with net sales increasing 20% and operating profit more than doubling compared to the second quarter of 2007. Several of Celanese's business segments saw higher sales and profits driven by increased pricing, volumes, and currency impacts. Despite challenges from higher raw material and energy costs, the company reaffirmed its full-year 2008 outlook for adjusted earnings per share and operating EBITDA.
The document is Campbell Soup Company's 2001 annual report. It summarizes the company's transformation plan to revitalize the business and return to growth. The plan focuses on 5 strategies: 1) revitalizing US soup sales, 2) strengthening the broader portfolio, 3) building new growth avenues, 4) improving quality while driving productivity, and 5) improving organizational excellence. The report provides details on initiatives under each strategy, and discusses financial performance and outlook.
1) The food distribution industry has undergone significant consolidation in recent decades, with the average sales per company increasing from $4 billion to $11 billion and the number of public companies in North America decreasing from 45 to just over 20.
2) The Quebec retail food market is dominated by three major distributors: Loblaws, Sobeys, and Metro, which combined control over 80% of supermarket sales.
3) While supermarkets were once the dominant force, food sales are becoming more fragmented, with growth in places like pharmacies, warehouse clubs, discount stores and convenience stores outpacing supermarkets. Specialty stores and small, local businesses also see opportunities in niche markets neglected by large players.
The document discusses the benefits of exercise for mental health. Regular physical activity can help reduce anxiety and depression and improve mood and cognitive function. Exercise causes chemical changes in the brain that may help alleviate symptoms of mental illness and boost overall mental well-being.
This document outlines the objectives and scope of a presentation on food and beverage marketing and feasibility studies. It discusses conducting a feasibility study to evaluate the viability of a new food service operation, including identifying market characteristics, analyzing the competition and site, estimating customer demand, and projecting operating results over multiple years. The presentation also covers using marketing to focus on excellent guest service and describing various marketing tactics for non-commercial food service.
If you are starting a new business or a veteran, it is wise to understand the basics of marketing. Without a marketing plan, you're going to experience a lot of frustration and insequirity. With a marketing plan, you'll have a blueprint that saves you money and insures success.
Victoria Garcia has been in the business of helping small businesss with their marketing for over 24 years. Feel free to contact her with questions if you have any.
This document provides an overview of tourism marketing. It discusses key concepts like the marketing concept, target markets and segmentation. Tourism marketing aims to achieve growth in tourism by satisfying tourists and earning profits. The tourism product is complex as it involves many industries and consumer preferences vary widely. Marketing strategies for tourism consider characteristics like the product being intangible and consumption happening instantly. The document also covers SWOT and PEST analysis for tourism marketing and the economic importance of marketing.
Digital Food Marketing - 10 Of The Most Delicious Opportunities for 2014Big Spaceship
People's relationship with food is quickly evolving. Here are some ideas on how to Internet better for the edibles and juiceables.
If you like food and the Internet, you might enjoy the long version of this presentation here: http://spcshp.it/foodmarketing
Marketing involves identifying and meeting human needs through exchange between buyers and sellers. There are three key elements in the marketing process: marketers, products being marketed, and target markets. The goal of marketing is to establish long-term, profitable relationships with customers by delivering superior value compared to competitors. This is achieved through understanding customer needs and wants, creating appropriate products and services, and engaging in effective exchanges to satisfy customers.
The annual report summarizes Whole Foods Market's financial performance and operations in 2006. It discusses record sales and profit growth, new store openings, commitment to stakeholders, and goals for continued expansion. Key highlights include double-digit comparable store sales growth, increased market share, and a plan to double sales and square footage by 2010 while maintaining a focus on core values.
This letter summarizes the company's strong financial performance in fiscal year 2006. Key points include:
- Sales increased 19% to $5.6 billion with 11% comparable store sales growth.
- The company repurchased $100 million in stock and had $256 million in cash with low debt.
- They announced a dividend increase and implemented their third stock split.
- The company expanded square footage by 10% and opened 13 new stores.
- Robust sales helped drive healthy returns including a 40% return on invested capital.
Whole Foods Market is the largest natural and organic foods retailer in North America. In 2003, it had sales of $3.1 billion, operating income of $175 million, and 145 stores across the US and Canada. The company aims to reach $10 billion in sales by 2010 by continuing to open new, larger stores with an emphasis on perishables and prepared foods.
- The document is the 2008 annual report and letter to stakeholders of Whole Foods Market.
- In 2008, Whole Foods saw sales growth of 24% but comparable store sales growth slowed to 5% due to economic challenges. They opened 20 new stores.
- Actions were taken to reduce costs and slow growth, including job cuts, reducing new store openings, and suspending the dividend. Additional funding was obtained through the sale of preferred stock.
- The economic challenges prompted a more value-oriented approach and efforts to differentiate Whole Foods' product selection.
- The document is Whole Foods Market's 2008 annual report letter to stakeholders. It discusses the challenges of 2008 due to economic deterioration but reports overall sales growth of 24% and comparable store sales growth of 5%.
- Key initiatives in 2008 included integrating Wild Oats stores, opening 20 new stores, and implementing cost containment measures like job cuts to prepare for economic challenges.
- Moving forward, Whole Foods plans to focus on value and cost containment while still pursuing growth, aiming to open 15 new stores in 2009.
This annual report summarizes the company's performance in 2008. It discusses challenges faced due to economic deterioration, but also growth through new store openings and sales increasing 24% to $8 billion. Cost-cutting measures were implemented and an investment was received to ensure liquidity during difficult times. The company remains committed to its core values like high quality, customer satisfaction, and social/environmental responsibility.
This annual report summarizes the company's performance in 2008. It discusses challenges faced due to economic deterioration, but also growth through new store openings and sales increasing 24% to $8 billion. Cost-cutting measures were implemented and an investment was received to ensure liquidity during difficult times. The company remains committed to its core values like high quality, customer satisfaction, and social/environmental responsibility. Future outlook expects stabilization and growth through improvements and increased value perception, but comparable sales growth for 2009 was not predicted due to economic uncertainty.
This annual report summarizes the company's performance in 2008. It discusses challenges faced due to economic deterioration, but also growth through new store openings and sales increasing 24% to $8 billion. Cost-cutting measures were implemented to prepare for a difficult economy. An investment of $425 million by Leonard Green & Partners provides confidence. The company focuses on differentiating its high-quality products and strengthening its value image. Future sales growth will depend on economic stabilization and improvements in acquired stores.
This document is Dollar Tree's 2014 Annual Report which summarizes their financial performance for the year. Some key points:
- Dollar Tree experienced record sales of $8.6 billion in 2014, a 9.7% increase over the previous year and their first time exceeding $8 billion in annual sales.
- Net income was $599.2 million, up slightly from the previous year. Earnings per share were $2.90.
- The company operated over 5,300 stores across North America and had over 90,000 employees by the end of 2014.
- A major announcement was made to acquire Family Dollar Stores, which would more than double the combined company's store count and revenue.
30 Years and Growing1$ at a time30years strong, or.docxtamicawaysmith
30 Years and Growing
1
$ at a time
30
years strong, or
12 0
profitable fiscal quarters, or
1,565
weeks of sustained growth to our
14,334
locations across the U.S. and Canada, with
each store dedicated to making shopping a
fun, exciting, rewarding experience for every
of our customers.
2016 Annual Report
1986 – Opened its first five
stores - named Only $1.00
(3 VA, GA, TN)
14,334
stores at year-end,
serving customers
with great values
and convenience.
Delivering Value
and Convenience
to Customers
for 30 Years.
Dollar Tree, Inc. is the world’s leading operator
of $1 price-point variety stores. The Company
also offers value at the fixed price-point
of $1.25 CAD at its 226 stores in Canada.
Additionally, the Company operates nearly
8,000 stores under the Family Dollar banner,
which provides customers with a broad
selection of competitively priced merchandise
in convenient neighborhood store locations.
Overall, Dollar Tree operates more than 14,300
stores across the 48 contiguous states and
five Canadian provinces, supported by a
coast-to-coast logistics network and more
than 176,000 associates.
A Fortune 200 Company, Dollar Tree has
served North America for more than 30 years.
The Company utilizes store support centers
in Chesapeake, Virginia and Matthews,
North Carolina. Dollar Tree continues to grow
and is reaching new customers on-line at
www.DollarTree.com.
Dollar Tree 2016 Annual Report 1
2012 2013 2014 2015 2016
8.6
15.5
20.7
7.87.4
NET SALES
($ in Billions)
2012 2013 2014 2015 2016
$2.90
$1.26
$3.78
$2.72$2.68
EARNINGS PER SHARE
Financial Highlights
(a) On July 6, 2015, Dollar Tree acquired Family Dollar Stores, Inc. The results of operations for Family Dollar are included in Dollar Tree’s results of operations
beginning on July 6, 2015.
(b) The 2014 results include interest and expense totalling $75.2 million related to the acquisition of Family Dollar Stores, Inc. The impact of these expenses
represented $0.22 per diluted share.
(c) The 2012 results include the impact of a 53rd week, commensurate with the retail calendar, and a gain on the sale of our investment in Ollie’s Holdings, Inc.
The extra week contributed $125 million of revenue and $0.08 diluted earnings per share. The gain on the Ollie’s sale amounted to $0.16 diluted earnings
per share. All other fiscal years reported in the table contain 52 weeks.
(d) Reflects 2-for-1 stock split in June 2012.
(e) Family Dollar was not included in the determination of these items.
(f) Family Dollar was only included in the determination of these items for the year ended January 28, 2017.
2016 2015(a) 2014(b) 2013 2012(c)
Income Statement Data:
Net sales $20,719.2 $15,498.4 $ 8,602.2 $ 7,840.3 $ 7,394.5
Gross profit 6,394.7 4,656.7 3,034.0 2,789.8 2,652.7
Selling, general and administrative expenses 4,689.9 3,607.0 1,993.8 1,819.5 1,732.6
Operating income 1,704.8 1,049.7 1,040.2 970.3 ...
The 2002 CVS Corporation Annual Report summarizes the company's financial performance and strategic initiatives. Key points include:
1) CVS saw record sales of $24.2 billion in 2002, an 8.7% increase over 2001, and same store sales grew 8.4% while pharmacy same store sales grew 11.7%.
2) CVS opened 266 new stores in 2002, including 78 in new markets, as part of its strategy to capitalize on pharmacy growth opportunities in expanding markets.
3) CVS remains focused on making shopping easy for customers through convenient locations, prescription renewal options, and its ExtraCare loyalty program with 33 million members.
This document provides an overview of Whole Foods Market's 2007 annual shareholders meeting. It includes forward-looking statements and associated risks, highlights of the company's performance and growth, and an overview of its stakeholder philosophy and core values of quality, customer satisfaction, Team Member excellence and happiness, growth through profits, and community and environmental support.
PepsiCo offers the world's largest portfolio of billion-dollar food and beverage brands across 19 product lines. The company aims to grow international revenues faster than global GDP growth and increase market share in key markets. PepsiCo also aims to expand margins, increase cash flow proportionate to earnings growth, and deliver top quartile shareholder returns. The company is committed to sustainability across its operations, communities, and value chain.
This document summarizes the annual meeting of shareholders for Whole Foods Market. It includes a safe harbor statement, information about the company's mission and core values, growth and financial performance, goals for the future including expanding to $12 billion in sales by 2010, and commitment to stakeholders, local communities, and the environment. It discusses the company's leadership structure with separate roles for the chairman and lead director to ensure protection of shareholders.
The document provides an annual report for Whole Foods Market for the 2007 fiscal year. It summarizes the company's strong financial performance including 15% sales growth and 7% comparable store sales growth. It details strategic initiatives like acquiring Wild Oats Markets and emphasizes the company's stakeholder philosophy of balancing interests of customers, employees, shareholders, and communities. It expresses optimism for continued growth through new store openings and meeting a goal of $12 billion in sales by 2010.
The document provides an annual report and letter to stakeholders from Whole Foods Market for the 2007 fiscal year. It summarizes the company's strong financial performance, including 15% sales growth and 7% comparable store sales growth. It also details strategic initiatives like acquiring Wild Oats Markets and expanding private label offerings. The CEO expresses optimism about continued growth and achieving the goal of $12 billion in sales by 2010.
Campbell Soup Company reported financial results for fiscal year 2003, with net sales increasing 9% to $6.678 billion driven by product innovation and marketing initiatives. Earnings before interest and taxes grew 12% to $1.105 billion. The company discussed its 5-point plan to renew the business, focusing on revitalizing core U.S. soup, beverage, and sauce businesses; strengthening the broader portfolio; improving product quality; increasing productivity; and building organizational excellence. Recent initiatives for U.S. soup included new convenient packaging and flavors as well as marketing campaigns promoting soup meal solutions.
Cannabis Investor Pitch Deck Template consists of 31 power point slides covering the essential parts.
https://cannabusinessplans.com/product/cannabis-investor-pitch-deck-template/
Robert G. Bohn, Chairman, President and CEO of Oshkosh Truck Corporation, and Charles L. Szews, Executive VP and CFO, reported record financial results for the first quarter of fiscal year 2006. Sales increased 22.5% to $790.3 million and operating income grew 28.6% to $87 million. EPS increased 28.6% to $0.72. For fiscal year 2006, the company estimates sales between $3.3-3.4 billion, operating income between $316.5-329 million, and EPS between $2.55-2.65, representing growth of 17-21.6%.
1) Oshkosh reported record second quarter fiscal year 2006 results with sales up 25.6% and operating income up 27.3% driven by strong performance in the defense segment.
2) The defense segment results nearly doubled compared to the previous year due to growth in remanufactured and new truck sales, however challenges remain in locating used vehicle carcasses for remanufacturing.
3) The fire and emergency segment saw a temporary dip in earnings as anticipated due to heavily weighted airport product sales in the second half of the year and two component issues that delayed revenue recognition.
Robert G. Bohn, Chairman, President and CEO of Oshkosh Truck Corporation, discussed the company's strong third quarter fiscal year 2006 results and provided an outlook for fiscal years 2006 and 2007. Some highlights included record sales and operating income for Q3 2006. The company also announced two acquisitions, AK Specialty Vehicles and Iowa Mold Tooling, expected to be accretive to earnings in fiscal 2007. For fiscal 2006, Oshkosh estimates sales growth of 14.9-16.6% and EPS growth of 24-26%. Fiscal 2007 estimates include sales of $3.65-$3.75 billion and EPS of $3.05-$3.15.
Oshkosh Truck Corporation presented an investor presentation on its proposed acquisition of JLG Industries, Inc. The presentation discussed Oshkosh's track record of successful acquisitions and shareholder value creation. It also outlined the objectives of acquiring JLG to support growth above 15%, diversify into the fast-growing aerial work platform market, and execute its long-term acquisition strategy. Finally, the presentation provided an overview of Oshkosh Truck Corporation and its proven strategy of new product leadership, operational excellence, and strategic acquisitions that have fueled strong sales and earnings growth.
Robert Bohn, Chairman of Oshkosh Truck Corporation, discussed the company's strong fiscal 2006 financial results and outlook for fiscal 2007. Key points include:
1) Fiscal 2006 sales increased 15.8% and operating income grew 22%, with EPS up 26.6%.
2) The acquisition of JLG Industries was announced, which will diversify the company and support growth of over 15%.
3) Fiscal 2007 stand-alone estimates include sales of $3.65-$3.75 billion and EPS of $3.05-$3.15, with the JLG acquisition expected to be modestly accretive.
In this earnings call, Oshkosh Truck Corporation discusses its first quarter 2007 results. Sales increased 27.4% to $1.01 billion due to the acquisition of JLG Industries. Operating income decreased 3.9% to $83.6 million and EPS decreased 23.6% to $0.55. The company increased its full-year 2007 EPS estimate range to $3.15 to $3.25 per share. JLG is meeting expectations and integration is progressing well. Defense sales were lower compared to strong prior year results while fire and emergency and commercial saw strong performance.
This document summarizes an earnings conference call for Oshkosh Truck Corporation for the second quarter of fiscal year 2007. Sales increased 96.6% to $1.66 billion and operating income grew 69.1% to $134.8 million. For fiscal year 2007, the company estimates sales of $6.1-6.2 billion and operating income of $568-580 million. It also provides segment-level results and highlights for access equipment, defense, fire & emergency, and commercial.
1) Oshkosh reported strong third quarter 2007 results with sales increasing 108% to $1.85 billion and operating income up 133% to $192.7 million.
2) Access equipment and defense led the growth in sales and operating income. The acquisition of JLG was accretive to EPS by $0.35 per share.
3) For fiscal year 2007, Oshkosh estimates sales between $6.3-6.35 billion and EPS between $3.35-3.40, and for fiscal year 2008 estimates sales between $7-7.2 billion and EPS between $4.15-4.35.
The document summarizes Oshkosh Truck Corporation's fourth quarter fiscal 2007 earnings conference call. It discusses record sales and operating income for fiscal 2007. Projections are provided for fiscal 2008, estimating sales between $7.1-7.3 billion and operating income between $690-715 million. Segment performances are reviewed, with access equipment and defense highlighted as key growth drivers. Estimates are also given for interest expense, tax rates, capital expenditures and debt levels for fiscal 2008.
Oshkosh Corporation held an earnings conference call to discuss its first quarter fiscal year 2008 results. Sales increased 49% to $1.5 billion due to strong growth in access equipment and defense, while earnings per share declined 9.1% to $0.50. For fiscal year 2008, the company estimates revenue of $7.1-7.3 billion, operating income of $675-700 million, and earnings per share of $4.15-4.35. Challenging economic conditions are impacting commercial and fire & emergency segments, but global initiatives and cost reductions will support the full-year outlook.
The document summarizes Oshkosh Corporation's earnings conference call for the second quarter of fiscal year 2008. Key highlights include sales increasing 6.7% to $1.8 billion and operating income rising 24.8% to $168.2 million. EPS grew 42.6% to $0.97. While access equipment and defense saw strong demand, commercial and fire & emergency faced challenging market conditions. The company maintained its fiscal year 2008 EPS estimate range of $4.15 to $4.35.
The document summarizes Oshkosh Corporation's earnings conference call for the third quarter of fiscal year 2008. It discusses increases in sales revenue but decreases in operating income and earnings per share compared to the previous year. Several initiatives are mentioned to manage costs and cash flow in changing market conditions. Business segment results are provided, with strength in access equipment and defense but challenges in commercial and fire & emergency sectors.
This document is the transcript from Oshkosh Corporation's earnings conference call for the fourth quarter of fiscal year 2008. It discusses Oshkosh's financial results for Q4 and fiscal year 2008, including sales, operating income, earnings per share, and debt reduction. It also provides an outlook for fiscal year 2009, estimating revenues of $6.3-6.7 billion, operating income of $350-400 million, and EPS of $1.65-2.05. The transcript reviews performance and outlook for each of Oshkosh's business segments and discusses its financing plans.
Robert Bohn and David Sagehorn of Oshkosh Corporation gave a presentation at the Goldman Sachs Conference in November 2008. They discussed Oshkosh's strong financial position and actions taken to reduce costs and debt. While market conditions were volatile due to the economic downturn, Oshkosh was well positioned with backlogs in defense, fire, and refuse collection vehicles. The presentation outlined Oshkosh's segments and strategies to manage through the difficult economy.
1) The document is from a presentation given by Oshkosh executives Charles Szews and David Sagehorn at the R.W. Baird Industrial Conference on November 12, 2008.
2) Oshkosh reported sales increased 13.2% to $7.1 billion in fiscal 2008, with international sales reaching $2.1 billion. However, operating income decreased 1.5% and EPS decreased 5.9% due to non-cash impairment charges.
3) Oshkosh recently secured multiple defense contracts and sees opportunities in the domestic refuse collection vehicle market, but the current market volatility and credit crisis make fiscal 2009 projections difficult given exposure to construction and municipal spending.
Charles Szews, President and COO of Oshkosh Corporation, presented at the Cowen and Company Aerospace & Defense Conference on February 5, 2009. He discussed Oshkosh's business segments, products, competitive advantages, challenges, and actions taken in response to the economic downturn. Key points included reduced revenues and earnings in Q1 2009, cost reduction efforts, and focus on core businesses with strong backlogs like defense and fire apparatus that have gained market share.
Oshkosh Corporation held an earnings conference call to discuss its first quarter fiscal year 2008 results. Sales increased 49% to $1.5 billion due to strong growth in access equipment and defense, while earnings per share declined 9.1% to $0.50. For fiscal year 2008, the company estimates revenue of $7.1-7.3 billion, operating income of $675-700 million, and earnings per share of $4.15-4.35. Challenging economic conditions are impacting commercial and fire & emergency segments, but global initiatives and cost reductions will support the full-year outlook.
The document summarizes Oshkosh Corporation's earnings conference call for the second quarter of fiscal year 2008. Key highlights include sales increasing 6.7% to $1.8 billion and operating income rising 24.8% to $168.2 million. EPS grew 42.6% to $0.97. While access equipment and defense saw strong demand, commercial and fire & emergency faced challenging market conditions. The company maintained its fiscal year 2008 EPS estimate range of $4.15 to $4.35.
This document contains the transcript from Oshkosh Corporation's earnings conference call for the third quarter of fiscal year 2008. Key highlights include a 6.6% increase in quarterly sales to $1.97 billion but a 5.9% decrease in operating income to $181.2 million. EPS for the quarter decreased 1.7% to $1.19. Oshkosh revised its estimate for full year 2008 EPS to a range of $3.15 to $3.30.
This document summarizes an earnings conference call for Oshkosh Corporation for the fourth quarter of fiscal year 2008. It discusses the company's financial results including a 5.8% increase in sales to $1.9 billion but a 32% decrease in operating income to $122 million. The document also provides an overview of Oshkosh's fiscal year 2008 results and discusses challenges faced in various business segments due to economic conditions. It notes actions taken by the company to reduce costs and debt. An outlook is given for fiscal year 2009 noting market volatility and a plan to drive over $500 million in debt reduction. Business segment results and outlooks are also summarized.
Economic Risk Factor Update: June 2024 [SlideShare]Commonwealth
May’s reports showed signs of continued economic growth, said Sam Millette, director, fixed income, in his latest Economic Risk Factor Update.
For more market updates, subscribe to The Independent Market Observer at https://blog.commonwealth.com/independent-market-observer.
Vicinity Jobs’ data includes more than three million 2023 OJPs and thousands of skills. Most skills appear in less than 0.02% of job postings, so most postings rely on a small subset of commonly used terms, like teamwork.
Laura Adkins-Hackett, Economist, LMIC, and Sukriti Trehan, Data Scientist, LMIC, presented their research exploring trends in the skills listed in OJPs to develop a deeper understanding of in-demand skills. This research project uses pointwise mutual information and other methods to extract more information about common skills from the relationships between skills, occupations and regions.
Madhya Pradesh, the "Heart of India," boasts a rich tapestry of culture and heritage, from ancient dynasties to modern developments. Explore its land records, historical landmarks, and vibrant traditions. From agricultural expanses to urban growth, Madhya Pradesh offers a unique blend of the ancient and modern.
Dr. Alyce Su Cover Story - China's Investment Leadermsthrill
In World Expo 2010 Shanghai – the most visited Expo in the World History
https://www.britannica.com/event/Expo-Shanghai-2010
China’s official organizer of the Expo, CCPIT (China Council for the Promotion of International Trade https://en.ccpit.org/) has chosen Dr. Alyce Su as the Cover Person with Cover Story, in the Expo’s official magazine distributed throughout the Expo, showcasing China’s New Generation of Leaders to the World.
[4:55 p.m.] Bryan Oates
OJPs are becoming a critical resource for policy-makers and researchers who study the labour market. LMIC continues to work with Vicinity Jobs’ data on OJPs, which can be explored in our Canadian Job Trends Dashboard. Valuable insights have been gained through our analysis of OJP data, including LMIC research lead
Suzanne Spiteri’s recent report on improving the quality and accessibility of job postings to reduce employment barriers for neurodivergent people.
Decoding job postings: Improving accessibility for neurodivergent job seekers
Improving the quality and accessibility of job postings is one way to reduce employment barriers for neurodivergent people.
How to Invest in Cryptocurrency for Beginners: A Complete GuideDaniel
Cryptocurrency is digital money that operates independently of a central authority, utilizing cryptography for security. Unlike traditional currencies issued by governments (fiat currencies), cryptocurrencies are decentralized and typically operate on a technology called blockchain. Each cryptocurrency transaction is recorded on a public ledger, ensuring transparency and security.
Cryptocurrencies can be used for various purposes, including online purchases, investment opportunities, and as a means of transferring value globally without the need for intermediaries like banks.
2. Our core values reflect the sense of collective fate among our stakeholders and are the soul of our
company. Our Team Members, customers, shareholders, vendors, community and environment must
flourish together through their affiliation with us or we are not succeeding as a business. It is leadership’s
role to balance the needs and desires of all of our stakeholders and increase the productivity of
Whole Foods Market. By growing the collective pie, we create larger slices for all of our stakeholders.
Our Core Values: Selling the Highest Quality Natural and Organic Products Available Satisfying
and Delighting Our Customers Team Member Happiness and Excellence Creating Wealth Through
Profits and Growth Caring About Our Communities and Our Environment
3. more than 54% of Americans have tried organic foods and beverages and nearly one in 10 use organic products regularly or several times per week. Of those
Americans buying organic products, 58% believe the products are better for the environment, 54% believe they are better for their health, 42% believe they
O C TO B E R 21, 2 0 04 – Organic food sales grew 20% to $10 billion last year. According to our 2004 Whole Foods Market Organic Foods Trend Tracker™ survey,
Financial Highlights 2004 2003 2002 2001 2000
$ 3,864,950 $ 3,148,593 $ 2,690,475
sales (000s) $ 2,272,231 $ 1,838,630
$ 216,646 $ 167,379 $ 140,985 $ 104,459 $
operating income (000s) 94,643
$ 1.98 $ 1.58 $ 1.32 $ $
diluted eps from continuing operations 0.84 0.46
163 145 135 126 117
number of stores at end of fiscal year
$ 482,000 $ 424,000 $ 393,000
average weekly sales per store $ 353,000 $ 325,000
8.6% 10.0%
comparable store sales increase 14.9% 9.2% 8.6%
2004 was the best year in our 24-year history.
Dear Fellow Stakeholders:
I want to appreciate all of our Team Members for their ditures, of which $155 million was for new stores, as well
continued hard work and dedication and all of our customers as $28 million paid to shareholders in quarterly cash div-
are better quality and 32% believe they taste better.
and shareholders for their continued support. In a year that idends that we initiated at the beginning of the year. We
was challenging for most food retailers, we grew sales 23% were very pleased to have the confidence in our financial
to just under $4 billion. Our 14.9% comparable store sales position to increase that quarterly dividend 27% to $0.19
increase set a new company record. We had strong sales per share at year end.
every quarter and across all regions, all departments, and Our industry-leading performance and strong balance
all age classes of stores. Even our stores over eight years of sheet position led to our corporate credit rating being raised
age produced double-digit sales increases. Eighty-four percent to investment grade by both Moody’s Investors Service and
of all stores set weekly sales records and our sales per S&P Ratings Services and to a sharp 59% increase in our
gross square foot were $786, up from $716 last year. stock price during the fiscal year.
Our net profit margin for the year improved 25 basis Last year I spoke of three goals that were created during
points to 3.4% of sales, we produced a 21% increase in our 2003 Future Search process which stood out for us as
diluted earnings per share to $1.98, well ahead of our initial major priorities in 2004. We made significant progress dur-
guidance of $1.87 to $1.95, and we reported four consec- ing the year toward each of these goals.
utive quarters of positive EVA resulting in record EVA improve-
MM
ment of $12.6 million. G lo b al E x pan si o n
During the year, we opened our second store in Canada and
We earned $330 million in cash from operations which
10
acquired six Fresh & Wild stores in the United Kingdom.
allowed us to self fund our $265 million in capital expen-
$
4. Whole Foo d s Market Unive rsity (WFM-U )
We are very excited about expanding our presence in
As we continue to expand, maintaining our Team Members’
Canada and extending our company mission and the Whole
passion for our Mission and Core Values is an essential
Foods Market brand beyond North America and into Europe.
ingredient in setting us apart from our competitors. Cindy
The U.K. was an obvious choice due to the advanced
Bradley, formerly our VP of Team Member Services, was
acceptance of organics and the lack of language barriers
selected as our new VP of Learning at WFM-U. The vision for
there. We felt an acquisition was the right strategy for our
WFM-U is to create online, self-paced learning modules that
first overseas venture because, as with other successful
will engage our Team Members in active education and devel-
acquisitions we have made, the infrastructure and intel-
opment. The “U-Learn Network” was launched this year and
lectual capital we gained provided us with an immediate
several modules, made up of learning vignettes, are already
platform for expansion. We are actively exploring real estate
accessible. In the future, we hope to create product-related
opportunities in the London area with the goal of signing
training materials that will be accessible to both Team
a lease for a large format Whole Foods Market store in the
Members and customers, thereby creating an in-store learn-
very near future.
ing environment that will become an important part of
the Whole Foods Market shopping and work experience.
A n i mal Com pas s i o n Stan dard s
We decided the existing paradigm for animal production
“Building on the strength of 2004, I’m looking
should change and that we now have the scale and scope
forward to an even brighter 2005!”
to make a difference. Last year we began a rigorous process
The question I am asked most often is “how many Whole
of creating enhanced farm animal treatment standards
Foods stores can there be?” I don’t answer that question
beyond the strict animal welfare we already required. These
anymore because I have always been wrong in the past,
enhanced standards are being developed jointly by Whole
thankfully on the low side. We certainly are not limited by
Foods Market, animal welfare advocacy groups and various
opportunity as demographically the world continues to move
farmers and ranchers that we do business with, and focus
in our direction with an overall aging of the population and
on providing environments that best support the animals’
a growing interest in health, well-being and longevity. Our
natural physical needs, behavior and well being. This year we
2004 class of new stores was our best yet, with the 12 new
created standards for several species but hope to complete
stores (six of which were in new markets) averaging $575,000
standards for every species we sell over the next three years.
in weekly sales for the year. We believe the fact that our new
We also created an Animal Compassion Foundation which
stores are successful in markets as diverse as New York
will provide education and research services to assist and
City and Charleston, South Carolina, speaks to the broad
inspire ranchers and meat producers around the world to
appeal of our stores and the growing awareness of our brand.
achieve a higher standard of animal welfare excellence while
And, while I am not ready today to say our comparable store
still maintaining economic viability. Please check our web-
sales have broken out of their historical 8% to 9% range,
site for additional information about our welfare standards
we certainly have seen accelerating trends over the last ten
and the Animal Compassion Foundation.
Where Does the Money Go?
Growth Since IPO 9/26 /04 9/29/91* cagr
63.1%
163 11 24%
number of stores
Cost of Goods
$3.9 b $92.5 m
sales 33% Sold/Occupancy
$1.98 $0.17 21%
earnings per share 24.2%
32,100 1,100 30% Salaries/Benefits
team members
9.2%
$84.73 $4.25
stock price 27%
Income Taxes/
*1991 results do not include the impact Other Expenses
of subsequent pooling transactions.
3.4%
Stock price is split-adjusted IPO price
in January 1992. Net Income
2
5. We are Canadapleased to announce that for the eighthWholein a row our Team Members have )ranked
ence in very and extending our company mission and year Foo d s Market Unive rsity (WFM-U
us as one Foods Market brand beyond“100 Best Companies we continueFor.” In determiningour Team Members’
the Whole of Fortune magazine’s North America and As to Work to expand, maintaining who makes the
list, Europe. The U.K. was company benefits and practices but for our Mission and Core Values is an essential
into Fortune evaluates an obvious choice due to the passion places the greatest weight on responses
from a random survey of employees. Withlanguage ingredient in setting us apart fromwhich approximately
advanced acceptance of organics and the lack of more than 32,000 Team Members, of our competitors. Cindy
84% are full-time, we an acquisition was the right strat- Bradley,make the our VP of moved up 17 places from
barriers there, and we felt are the only national food retailer to formerly list. We Team Member Services, was
last for our first overseas this year, our highest placement on the list so far, of Learning at WFM-U. The vision for
egy year to number 30 venture because, as with other selected as our new VP and of the 37 large companies
listed, we acquisitions we fifth. made, the infrastructure WFM-U is to create online,Fame list learningcompanies
successful were ranked have We were also recognized in the new Hall of self-paced of 22 modules that
thatintellectual capital we gained“100 Best”with an imme- inception our1998.Members in active education and devel-
have appeared on the provided us list since its will engage in Team
and
opment. The “U-Learn Network” was launched this year
diate platform for expansion. We are actively exploring real
and several modules — made up of learning vignettes —
estate opportunities in the London area with the goal of
are already accessible. In the future, we hope to create
signing a lease for a large format Whole Foods Market store
product-related training materials that will be accessible
in the very near future.
to both Team Members and customers, thereby creating an
in-store learning environment that will become an impor-
A n i mal Com pas s i o n ate Stan da rd s
tant part of the Whole Foods Market shopping and work
We decided the paradigm for animal production must
experience.
change and that we have the scale and scope to make a
difference so last year we began a rigorous process of creat-
“Building on the strength of 2004, I’m looking for-
ing enhanced farm animal treatment standards beyond the
ward to an even brighter 2005!”
strict animal welfare we already required. These enhanced
standards are being developed jointly by Whole Foods
The question I am asked most often is “how many Whole
Market and animal welfare advocacy groups and focus on
Foods stores can there be?” I don’t answer that question
providing environments that best support the animals’
anymore because I have always been wrong in the past,
natural physical needs, behavior and well being. This year
thankfully on the low side. We certainly are not limited by
we created standards for several species but hope to com-
opportunity as demographically the world continues to
plete standards for every species we sell over the next three
move in our direction with an overall aging of the popu-
years. We also created an Animal Compassion Foundation
lation and a growing interest in health, well being and
which will provide education and research services to assist
longevity. Our 2004 class of new stores was our best yet,
and inspire ranchers and meat producers around the world
with the 12 new stores (six of which were in new markets)
to achieve a higher standard of animal welfare excellence
averaging $575,000 in weekly sales for the year. We believe
while still maintaining economic viability. Please check our
the fact that our new stores are successful in markets as
website for additional information about our animal wel-
diverse as New York City and Charleston, South Carolina,
fare standards and Animal Compassion Foundation.
EPA O C TO B E R 5, 2 0 04 – The Environmental Protection Agency (EPA) recognized
us for our green power purchases with a 2004 Green Power Leadership Award.
We currently purchase or generate more than 20% of our total national power
from green power sources each year. 3
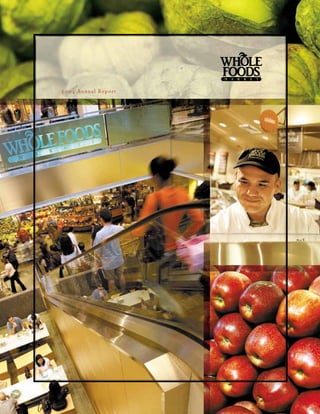
6. At 59,000 square feet, our Columbus Circle store in the Time Warner Center is the largest food store
in Manhattan. It is a true foodie paradise offering culinary treasures from the finest authentic artisans
and renowned purveyors of produce, meat, seafood, cheese, coffee, and baked goods that are free of
hydrogenated oils, artificial additives, preservatives, and sweeteners. Some of the store’s unique offer-
ings include: a 248-seat café where shoppers can enjoy our restaurant-quality prepared foods; a full
service Sushi Bar featuring fresh-cut sushi wrapped in organic seaweed; a walk-in Greenhouse show-
casing fresh cut and exotic flowers; a Wine Shop serving more than 700 varieties of wine; and a
Chocolate Enrobing Station where customers can request just about anything to be covered in chocolate.
4
7. AUGUST 3, 2 0 04 – We received top “Gourmet Market” and “Health and Natural Foods”
Manhattan-based locations. New Yorkers rave about the unprecedented amenities
rating in the Zagat Survey 2005 NYC Gourmet Marketplace Guide for our two
years, and most dramatically over the last year which top priority for us. One of our secrets is what I refer to as
seems to indicate we are still significantly under-stored. our “yogurt culture.” For example, in our Columbus Circle
Our goal is to produce 15% weighted average square store, about 25% of the Team Members transferred from
footage growth in fiscal 2005 and beyond. We have suffi- existing stores. They were the starting culture that launched
cient capital available to meet this goal, and over the last the fermentation that turned Columbus Circle into a true
five quarters, we have announced seven or more newly Whole Foods store. I will always remember when we opened
signed leases creating a pipeline of 53 stores covering 21 our second store back in 1982, and Team Members told me
states, Ontario, Canada, and the United Kingdom. These they feared we would get way too corporate and lose what
stores average 49,000 gross square feet, a 53% increase made us special. But we have proven that it doesn’t matter
over our existing average store size of 32,000 gross square how large we get as long we stay true to our core values
and food offerings.
feet. Our pipeline totals a record 2.6 million square feet, and continue to maintain and attract Team Members who
a 63% increase in square footage under development over share our passion.
Our motto — Whole Foods, Whole People, Whole Planet™
last year, and represents 50% of our existing square footage.
Our biggest challenges in 2005 center around meet- — emphasizes that our vision reaches far beyond just food
1
ing our higher square footage growth goals while delivering retailing. We are focused on selling the highest quality
strong results in light of the difficult comparisons we are natural and organic foods in the world and helping evolve
facing, particularly in the first half of the year. Despite 2004 a better person, company and world through our dedica-
NYC
being our best year ever, we still expect sales growth of 15% tion to our core values, stringent quality standards and
to 20% and comparable store sales growth of 8% to 10% principles of right livelihood, Team Member empowerment,
in 2005. Due primarily to significantly higher pre-opening community service, conscientious retailing and sustain-
expenses, it is likely our EPS growth will be lower than our able agriculture.
sales growth. In addition, new stores could have some We look forward to sharing and extending our vision
negative impact on store contribution, as new stores gen- with the rest of the world as we open bigger and better
erally have lower gross margins and higher direct store new stores at an accelerated rate in the years ahead, as
expenses than more mature stores. the brand awareness of Whole Foods Market continues to
The changes we made to our executive team and to increase, and as we progress toward our goal of $10 billion
our operating structure will better position us for the in sales by the year 2010.
accelerated growth ahead. I transferred the title of Presi-
dent to Walter Robb and A.C. Gallo, and we promoted Lee With warmest regards,
Valkenaar to the new position of Executive Vice President
of Global Support. We also expanded our number of oper-
ating regions from eight to ten for better regional support John Mackey
of our existing store base as well as for our anticipated Chairman of the B oard
future growth in those areas. Chie f E xe c utive O ffic e r
Even as we have grown at a rapid pace, hiring thou-
sands of new Team Members each year, we have managed
to spread and perpetuate our culture and this remains a
5
8. 2004 Global All*Stars
Whole Foods Market recognizes excellence in leadership throughout the company with our Global
All*Star awards. With more than 32,000 Team Members in over 200 stores, facilities and offices
across the company, being recognized as a Global All*Star is a true achievement. We honor these
48 individuals who have set incredibly high standards and have achieved truly outstanding results
over the course of the past year.
Rolando Alas Tee Ayer Michael Besancon Julie Birdsong Cindy Bradley Patrick Bradley
Produce Team Leader, Store Team Leader, President, Southern Project Leader, Vice President of President, Midwest
Mill Valley Galleria Pacific Region Central Support Learning/WFM-U Region
Tana Bronk Sean Byrne Steve Campbell Janet Chaykin Barbara Coffman Laura Derba
Whole Body Team Meat Team Leader, Store Team Leader, Bakery Coordinator, Whole Body Team Store Team Leader,
Member, Madison Pasadena Campbell Southwest Region Leader, Durham University Heights
Christopher Phillips- Omar Gaye Gary Giles Anthony Gilmore Stephen Goldberg Robin Graf
Frishman
Store Team Leader, Seafood Team Leader, President, Northern Prepared Foods Team Member Serv-
Store Team Leader, Alpharetta Pearl California Region Director, North ices Director, South-
West Bloomfield Hills Atlantic Region ern Pacific Region
Forrest Hoffmaster Don Hosfeld Bill Jordan George Khoury Paula Labian Roberta Lang
Director of Grocery Team Leader, Vice President, Vice President, Vice President of Team Vice President,
Operational Finance, Ft. Lauderdale Southern Pacific Region Southern Pacific Region Member Services General Counsel
Mid-Atlantic Region
6
9. Terry Layton Joel Leonard Mike Litka Jennifer McFarlin Adam Mitchel Alanya Nelson
Whole Body Team Prepared Foods Team Store Team Leader, Payroll Benefit Store Team Leader, In Store Educator,
Leader, Walnut Leader, Fresh Pond Marlton Specialist, Madison Madison Madison
Creek
Chris Pine John Robertson Joe Rogoff Gerre Scherz David Schwartz John Simrell
Vice President Store Team Leader, Vice President, Store Team Leader, Vice President, Director of Finance,
of Real Estate Charlottesville Northern California Wilcrest Midwest Region South Region
Region
Kel-e Sherman Dodi Steiniger Ron Stockman Rocco Terrazano Jeff Teter Michael Thompson
Team Member Director of Whole Body Meat Team Leader, President & General Store Receiver,
Services Director, Operational Finance, Coordinator, Florida Yorkville Manager, Allegro Madison
Midwest Region Southern Pacific Region Region Coffee Company
Robert Thompson Julianne Ugo Bobby Turner Theo Weening Felicia Williams Mark Wilson
Store Team Leader, Team Member Services Bakery Coordinator, Meat Category Customer Service Team Produce Coordinator,
Thousand Oaks Coordinator, Northern Midwest Region Manager, Mid-Atlantic Leader, Rose City Southern Pacific
Pacific Region Region Region
7
10. Our motto—Whole Foods, Whole People, Whole Planet™—emphasizes that our vision reaches far
beyond just food retailing. Through our new Animal Compassion Foundation, we will provide edu-
cation and research services to assist and inspire ranchers and meat producers around the world
to achieve a higher standard of animal welfare excellence while still maintaining economic viability.
We believe the existing paradigm for animal production should change, and we now have the scale
and scope to make a difference. Just as we played an important role in the creation of organic standards,
we will work to raise the bar in treating farm animals with more compassion, and we hope other retail-
ers and animal producers will follow our lead.
8
11. Trading Information
The common stock of Whole
Foods Market is traded on the
Nasdaq Stock Market (symbol:
WFMI). If you wish to become
Corporate and Shareholder Information a shareholder, please contact a
stockbroker.
Dividend Policy
In November 2003, the Board
of Directors declared a quarterly
dividend of $0.15 per share, or
Whole Foods Market
$37 million, to shareholders in
Leadership Team
four quarterly dividends during
the fiscal year. In November
Anthony Gilmore Ron Megahan
Scott Allshouse
2004, the Board of Directors
President President
President
approved a 27% increase in the
Northern California Region Pacific Northwest Region
South Region
quarterly dividend to $0.19 per
Marc Jonna Ken Meyer
Michael Besancon share. The first $0.19 per share
National Wine Buyer President
President quarterly dividend was payable in
Mid-Atlantic Region
Southern Pacific Region January 2005, and the Company
Paula Labian
expects to pay approximately $48
Vice President Juan Nunez
Cindy Bradley
million in dividend payments to
Team Member Services President
Vice President of Learning
shareholders in fiscal year 2005.
Florida Region
Edmund LaMacchia
Patrick Bradley
National Produce Coordinator Will Paradise
President Ordering Financial Statements
President
Midwest Region A copy of our Annual Report or
Roberta Lang
Rocky Mountain Region Form 10-K may be obtained by
Vice President
Mike Clifford
written or phone request to:
General Counsel Walter Robb
Vice President
Co-President
Chief Information Officer
David Lannon Shareholder Services
Chief Operating Officer
President
Mark Dixon Whole Foods Market, Inc.
North Atlantic Region Jim Sud
President 550 Bowie Street
Executive Vice President
Southwest Region Austin, Texas 78703
Cindy McCann
Growth and Business 512.477.5566 ext. 20801
Vice President
Glenda Flanagan
Development
Investor Relations
Executive Vice President
Annual Meeting
Lee Valkenaar
Chief Financial Officer
John Mackey
Executive Vice President April 4, 2005
Chairman of the Board
Betsy Foster
Global Support 9:00 a.m. (EDT)
Chief Executive Officer
Vice President
New York Marriott
Margaret Wittenberg
Purchasing and Distribution
Lee Matecko East Side Hotel
Vice President
Vice President
A.C. Gallo 525 Lexington Avenue
Marketing and Public Affairs
Operational Finance
Co-President New York, New York 10017
Chief Operating Officer
Transfer Agent & Registrar
Information about stock certifi-
Board of Directors
cates, change of address, owner-
ship transfer or other stock
David W. Dupree Gabrielle E. Greene Morris J. Siegel
matters can be obtained from:
Managing Director Chief Financial Officer, Former Vice Chairman
The Halifax Group Villanueva Companies of the Board, The Hain
Securities Transfer Corporation
Celestial Group, Inc.
Dr. John B. Elstrott John Mackey 2591 Dallas Parkway, Suite 102
Director Chairman of the Board and Dr. Ralph Z. Sorenson Frisco, Texas 75034
Levy-Rosenblum Institute Chief Executive Officer Managing Partner, 469.633.0101
for Entrepreneurship, Whole Foods Market, Inc. Sorenson Limited Partnership www.stctransfer.com
Tulane University’s Freeman
Linda A. Mason
School of Business Independent Auditors
Chairman of the Board,
Ernst & Young LLP
Avram J. Goldberg Bright Horizons Family
Austin, Texas
Chairman of the Board Solutions
AVCAR Group, Ltd.
Visit our web site
www.wholefoodsmarket.com
12. Whole Foods Market, Inc.
550 Bowie Street
Austin, Texas 78703
www.wholefoodsmarket.com