Technical analysis of Nepal Stock Exchange (Nepse) index for the week from Mar 09, 2015 to Mar 12, 2015. The technical analysis includes summary, RSI, MACD and Bollinger band analysis. The analysis is done by Kriti Capital & Investments Ltd.
Technical analysis of Nepal Stock Exchange (Nepse) index for the week from Mar 01, 2015 to Mar 04, 2015. The technical analysis includes summary, RSI, MACD and Bollinger band analysis. The analysis is done by Kriti Capital & Investments Ltd.
Technical analysis of Nepal Stock Exchange (Nepse) index for the week from Feb 22, 2015 to Feb 26, 2015. The technical analysis includes summary, RSI, MACD and Bollinger band analysis. The analysis is done by Kriti Capital & Investments Ltd.
Technical analysis of Nepal Stock Exchange (Nepse) index for the week from Jan 11, 2015 to Jan 14, 2015. The technical analysis includes summary, RSI, MACD and Bollinger band analysis. The analysis is done by Kriti Capital & Investments Ltd.
Technical analysis of Nepal Stock Exchange (Nepse) index for the week from Oct 26, 2014 to Oct 30, 2014. The technical analysis includes summary, RSI, MACD and Bollinger band analysis. The analysis is done by Kriti Capital & Investments Ltd.
Technical analysis of Nepal Stock Exchange (Nepse) index for the week from OCt 08, 2014 to Oct 09, 2014. The technical analysis includes summary, RSI, MACD and Bollinger band analysis. The analysis is done by Kriti Capital & Investments Ltd.
Technical analysis of Nepal Stock Exchange (Nepse) index for the week from August 24, 2014 to August 28, 2014. The technical analysis includes summary, RSI, MACD and Bollinger band analysis. The analysis is done by Kriti Capital & Investments Ltd.
Technical analysis of Nepal Stock Exchange (Nepse) index for the week from Jan 04, 2015 to Jan 08, 2015. The technical analysis includes summary, RSI, MACD and Bollinger band analysis. The analysis is done by Kriti Capital & Investments Ltd.
Technical analysis of Nepal Stock Exchange (Nepse) index for the week from August 18, 2014 to August 21, 2014. The technical analysis includes summary, RSI, MACD and Bollinger band analysis. The analysis is done by Kriti Capital & Investments Ltd.
Technical analysis of Nepal Stock Exchange (Nepse) index for the week from September 07, 2014 to September 11, 2014. The technical analysis includes summary, RSI, MACD and Bollinger band analysis. The analysis is done by Kriti Capital & Investments Ltd.
Technical analysis of Nepal Stock Exchange (Nepse) index for the week from Dec 07, 2014 to Dec 11, 2014. The technical analysis includes summary, RSI, MACD and Bollinger band analysis. The analysis is done by Kriti Capital & Investments Ltd.
Technical analysis of Nepal Stock Exchange (Nepse) index for the week form May 25, 2014 to May 28, 2014. The technical analysis includes summary, RSI, MACD and Bollinger band analysis. The analysis is done by Kriti Capital & Investments Ltd.
Technical analysis of Nepal Stock Exchange (Nepse) index for the week from Sep 14, 2014 to Sep 18, 2014. The technical analysis includes summary, RSI, MACD and Bollinger band analysis. The analysis is done by Kriti Capital & Investments Ltd.
Technical analysis of Nepal Stock Exchange (Nepse) index for the week form June 15, 2014 to June 19, 2014. The technical analysis includes summary, RSI, MACD and Bollinger band analysis. The analysis is done by Kriti Capital & Investments Ltd.
Till now, companies used to issue Initial Public Offering (IPO) at par or at premium (upon meeting stringent criteria) in Nepal. Free Pricing method in IPO in Nepalese capital market is a new concept. Mr. Deepesh K Vaidya, Managing Director of Kriti Capital & Investments Ltd (a leading merchant bank in Nepal) presented about this method to the regulator : SEBON and other stakeholders.
The Nepse index lost 8.05 points (or down 0.57%) to close at 1329.41 last week. Nepse lost 2.87% at the beginning of the week. However, it gained back 2.31% towards the end of the week. The index continues to hover below the 200 day and 50 day moving average. However, the index seems to be getting closer towards the 50 day MA. Crossing above the 50 day MA could signal a possible bullish trigger. The average volume turnover decreased to NPR 38.33 crores from NPR 54.82 crores the week prior.
Kriti Capital & Investments Ltd. is seeking application from committed candidates for three month internship program. Application screening shall be strictly based on the stipulated criteria. Only shortlisted candidates will be called for the written exam/interview.
US Economic Outlook - Being Decided - M Capital Group August 2021.pdfpchutichetpong
The U.S. economy is continuing its impressive recovery from the COVID-19 pandemic and not slowing down despite re-occurring bumps. The U.S. savings rate reached its highest ever recorded level at 34% in April 2020 and Americans seem ready to spend. The sectors that had been hurt the most by the pandemic specifically reduced consumer spending, like retail, leisure, hospitality, and travel, are now experiencing massive growth in revenue and job openings.
Could this growth lead to a “Roaring Twenties”? As quickly as the U.S. economy contracted, experiencing a 9.1% drop in economic output relative to the business cycle in Q2 2020, the largest in recorded history, it has rebounded beyond expectations. This surprising growth seems to be fueled by the U.S. government’s aggressive fiscal and monetary policies, and an increase in consumer spending as mobility restrictions are lifted. Unemployment rates between June 2020 and June 2021 decreased by 5.2%, while the demand for labor is increasing, coupled with increasing wages to incentivize Americans to rejoin the labor force. Schools and businesses are expected to fully reopen soon. In parallel, vaccination rates across the country and the world continue to rise, with full vaccination rates of 50% and 14.8% respectively.
However, it is not completely smooth sailing from here. According to M Capital Group, the main risks that threaten the continued growth of the U.S. economy are inflation, unsettled trade relations, and another wave of Covid-19 mutations that could shut down the world again. Have we learned from the past year of COVID-19 and adapted our economy accordingly?
“In order for the U.S. economy to continue growing, whether there is another wave or not, the U.S. needs to focus on diversifying supply chains, supporting business investment, and maintaining consumer spending,” says Grace Feeley, a research analyst at M Capital Group.
While the economic indicators are positive, the risks are coming closer to manifesting and threatening such growth. The new variants spreading throughout the world, Delta, Lambda, and Gamma, are vaccine-resistant and muddy the predictions made about the economy and health of the country. These variants bring back the feeling of uncertainty that has wreaked havoc not only on the stock market but the mindset of people around the world. MCG provides unique insight on how to mitigate these risks to possibly ensure a bright economic future.
what is the best method to sell pi coins in 2024DOT TECH
The best way to sell your pi coins safely is trading with an exchange..but since pi is not launched in any exchange, and second option is through a VERIFIED pi merchant.
Who is a pi merchant?
A pi merchant is someone who buys pi coins from miners and pioneers and resell them to Investors looking forward to hold massive amounts before mainnet launch in 2026.
I will leave the telegram contact of my personal pi merchant to trade pi coins with.
@Pi_vendor_247
Resume
• Real GDP growth slowed down due to problems with access to electricity caused by the destruction of manoeuvrable electricity generation by Russian drones and missiles.
• Exports and imports continued growing due to better logistics through the Ukrainian sea corridor and road. Polish farmers and drivers stopped blocking borders at the end of April.
• In April, both the Tax and Customs Services over-executed the revenue plan. Moreover, the NBU transferred twice the planned profit to the budget.
• The European side approved the Ukraine Plan, which the government adopted to determine indicators for the Ukraine Facility. That approval will allow Ukraine to receive a EUR 1.9 bn loan from the EU in May. At the same time, the EU provided Ukraine with a EUR 1.5 bn loan in April, as the government fulfilled five indicators under the Ukraine Plan.
• The USA has finally approved an aid package for Ukraine, which includes USD 7.8 bn of budget support; however, the conditions and timing of the assistance are still unknown.
• As in March, annual consumer inflation amounted to 3.2% yoy in April.
• At the April monetary policy meeting, the NBU again reduced the key policy rate from 14.5% to 13.5% per annum.
• Over the past four weeks, the hryvnia exchange rate has stabilized in the UAH 39-40 per USD range.
Empowering the Unbanked: The Vital Role of NBFCs in Promoting Financial Inclu...Vighnesh Shashtri
In India, financial inclusion remains a critical challenge, with a significant portion of the population still unbanked. Non-Banking Financial Companies (NBFCs) have emerged as key players in bridging this gap by providing financial services to those often overlooked by traditional banking institutions. This article delves into how NBFCs are fostering financial inclusion and empowering the unbanked.
Turin Startup Ecosystem 2024 - Ricerca sulle Startup e il Sistema dell'Innov...Quotidiano Piemontese
Turin Startup Ecosystem 2024
Una ricerca de il Club degli Investitori, in collaborazione con ToTeM Torino Tech Map e con il supporto della ESCP Business School e di Growth Capital
how can I sell my pi coins for cash in a pi APPDOT TECH
You can't sell your pi coins in the pi network app. because it is not listed yet on any exchange.
The only way you can sell is by trading your pi coins with an investor (a person looking forward to hold massive amounts of pi coins before mainnet launch) .
You don't need to meet the investor directly all the trades are done with a pi vendor/merchant (a person that buys the pi coins from miners and resell it to investors)
I Will leave The telegram contact of my personal pi vendor, if you are finding a legitimate one.
@Pi_vendor_247
#pi network
#pi coins
#money
how can i use my minded pi coins I need some funds.DOT TECH
If you are interested in selling your pi coins, i have a verified pi merchant, who buys pi coins and resell them to exchanges looking forward to hold till mainnet launch.
Because the core team has announced that pi network will not be doing any pre-sale. The only way exchanges like huobi, bitmart and hotbit can get pi is by buying from miners.
Now a merchant stands in between these exchanges and the miners. As a link to make transactions smooth. Because right now in the enclosed mainnet you can't sell pi coins your self. You need the help of a merchant,
i will leave the telegram contact of my personal pi merchant below. 👇 I and my friends has traded more than 3000pi coins with him successfully.
@Pi_vendor_247
If you are looking for a pi coin investor. Then look no further because I have the right one he is a pi vendor (he buy and resell to whales in China). I met him on a crypto conference and ever since I and my friends have sold more than 10k pi coins to him And he bought all and still want more. I will drop his telegram handle below just send him a message.
@Pi_vendor_247
Even tho Pi network is not listed on any exchange yet.
Buying/Selling or investing in pi network coins is highly possible through the help of vendors. You can buy from vendors[ buy directly from the pi network miners and resell it]. I will leave the telegram contact of my personal vendor.
@Pi_vendor_247
how to sell pi coins in South Korea profitably.DOT TECH
Yes. You can sell your pi network coins in South Korea or any other country, by finding a verified pi merchant
What is a verified pi merchant?
Since pi network is not launched yet on any exchange, the only way you can sell pi coins is by selling to a verified pi merchant, and this is because pi network is not launched yet on any exchange and no pre-sale or ico offerings Is done on pi.
Since there is no pre-sale, the only way exchanges can get pi is by buying from miners. So a pi merchant facilitates these transactions by acting as a bridge for both transactions.
How can i find a pi vendor/merchant?
Well for those who haven't traded with a pi merchant or who don't already have one. I will leave the telegram id of my personal pi merchant who i trade pi with.
Tele gram: @Pi_vendor_247
#pi #sell #nigeria #pinetwork #picoins #sellpi #Nigerian #tradepi #pinetworkcoins #sellmypi
NO1 Uk Divorce problem uk all amil baba in karachi,lahore,pakistan talaq ka m...Amil Baba Dawood bangali
Contact with Dawood Bhai Just call on +92322-6382012 and we'll help you. We'll solve all your problems within 12 to 24 hours and with 101% guarantee and with astrology systematic. If you want to take any personal or professional advice then also you can call us on +92322-6382012 , ONLINE LOVE PROBLEM & Other all types of Daily Life Problem's.Then CALL or WHATSAPP us on +92322-6382012 and Get all these problems solutions here by Amil Baba DAWOOD BANGALI
#vashikaranspecialist #astrologer #palmistry #amliyaat #taweez #manpasandshadi #horoscope #spiritual #lovelife #lovespell #marriagespell#aamilbabainpakistan #amilbabainkarachi #powerfullblackmagicspell #kalajadumantarspecialist #realamilbaba #AmilbabainPakistan #astrologerincanada #astrologerindubai #lovespellsmaster #kalajaduspecialist #lovespellsthatwork #aamilbabainlahore#blackmagicformarriage #aamilbaba #kalajadu #kalailam #taweez #wazifaexpert #jadumantar #vashikaranspecialist #astrologer #palmistry #amliyaat #taweez #manpasandshadi #horoscope #spiritual #lovelife #lovespell #marriagespell#aamilbabainpakistan #amilbabainkarachi #powerfullblackmagicspell #kalajadumantarspecialist #realamilbaba #AmilbabainPakistan #astrologerincanada #astrologerindubai #lovespellsmaster #kalajaduspecialist #lovespellsthatwork #aamilbabainlahore #blackmagicforlove #blackmagicformarriage #aamilbaba #kalajadu #kalailam #taweez #wazifaexpert #jadumantar #vashikaranspecialist #astrologer #palmistry #amliyaat #taweez #manpasandshadi #horoscope #spiritual #lovelife #lovespell #marriagespell#aamilbabainpakistan #amilbabainkarachi #powerfullblackmagicspell #kalajadumantarspecialist #realamilbaba #AmilbabainPakistan #astrologerincanada #astrologerindubai #lovespellsmaster #kalajaduspecialist #lovespellsthatwork #aamilbabainlahore #Amilbabainuk #amilbabainspain #amilbabaindubai #Amilbabainnorway #amilbabainkrachi #amilbabainlahore #amilbabaingujranwalan #amilbabainislamabad
Nepse technical analysis mar 09 mar 12, 2015 (eng & nep)
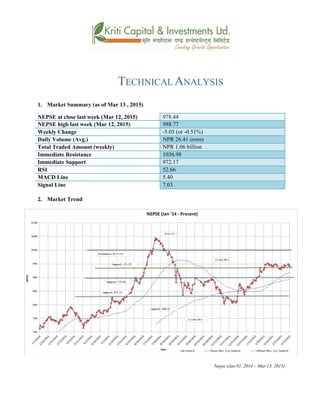
1. TECHNICAL ANALYSIS
1. Market Summary (as of Mar 13 , 2015)
NEPSE at close last week (Mar 12, 2015) 978.44
NEPSE high last week (Mar 12, 2015) 988.77
Weekly Change -5.05 (or -0.51%)
Daily Volume (Avg.) NPR 26.41 crores
Total Traded Amount (weekly) NPR 1.06 billion
Immediate Resistance 1036.98
Immediate Support 972.17
RSI 52.66
MACD Line 5.40
Signal Line 7.03
2. Market Trend
Nepse (Jan 01, 2014 – Mar 13, 2015)
2. 3. RSI
RSI is a form of leading indicator that is believed to be most effective during periods of sideways
movement. Such indicators may create numerous buy and sell signals that are useful when the market
is not clearly trending upwards or downwards. The RSI made a gradual descend this week, but still
maintaining within the neutral zone. RSI, at the beginning of the week, was 62.39 levels. However, by
the close of the trading week, the RSI went down to 52.66 levels.
RSI (Jan 01, 2014 – Mar 13, 2015)
4. MACD
The MACD is a momentum oscillator formed by using two different types of moving averages, which
provides specific buying or selling signals. When a MACD line crosses above the signal line, it is
considered to be a positive sign and indicates a time to buy, and vice-versa. The MACD line was
below the Signal line throughout the week, and it continued the downward momentum by the end of
this week as well. However, by the end of the trading week, MACD seems to be touching the signal
line. If the MACD makes a crossover above the signal line, it indicates a buy signal in the market.
MACD (Jan 01, 2014 – Mar 13, 2015)
5. Bollinger Bands
The Bollinger Band is a technical indicator that consists of a moving average (21-day) along with two
trading bands above (upper band) and below it (lower band). The bands are an indication of volatility,
which are represented by calculating standard deviation. The NEPSE index had crossed above the mid-
band this week, and moved closer towards the upper-band. However, by the end of this week, it made
a slight fall back at the mid-band. The upper and the lower bands continue to converge indicating a
decreasing volatility in the market.
3. Bollinger Bands (Jan 01, 2014 – Mar 13, 2015)
Overview:
NEPSE ended on a negative note this week as it closed lower by -5.62 points (or -0.57%) to end at
978.44 points. Nepse decreased throughout the week, closing lower than the week’s average of 983.93.
The average daily market volume increased this week to NRP 26.41 crores from NRP 23.06 crores the
week prior. The 50-day moving average is still increasing at a higher rate above the 200-day moving
average suggesting that the overall view of the market remains positive. The RSI decreased throughout
the week to end at 52.66 levels, and still maintained within the neutral zone. The MACD line is
moving close with the signal line. However, if this line crosses above the signal line, this would
indicate a buy trigger. The Bollinger Bands indicate a decline in the market volatility as Nepse moved
back towards the mid-band by the end of this week. Nepse still has not been able to move below its
support level of 972.17 points for the past five weeks. If Nepse falls below this support level with
increasing volume, the next closest support level stands at 938.41 points.