Downloaded 265 times


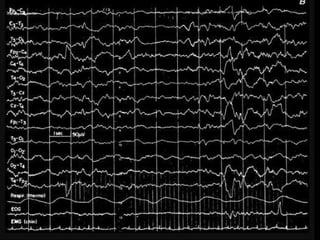
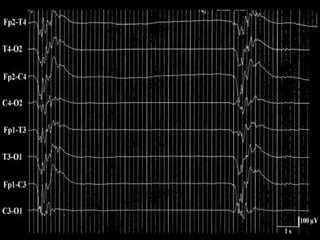
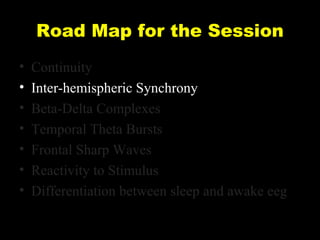
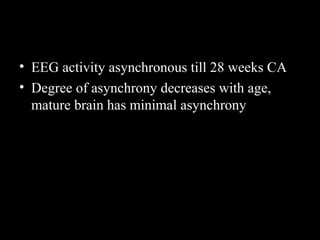


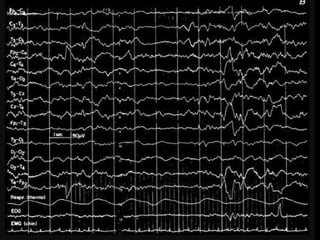

The document outlines the development of neonatal EEG patterns, detailing the transition from discontinuous to continuous activity as gestational age increases. Key features include the appearance of beta-delta complexes, temporal theta bursts, and frontal sharp waves, along with the reactivity to stimuli. The EEG maturation is described in terms of synchrony, voltage amplitude, and frequency patterns at various gestational and postnatal ages.


![Hypothalamus short ppt by Dr. Neha [PT].pptx](https://cdn.slidesharecdn.com/ss_thumbnails/hypothalamusbydr-260124145759-b9f94a93-thumbnail.jpg?width=640&height=640&fit=bounds)


