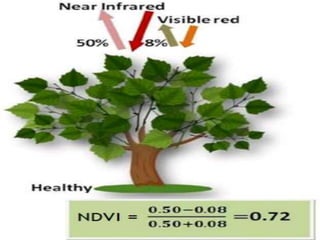
Aihtesham Jadoon
Course: GIS and Remote Sensing
Topic:
Normalized Difference Vegetation
Index NDVI
Normalized Difference Vegetation
Index
• NDVI is a numerical indicator that uses the
visible and near-infrared bands of the
electromagnetic spectrum, and is adopted to
analyze remote sensing measurements and
assess whether the target being observed
contains live green vegetation or not.
NDVI Determine
• To determine the density of greenness on a
patch of land, researchers must observe the
distinct colors (wavelengths) of visible and
near-infrared sunlight reflected by the plants.
• As can be seen through a prism, many
different wavelengths make up the spectrum
of sunlight.
• The pigment in plant leaves, chlorophyll, strongly
absorbs visible light (from 0.4 to 0.7 µm) for use in
photosynthesis.
NDVI is calculation
• NDVI is calculated from the visible and near-infrared light
reflected by vegetation. Healthy vegetation (left) absorbs
most of the visible light that hits it, and reflects a large
portion of the near-infrared light.
• Unhealthy or sparse vegetation (right) reflects more visible
light and less near-infrared light.
• Nearly all satellite Vegetation Indices employ this difference
formula to quantify the density of plant growth on the
Earth — near-infrared radiation minus visible radiation
divided by near-infrared radiation plus visible radiation.
NDVI is calculation
• The result of this formula is called the Normalized
Difference Vegetation Index (NDVI). Written
mathematically, the formula is: NDVI = (NIR —
VIS)/(NIR + VIS)
• Calculations of NDVI for a given pixel always result in a
number that ranges from minus one (-1) to plus one
(+1); however, no green leaves give a value close to
zero.
• A zero means no vegetation and close to +1 (0.8 - 0.9)
indicates the highest possible density of green leaves
Ndvi

Ndvi

  • 1.
    Aihtesham Jadoon Course: GISand Remote Sensing Topic: Normalized Difference Vegetation Index NDVI
  • 2.
    Normalized Difference Vegetation Index •NDVI is a numerical indicator that uses the visible and near-infrared bands of the electromagnetic spectrum, and is adopted to analyze remote sensing measurements and assess whether the target being observed contains live green vegetation or not.
  • 4.
    NDVI Determine • Todetermine the density of greenness on a patch of land, researchers must observe the distinct colors (wavelengths) of visible and near-infrared sunlight reflected by the plants. • As can be seen through a prism, many different wavelengths make up the spectrum of sunlight. • The pigment in plant leaves, chlorophyll, strongly absorbs visible light (from 0.4 to 0.7 µm) for use in photosynthesis.
  • 6.
    NDVI is calculation •NDVI is calculated from the visible and near-infrared light reflected by vegetation. Healthy vegetation (left) absorbs most of the visible light that hits it, and reflects a large portion of the near-infrared light. • Unhealthy or sparse vegetation (right) reflects more visible light and less near-infrared light. • Nearly all satellite Vegetation Indices employ this difference formula to quantify the density of plant growth on the Earth — near-infrared radiation minus visible radiation divided by near-infrared radiation plus visible radiation.
  • 7.
    NDVI is calculation •The result of this formula is called the Normalized Difference Vegetation Index (NDVI). Written mathematically, the formula is: NDVI = (NIR — VIS)/(NIR + VIS) • Calculations of NDVI for a given pixel always result in a number that ranges from minus one (-1) to plus one (+1); however, no green leaves give a value close to zero. • A zero means no vegetation and close to +1 (0.8 - 0.9) indicates the highest possible density of green leaves