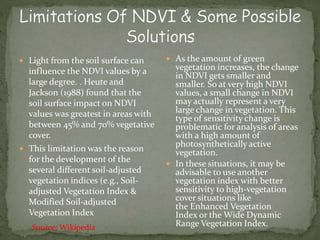
Based on source of
energy
 Passive; source of energy
is either Sun or
Earth/Atmosphere.
 Active; source of energy
is Remote Sensor
system(RADAR).
 Example, Camera takes
photo With or Without
flash.
 Optical; operate in the visible,
near infrared, middle infrared
and short wave infrared portion.
 Thermal; operate in thermal
range of electromagnetic
spectrum record, the energy
emitted from the earth features.
 Microwave; records the
backscattered microwaves and
are independent of weather and
solar radiations.
Based on range of EMS
Source; Google
Normalised Difference
Vegetation Index
 The Normalized Difference Vegetation Index (NDVI) is a
numerical indicator that uses the visible and near-infrared bands
of the electromagnetic spectrum, and is adopted to analyze
remote sensing measurements and assess whether the target
being observed contains live green vegetation or not
 When sunlight strikes objects, certain wavelengths of this
spectrum are absorbed and other wavelengths are reflected. The
pigment in plant leaves, chlorophyll, strongly absorbs visible
light (from 0.4 to 0.7 µm) for use in photosynthesis. The cell
structure of the leaves, on the other hand, strongly reflects near-
infrared light (from 0.7 to 1.1 µm). The more leaves a plant has,
the more these wavelengths of light are affected, respectively.
Source: Earth Observatory
 Vegetation appears very different at visible and near-infrared
wavelengths. In visible light (top), vegetated areas are very dark, almost
black, while desert regions (like the Sahara) are light. At near-infrared
wavelengths, the vegetation is brighter and deserts are about the same.
By comparing visible and infrared light, scientists measure the relative
amount of vegetation. (The variation in shade is more apparent in the
detail of the U.S. West Coast).
Source: Earth Observatory
 As the amount of green
vegetation increases, the change
in NDVI gets smaller and
smaller. So at very high NDVI
values, a small change in NDVI
may actually represent a very
large change in vegetation. This
type of sensitivity change is
problematic for analysis of areas
with a high amount of
photosynthetically active
vegetation.
 In these situations, it may be
advisable to use another
vegetation index with better
sensitivity to high-vegetation
cover situations like
the Enhanced Vegetation
Index or the Wide Dynamic
Range Vegetation Index.
 Light from the soil surface can
influence the NDVI values by a
large degree. . Heute and
Jackson (1988) found that the
soil surface impact on NDVI
values was greatest in areas with
between 45% and 70% vegetative
cover.
 This limitation was the reason
for the development of the
several different soil-adjusted
vegetation indices (e.g., Soil-
adjusted Vegetation Index &
Modified Soil-adjusted
Vegetation Index
Source; Wikipedia
Presentation1

Presentation1

  • 3.
    Based on sourceof energy  Passive; source of energy is either Sun or Earth/Atmosphere.  Active; source of energy is Remote Sensor system(RADAR).  Example, Camera takes photo With or Without flash.  Optical; operate in the visible, near infrared, middle infrared and short wave infrared portion.  Thermal; operate in thermal range of electromagnetic spectrum record, the energy emitted from the earth features.  Microwave; records the backscattered microwaves and are independent of weather and solar radiations. Based on range of EMS Source; Google
  • 5.
  • 6.
     The NormalizedDifference Vegetation Index (NDVI) is a numerical indicator that uses the visible and near-infrared bands of the electromagnetic spectrum, and is adopted to analyze remote sensing measurements and assess whether the target being observed contains live green vegetation or not  When sunlight strikes objects, certain wavelengths of this spectrum are absorbed and other wavelengths are reflected. The pigment in plant leaves, chlorophyll, strongly absorbs visible light (from 0.4 to 0.7 µm) for use in photosynthesis. The cell structure of the leaves, on the other hand, strongly reflects near- infrared light (from 0.7 to 1.1 µm). The more leaves a plant has, the more these wavelengths of light are affected, respectively. Source: Earth Observatory
  • 7.
     Vegetation appearsvery different at visible and near-infrared wavelengths. In visible light (top), vegetated areas are very dark, almost black, while desert regions (like the Sahara) are light. At near-infrared wavelengths, the vegetation is brighter and deserts are about the same. By comparing visible and infrared light, scientists measure the relative amount of vegetation. (The variation in shade is more apparent in the detail of the U.S. West Coast). Source: Earth Observatory
  • 9.
     As theamount of green vegetation increases, the change in NDVI gets smaller and smaller. So at very high NDVI values, a small change in NDVI may actually represent a very large change in vegetation. This type of sensitivity change is problematic for analysis of areas with a high amount of photosynthetically active vegetation.  In these situations, it may be advisable to use another vegetation index with better sensitivity to high-vegetation cover situations like the Enhanced Vegetation Index or the Wide Dynamic Range Vegetation Index.  Light from the soil surface can influence the NDVI values by a large degree. . Heute and Jackson (1988) found that the soil surface impact on NDVI values was greatest in areas with between 45% and 70% vegetative cover.  This limitation was the reason for the development of the several different soil-adjusted vegetation indices (e.g., Soil- adjusted Vegetation Index & Modified Soil-adjusted Vegetation Index Source; Wikipedia