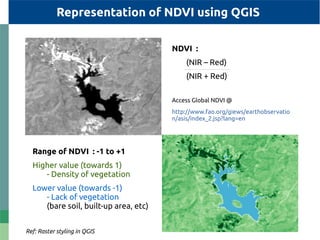
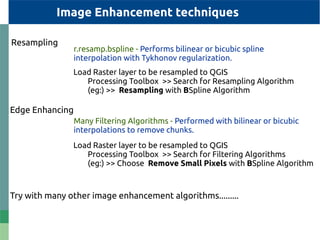
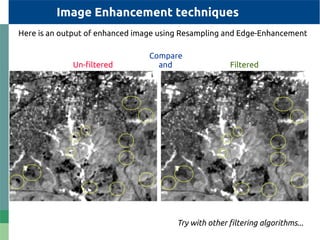
Normalized Differentiate Vegetative Index
Bands Wavelength
(micrometers)
Resolution
(meters)
B1 - Ultra Blue 0.435 - 0.451 30
B2 - Blue 0.452 - 0.512 30
B3 - Green 0.533 - 0.590 30
B4 - Red 0.636 - 0.673 30
B5 - NIR 0.851 - 0.879 30
B6 – SWIR 1 1.566 - 1.651 30
B7 - SWIR 2 2.107 - 2.294 30
B8 - Pan 0.503 - 0.676 15
B9 - Cirrus 1.363 - 1.384 30
B10 - TIRS 1 10.60 - 11.19 100 * (30)
B11 - TIRS 2 11.50 - 12.51 100 * (30)
Band Specifications of Landsat - 8
EMR -Vs- Spatial Object
Credits : https://www.sciencedirect.com/science/article/pii/S1110982317300327
Bands correspond to Vegetation
Credits : https://landsat.usgs.gov/atmospheric-transmittance-information
http://gsp.humboldt.edu/OLM/Courses/GSP_216_Online/lesson2-1/vegetation.html
Bands correspond to Vegetation
Credits : https://earthobservatory.nasa.gov/Features/MeasuringVegetation/measuring_vegetation_2.php
If there is much more
reflected light in
Near-infrared wavelengths
than in visible wavelengths,
then the vegetation in that
pixel is likely to be dense
- EarthObservatory, NASA
Normalized Differentiate Vegetation Index
Vegetation - NDVI
NDVI
Credits : https://en.wikipedia.org/wiki/Normalized_difference_vegetation_index
Red
InfraRed
NDVI result
Computing NDVI using QGIS
Load raster layers representing
Red and Infrared bands in QGIS
Computing NDVI using QGIS
Go to main menu
>> Choose Raster
>> Raster Calculator
Output
Formula
Input
Representation of NDVI using QGIS
Range of NDVI : -1 to +1
Higher value (towards 1)
- Density of vegetation
Lower value (towards -1)
- Lack of vegetation
(bare soil, built-up area, etc)
NDVI :
(NIR – Red)
(NIR + Red)
Access Global NDVI @
http://www.fao.org/giews/earthobservatio
n/asis/index_2.jsp?lang=en
Ref: Raster styling in QGIS
Resampling
Load Raster layer to be resampled to QGIS
Processing Toolbox >> Search for Resampling Algorithm
(eg:) >> Resampling with BSpline Algorithm
r.resamp.bspline - Performs bilinear or bicubic spline
interpolation with Tykhonov regularization.
Image Enhancement techniques
Edge Enhancing
Load Raster layer to be resampled to QGIS
Processing Toolbox >> Search for Filtering Algorithms
(eg:) >> Choose Remove Small Pixels with BSpline Algorithm
Many Filtering Algorithms - Performed with bilinear or bicubic
interpolations to remove chunks.
Try with many other image enhancement algorithms.........
Try with other filtering algorithms...
Compare
Un-filtered and Filtered
Image Enhancement techniques
Here is an output of enhanced image using Resampling and Edge-Enhancement

How to calculate NDVI using QGIS

  • 1.
  • 2.
    Bands Wavelength (micrometers) Resolution (meters) B1 -Ultra Blue 0.435 - 0.451 30 B2 - Blue 0.452 - 0.512 30 B3 - Green 0.533 - 0.590 30 B4 - Red 0.636 - 0.673 30 B5 - NIR 0.851 - 0.879 30 B6 – SWIR 1 1.566 - 1.651 30 B7 - SWIR 2 2.107 - 2.294 30 B8 - Pan 0.503 - 0.676 15 B9 - Cirrus 1.363 - 1.384 30 B10 - TIRS 1 10.60 - 11.19 100 * (30) B11 - TIRS 2 11.50 - 12.51 100 * (30) Band Specifications of Landsat - 8
  • 3.
    EMR -Vs- SpatialObject Credits : https://www.sciencedirect.com/science/article/pii/S1110982317300327
  • 4.
    Bands correspond toVegetation Credits : https://landsat.usgs.gov/atmospheric-transmittance-information http://gsp.humboldt.edu/OLM/Courses/GSP_216_Online/lesson2-1/vegetation.html
  • 5.
    Bands correspond toVegetation Credits : https://earthobservatory.nasa.gov/Features/MeasuringVegetation/measuring_vegetation_2.php If there is much more reflected light in Near-infrared wavelengths than in visible wavelengths, then the vegetation in that pixel is likely to be dense - EarthObservatory, NASA
  • 6.
    Normalized Differentiate VegetationIndex Vegetation - NDVI NDVI Credits : https://en.wikipedia.org/wiki/Normalized_difference_vegetation_index Red InfraRed NDVI result
  • 7.
    Computing NDVI usingQGIS Load raster layers representing Red and Infrared bands in QGIS
  • 8.
    Computing NDVI usingQGIS Go to main menu >> Choose Raster >> Raster Calculator Output Formula Input
  • 9.
    Representation of NDVIusing QGIS Range of NDVI : -1 to +1 Higher value (towards 1) - Density of vegetation Lower value (towards -1) - Lack of vegetation (bare soil, built-up area, etc) NDVI : (NIR – Red) (NIR + Red) Access Global NDVI @ http://www.fao.org/giews/earthobservatio n/asis/index_2.jsp?lang=en Ref: Raster styling in QGIS
  • 10.
    Resampling Load Raster layerto be resampled to QGIS Processing Toolbox >> Search for Resampling Algorithm (eg:) >> Resampling with BSpline Algorithm r.resamp.bspline - Performs bilinear or bicubic spline interpolation with Tykhonov regularization. Image Enhancement techniques Edge Enhancing Load Raster layer to be resampled to QGIS Processing Toolbox >> Search for Filtering Algorithms (eg:) >> Choose Remove Small Pixels with BSpline Algorithm Many Filtering Algorithms - Performed with bilinear or bicubic interpolations to remove chunks. Try with many other image enhancement algorithms.........
  • 11.
    Try with otherfiltering algorithms... Compare Un-filtered and Filtered Image Enhancement techniques Here is an output of enhanced image using Resampling and Edge-Enhancement