Downloaded 121 times


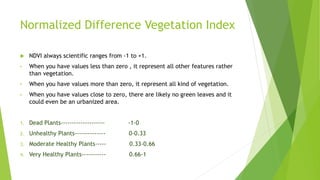


The document defines and explains the Normalized Difference Vegetation Index (NDVI). It discusses how NDVI is calculated using near-infrared and red light reflectance values. NDVI values range from -1 to 1, with higher positive values indicating more dense, healthy vegetation. The document also outlines several applications of NDVI in fields like agriculture, forestry, and drought monitoring.


![[DSC Europe 22] Crop type clustering using NDVI - Bright Aboh](https://cdn.slidesharecdn.com/ss_thumbnails/brightabohcroptypeclusteringusingndvi-221129232348-1e881098-thumbnail.jpg?width=640&height=640&fit=bounds)


