
Recommended
More Related Content
What's hot
What's hot (20)
Viewers also liked
Viewers also liked (20)
Similar to Market Research Insights
Similar to Market Research Insights (20)
More from Jackwrightt1894
Market Research Insights
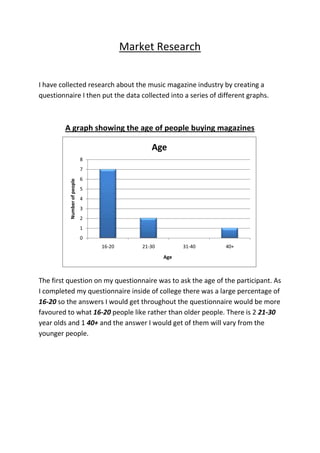
- 1. Market Research I have collected research about the music magazine industry by creating a questionnaire I then put the data collected into a series of different graphs. A graph showing the age of people buying magazines Age 8 7 6 Number of people 5 4 3 2 1 0 16-20 21-30 31-40 40+ Age The first question on my questionnaire was to ask the age of the participant. As I completed my questionnaire inside of college there was a large percentage of 16-20 so the answers I would get throughout the questionnaire would be more favoured to what 16-20 people like rather than older people. There is 2 21-30 year olds and 1 40+ and the answer I would get of them will vary from the younger people.
- 2. A graph showing the Gender of the people surveyed Gender Male Female This graph shows the gender of the people surveyed. The graph shows that there are a larger percentage of males than females who completed the questionnaire. This means that the answer I would receive will be more male orientated than female orientated. This will have an impact of the music genre liked and the magazines which have been bought and read A graph showing the employment of the participants Occupation Unemployed Employment Employed 0 1 2 3 4 5 6 7 Number of people This graph shows the number of people who are employed who I surveyed and the number of people who are currently unemployed. This will affect the
- 3. answer I will receive on if they buy music magazines and the price they will pay due to some not having the funds to spend on a music magazine. Number of people who attended a concert in the last year Concerts attended in last year 9 8 7 6 5 4 3 2 1 0 Yes No I asked this question so I could get an idea of how many people enjoy music and are willing to attend a concert of their favourite artist or group. This showed me that a large percentage had attended a concert and contrasts with the fact only 5 people had never read a music magazine. This shows that although a lot of people enjoy music and have an interest in it they don’t however want to buy music magazines and don’t see it as a way of enhancing their music experience
- 4. The magazines which have been read or bought by participants Magazines read or Bought 6 5 4 3 2 1 0 Q Kerrang! Rolling NME VIBE other None stone This shows that there is some interest in music magazines and half of the people have bought or read one before but still half have not bought or ever read a music magazine, compared to the fact 8 people have been a concert in the last year alone shows there isn’t a big interest in buying music magazines as there is in going seeing an artist you like.
- 5. The music genre that participants listen too Genre of Music Pop 16% Rock 25% Rap Classical 12% RnB 3% Country 6% House 19% Indie 16% 3% This pie chart shows the genres of music and what percentage is the most popular, this gives an idea to which music is listened to more and what a magazine should be aimed at. These results are going to be more biased towards younger people as a large percentage of the people questioned were under 21. ‘Rock’ which has been a major genre for years isn’t popular with younger people anymore. Also ‘classical’ and ‘country’ dont bring an interest in. ‘Indie’ which used to be a small genre has grown dramatically and holds 16% of the market along with the usual ‘rap’, ‘RnB’ and ‘pop’ Another growing genre of music with younger people is ‘house’ which has grown in the last 5 years.
- 6. The price that people are willing to pay for a music magazine Magazine Cost £4+ £3-£4 £2-£3 £1-£2 0 1 2 3 4 5 6 This Graph shows the price people are willing to pay to buy a music magazine. The graph stats that people are will to pay up to £3 for a magazine and this is what over 50% of the people think. Only 20% are willing to pay over £3 for a music magazine with this being split into £3-£4 and £4+ .This graph will be affected by how interested the people are in music magazines with the ones with the least interest only willing to pay a small amount of cash.
- 7. The way people download their music Downloads Itunes Spotify Downloads(other) CDs Vinyl 4% 23% 32% 23% 18% This Pie chart gives the different ways people download their music. Its shows thatiTunesis the favourite and that most people choose to use that because it goes with their apple phones and iPods, iPads and laptops. Second is CDs which has decreased hugely since downloads have become available but it still show people buy CDs maybe for older people and to use in cars and stereos. Also older people don’t know how to use iTunes so prefer to buyCDsThirdly is Downloads (other) which classes small time downloading like tubidy and also illegal downloading such as YouTube converter. This is a growing market as Apple products begin to be matched by other big name companies’ device such as Samsung. Spotify is second to last with 18%.Spotifyis also a growing downloads site. Vinyl’shas a 4% share. Vinyl’sare hardly used anymore and people usually buy them for sentimental value rather than for use.