1. REPORT
I have created a report with information I have collected from peers in my
college to see what kind of music magazines people buy.
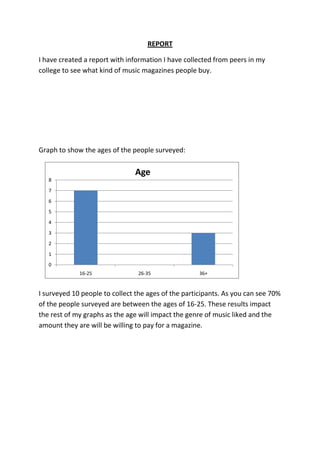
Graph to show the ages of the people surveyed:
Age
8
7
6
5
4
3
2
1
0
16-25 26-35 36+
I surveyed 10 people to collect the ages of the participants. As you can see 70%
of the people surveyed are between the ages of 16-25. These results impact
the rest of my graphs as the age will impact the genre of music liked and the
amount they are will be willing to pay for a magazine.
2. Graph to show the sex of the people surveyed:
Gender
Male
Female
I surveyed 10 people to college the sex of the participants. As you can see 7
participants are male and 3 are female. These results will impact the genre of
music liked by the people surveyed and may impact on the results on the
colours preferred on a magazines.
3. Graph to show the occupation of the people surveyed:
6
Occupation
5
4
3
2
1
0
Employed Unemployed
This graph shows if the people surveyed are employed or unemployed. The
results show that 50% is employed and 50% isn’t. These results will impact on
the price that the participants are willing to pay due to their budget. If they are
employed then they are probably willing to spend more on a magazine as it is a
luxury and not a necessity and the unemployed may not be able to afford the
top end price of this luxury.
4. Graph to show the genre of music liked by the people surveyed:
Genre of Music
7
6
5
4
3
2
1
0
Pop House Classical RnB Country Indie
This graph shows the genre of music preferred by the participants. The most
popular are house and RnB, this could be due to the ages of the people
surveyed, as most of the people surveyed were between the ages of 16-25
these genres were likely to be popular as they are the upcoming music genres
and stereotypically this is the music teenagers listen to. Country and Indie
were the least popular results, this could be because it is not the sort of music
people in this country listen to and is also music older people listen to.
5. Graph to show if the people surveyed read magazines or not:
Yes
No
This graph shows whether people read magazines or not. The results show that
50% read magazines and 50% don’t. This indicates that although most of the
people surveyed are young only half read magazines which shows they aren’t
very popular. This will impact in the price somebody would pay for a magazine
as if they hardly ever read one they aren’t going to buy one for £5 or more.
6. Graph to show the best colour of magazines by the people surveyed:
6
5
4
3
2
1
0
Red White Yellow Black Green Blue Grey Orange Other
This graph shows the colours preferred on a magazine by the people surveyed.
We can see that black and grey are the most popular colours. This links with
the sex of people surveyed, as 70% of the people were male it shows a link
with the popular colours as black and grey are masculine colours. Every colour
has been chosen by the participants which suggests there is a wide range of
choice in the shops as people are buying different coloured magazines.
7. Graph to show how much the people surveyed would pay for a music
magazine:
7
6
5
4
3
2
1
0
£1 or less £1-£3 £3-£5 £5 or more
This graph shows the prices the people surveyed would pay for a magazine.
Surprisingly a high percentage of the people were willing to pay £5 or more.
This could mean prices of magazines or high or could also mean when people
are buying magazines they want to spend a lot on them to make sure they are
good quality and worth reading through. Only 1 person said they would pay £1
or less for a magazine. This indicates that people think if they pay little money
for a magazine that it won’t be good to read of the information inside will be
poor.
8. Graph to show if people buy CD’s or download?
Buy CD's
Download
This graph shows the amount of people that buy CD’s or download music. The
results are as expected as over half of the people said they download. This is
mainly due to the age of people surveyed as downloading is something the
younger generation has grew up with so are more likely to do. This could also
be to do with whether the participant is employed or not. If they are not
employed then they are more likely to download music as it is a lot cheaper.
Overall my results have suggested that the younger generation will spend a lot
of money on magazines to get the latest news and the best quality. This then
surprises me when more people are downloading instead of buying CD’s as
downloading is cheaper and the quality isn’t as good as buying CD’s. One of the
reasons maybe due to having an alternative of CD’s. In the case of magazines
there isn’t as many alternatives so the only option is to buy them.