The document discusses key concepts in multivariate analysis including:
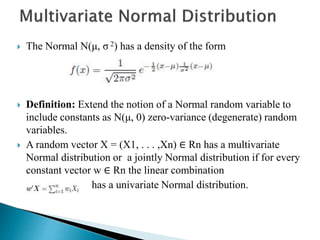
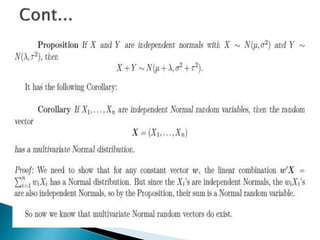
1) The multivariate normal distribution plays a fundamental role as both a population model and approximate sampling distribution for many statistics.
2) Multivariate distributions are determined by their mean vectors and covariance matrices.
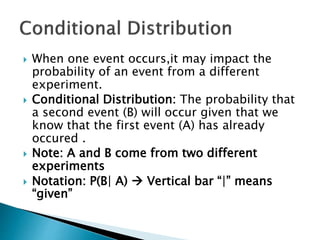
3) Multivariate analysis involves measuring and analyzing dependence between variables and sets of variables.
4) Many real-world problems fall within the framework of multivariate normal theory.