The document discusses the fundamentals of color science in multimedia, covering aspects such as light, human vision, camera systems, and various color models like RGB, CMY, and YUV. It explains how colors are perceived and represented, including gamma correction and color-matching functions, along with the transformation processes needed for accurate color reproduction in images and videos. Additionally, it highlights concepts like out-of-gamut colors and different color-coordinate schemes used in digital media and printing.


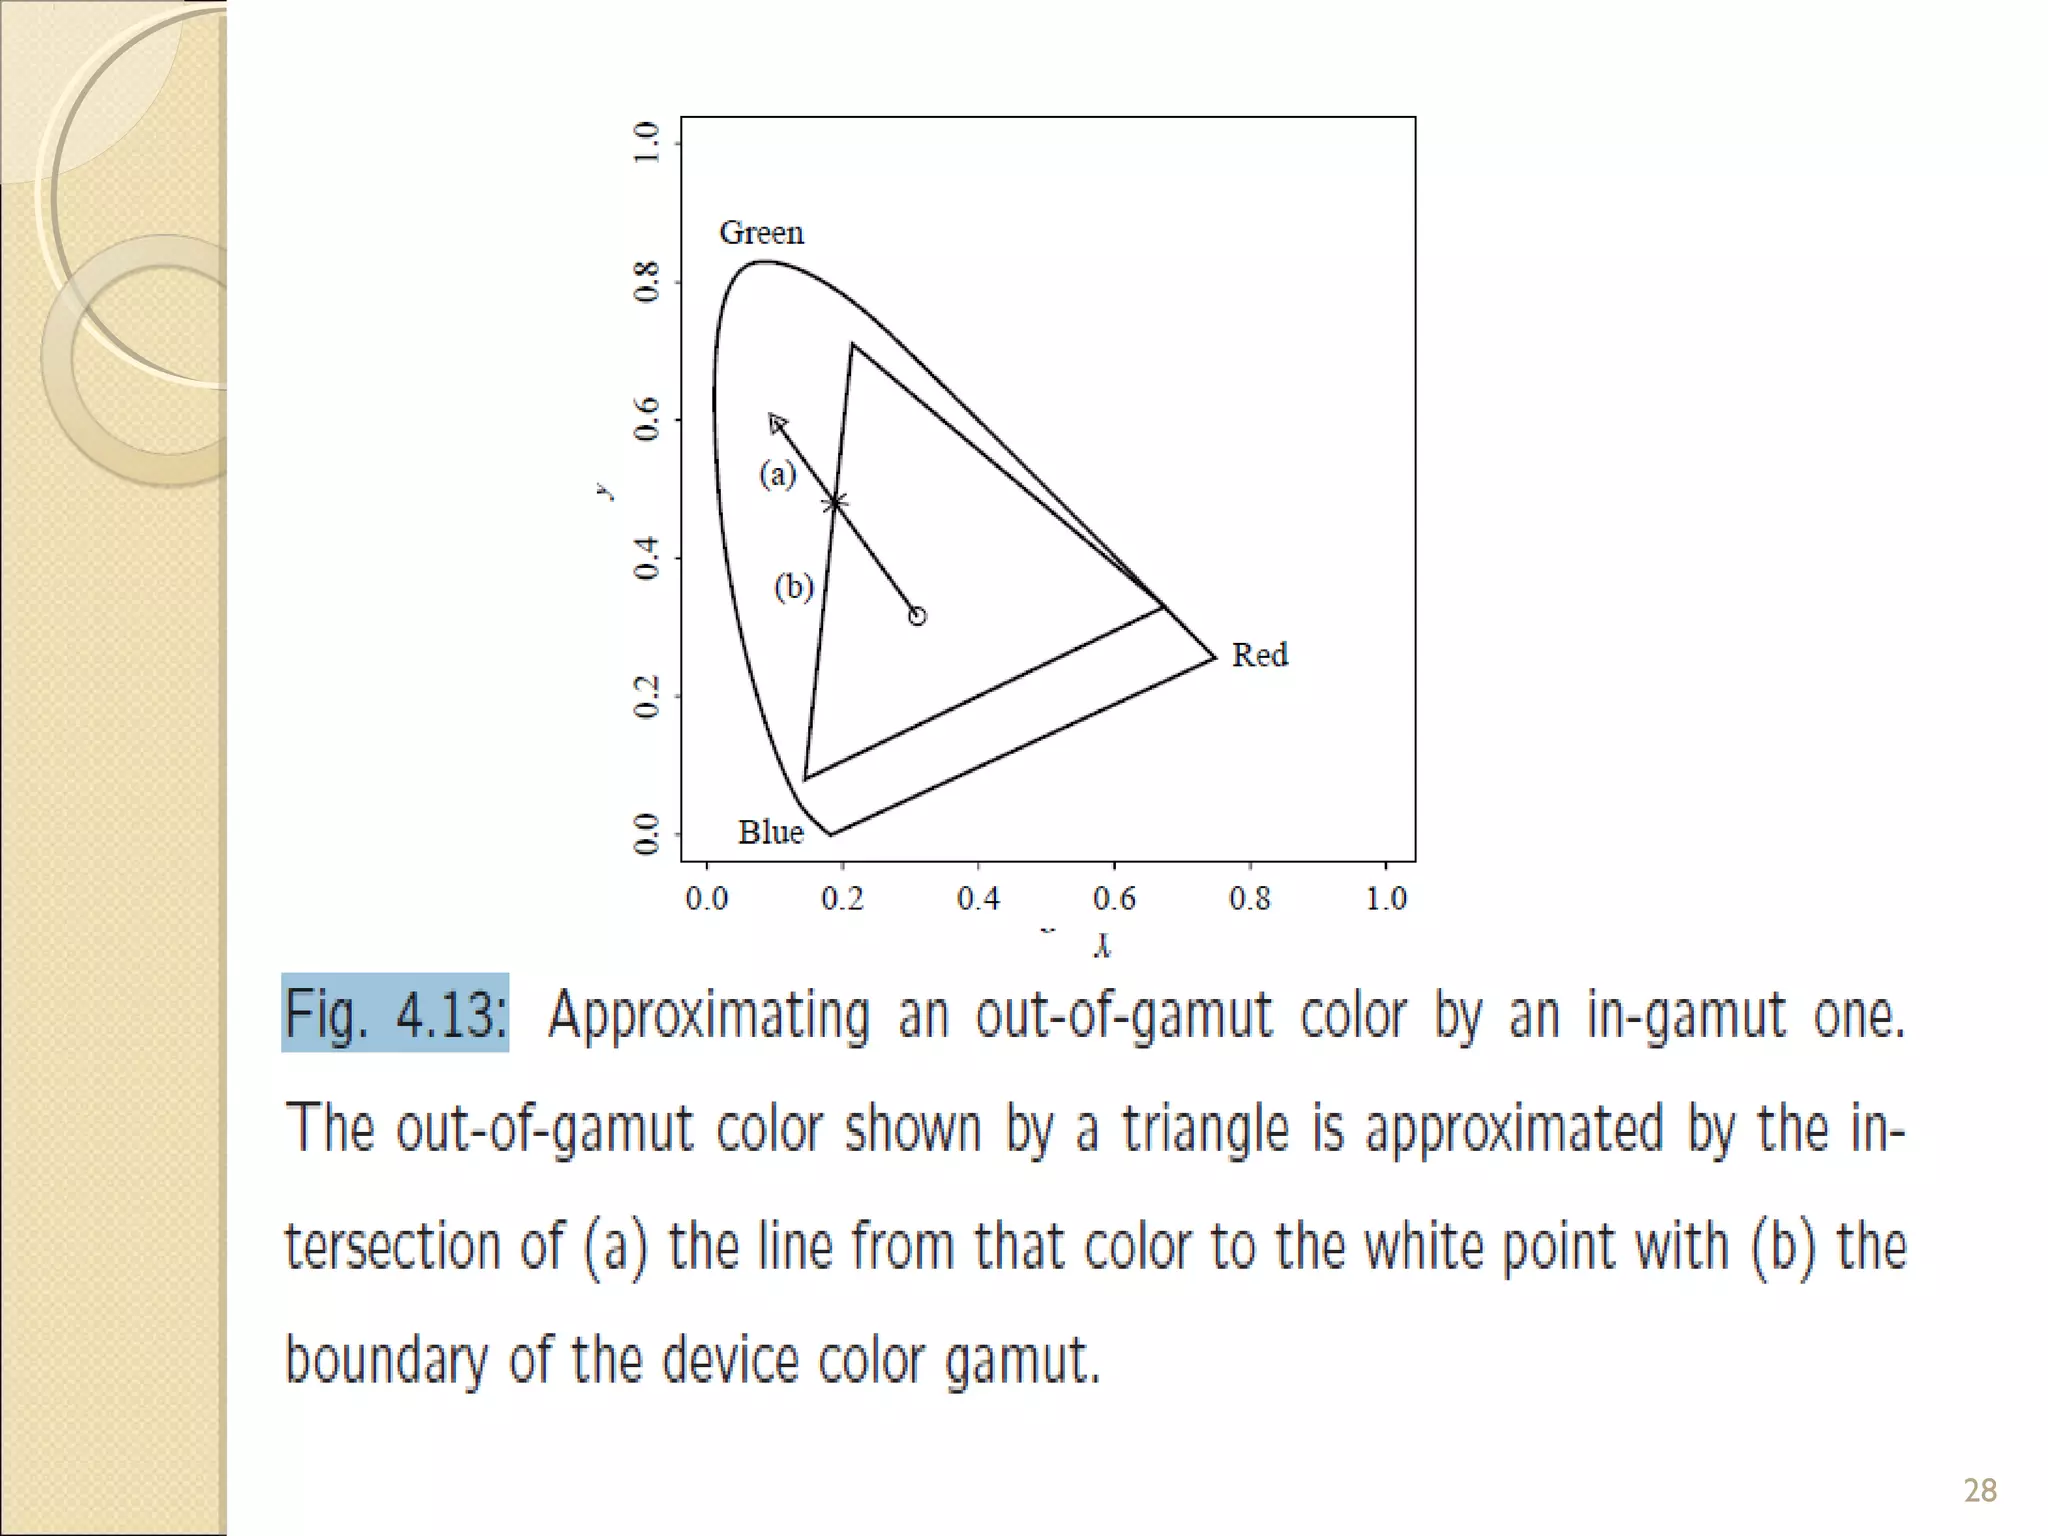
![Out –of –Gamut colorsOut –of –Gamut colors
If (x y) [color without magnitude] is specified, instead of
derived as above, we have to invert the matrix of
phosphor (x, y, z) values to obtain RGB.
What do we do if any of the RGB numbers is negative?
that color, visible to humans, is out-of-gamut for our
display.
1. One method: simply use the closest in-gamut color
available, as in Fig. 4.13.
2. Another approach: select the closest complementary
color.
27](https://image.slidesharecdn.com/multimediacolorinimageandvideo-170929142359/75/Multimedia-color-in-image-and-video-27-2048.jpg)


![ (d) In practice, however, Recommendation 601 species 8-
bit coding, with a maximum Y ' value of only 219, and a
minimum of +16. Cb and Cr have a range of -+112 and
offset of +128. If R', G', B‘ are floats in [0..+ 1], then we
obtain Y ', Cb, C rin [0.. 255] via the transform:
52](https://image.slidesharecdn.com/multimediacolorinimageandvideo-170929142359/75/Multimedia-color-in-image-and-video-52-2048.jpg)