This document discusses color in images and video. It begins with an overview of color science, including how light is characterized by wavelength and how the human eye perceives color. It then covers color models used in images and video, and explores color models further. The document details how color is formed in images based on the illumination, surface reflectance, and the eye's response. It also discusses color models used in camera systems and issues like gamma correction. The document provides an in-depth explanation of color matching functions and the CIE chromaticity diagram. It concludes with discussions of color monitor specifications and how to handle out-of-gamut colors.
![Fig 4 6(a) shows light output with no• Fig. 4.6(a) shows light output with no
gamma-correction applied.We see that
darker values are displayed too dark.This
is also shown in Fig. 4.7(a), which displaysg ( ) p y
a linear ramp from left to right.
• Fig 4 6(b) shows the effect of pre• Fig. 4.6(b) shows the effect of pre-
correcting signals by applying the power
l R1/γ i i lilaw R1/γ; it is customary to normalize
voltage to the range [0,1].
17
Fi 4 6 ( ) Eff t f CRT li ht itt d f ( lt i li dFig. 4.6: (a): Effect of CRT on light emitted from screen (voltage is normalized
to range 0..1). (b): Gamma correction of signal.
18
The combined effect is shown in Fig. 4.7(b). Here, aThe combined effect is shown in Fig. 4.7(b). Here, a
ramp is shown in 16 steps from gray-level 0 to gray-
level 255.
19
Fig. 4.7: (a): Display of ramp from 0 to 255, with no gamma correction. (b):
Image with gamma correction applied
A f l d f f• A more careful definition of gamma recognizes
that a simple power law would result in an infinite
derivative at zero voltage makes constructing aderivative at zero voltage — makes constructing a
circuit to accomplish gamma correction difficult to
devise in analog.g
20
This is called a camera transfer function, Standard SMPTE-170M](https://image.slidesharecdn.com/unitimmchap4colorinimageandvideo-190403115201/75/Unit-i-mm_chap4_color-in-image-and-video-5-2048.jpg)
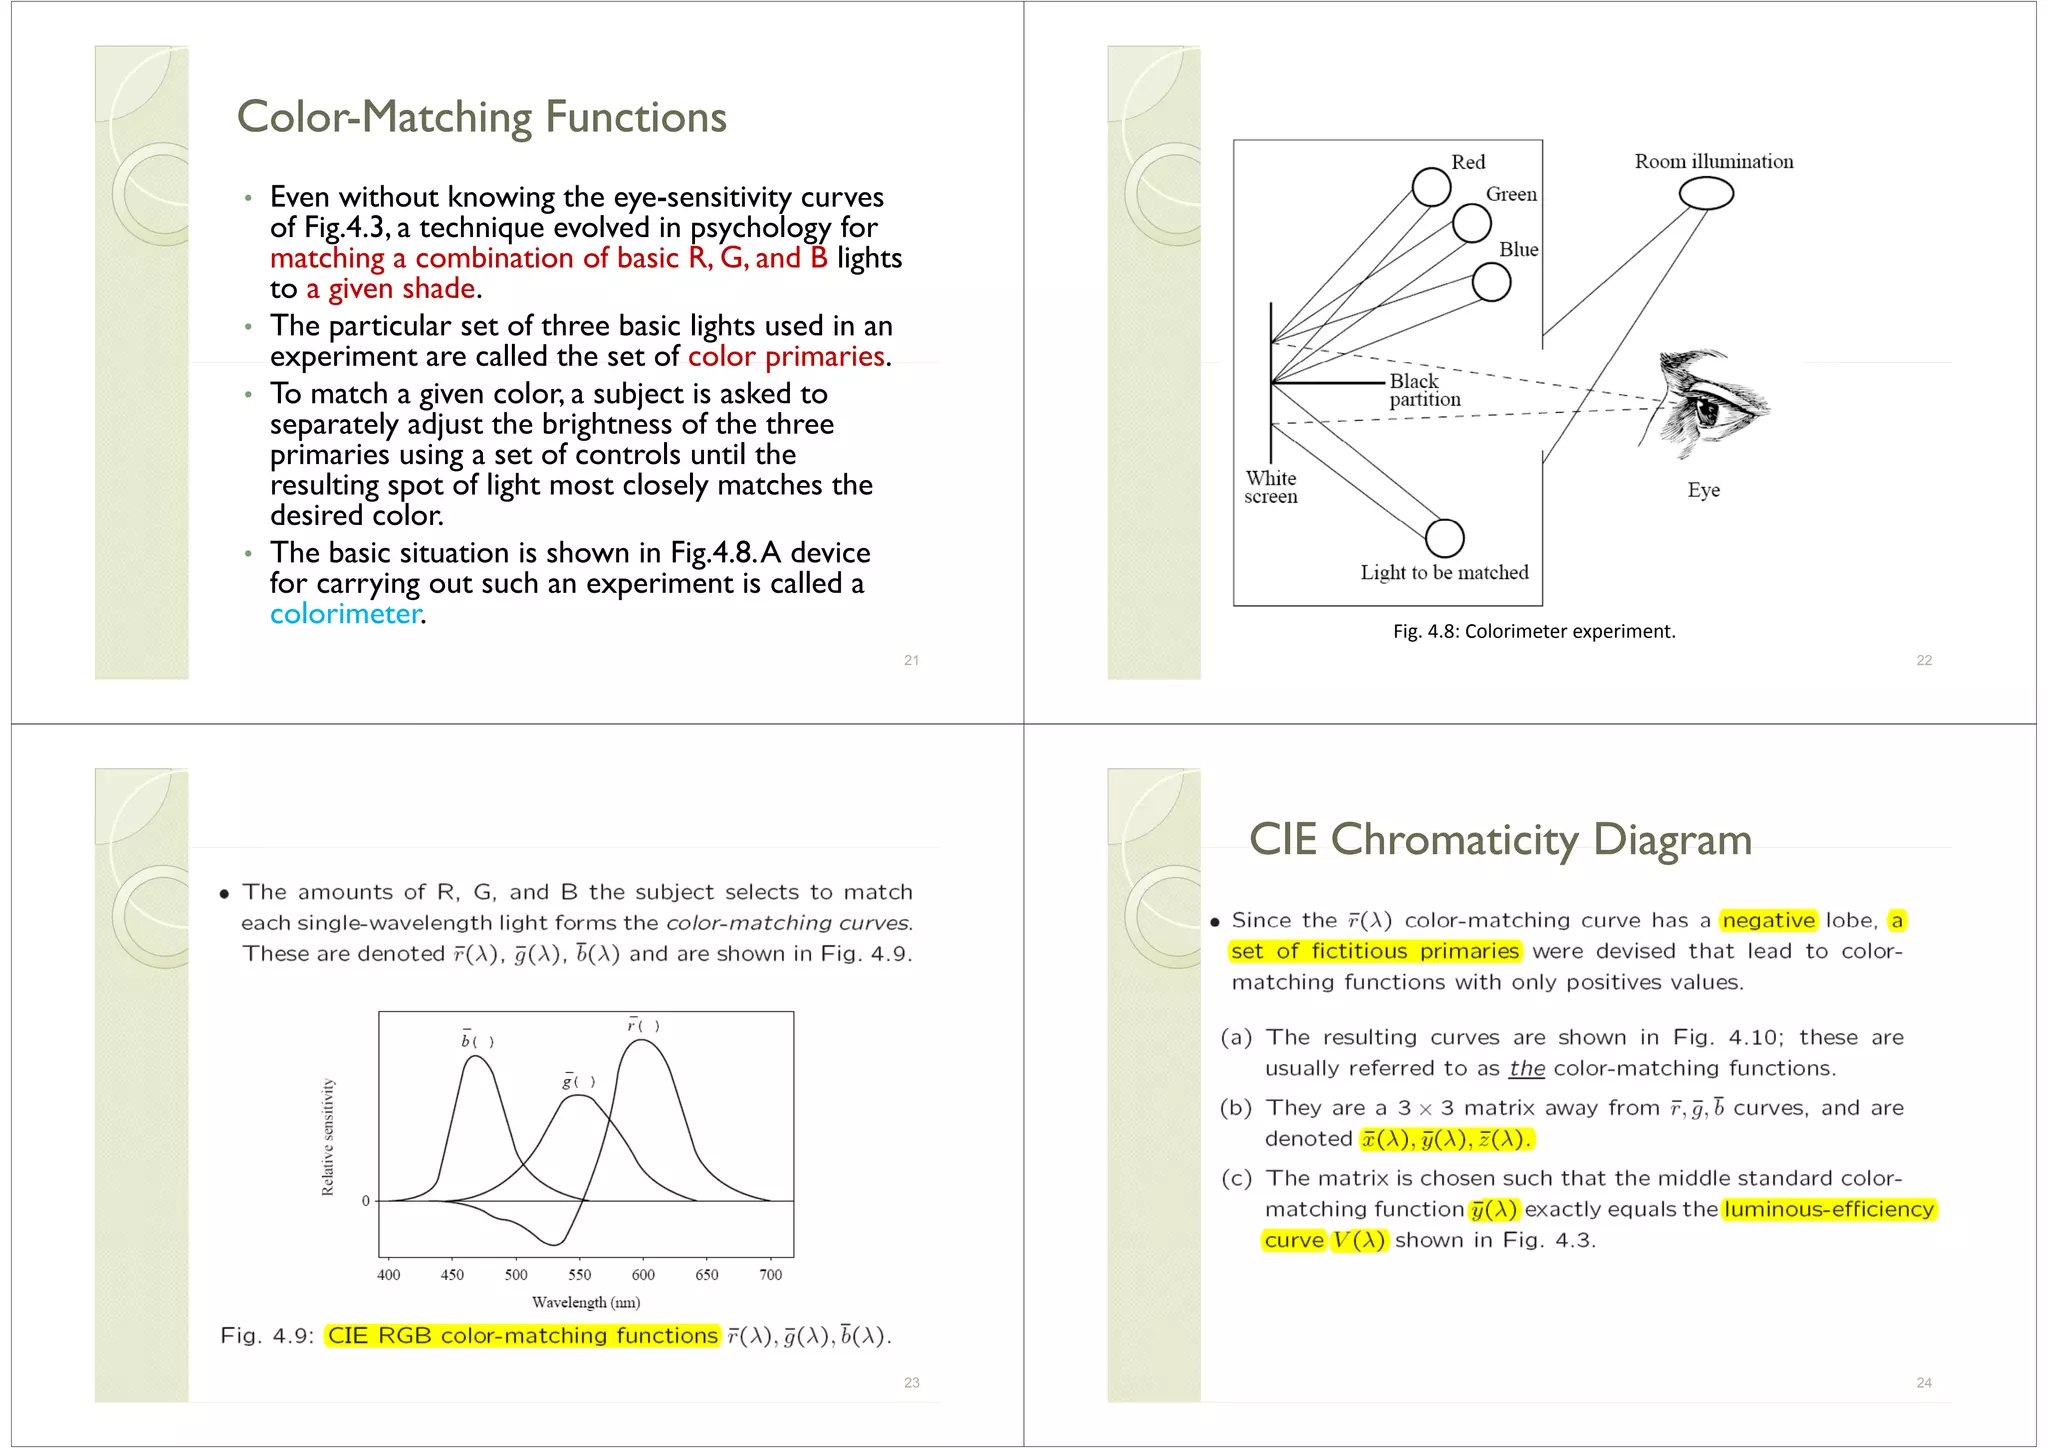
![• Chromaticities on the spectrum locus (theChromaticities on the spectrum locus (the
"horseshoe" in Fig. 4.11) represent "pure"
colors.These are the most "saturated".
Colors close to the white point are more
unsaturated.
Th h d f f• The chromaticity diagram: for a mixture of
two lights, the resulting chromaticity lies on
the straight line joining the chromaticities ofthe straight line joining the chromaticities of
the two lights.
• The "dominant wavelength" is the position• The dominant wavelength is the position
on the spectrum locus intersected by a line
joining the white point to the given color,j g p g
and extended through it.
33
Color Monitor SpecificationsColor Monitor SpecificationsColor Monitor SpecificationsColor Monitor Specifications
Color monitors are specified in part byColor monitors are specified in part by
the white point chromaticity that is
desired if the RGB electron guns are all
activated at their highest value (1.0, if weg (
normalize to [0,1]).
We want the monitor to display aWe want the monitor to display a
specified white when R’=G’=B’=1.
There are several monitor specifications
in current use (Table 4.1).( )
34
Table 4 1: Chromaticities and White PointsTable 4.1: Chromaticities and White Points
of Monitor Specifications
35
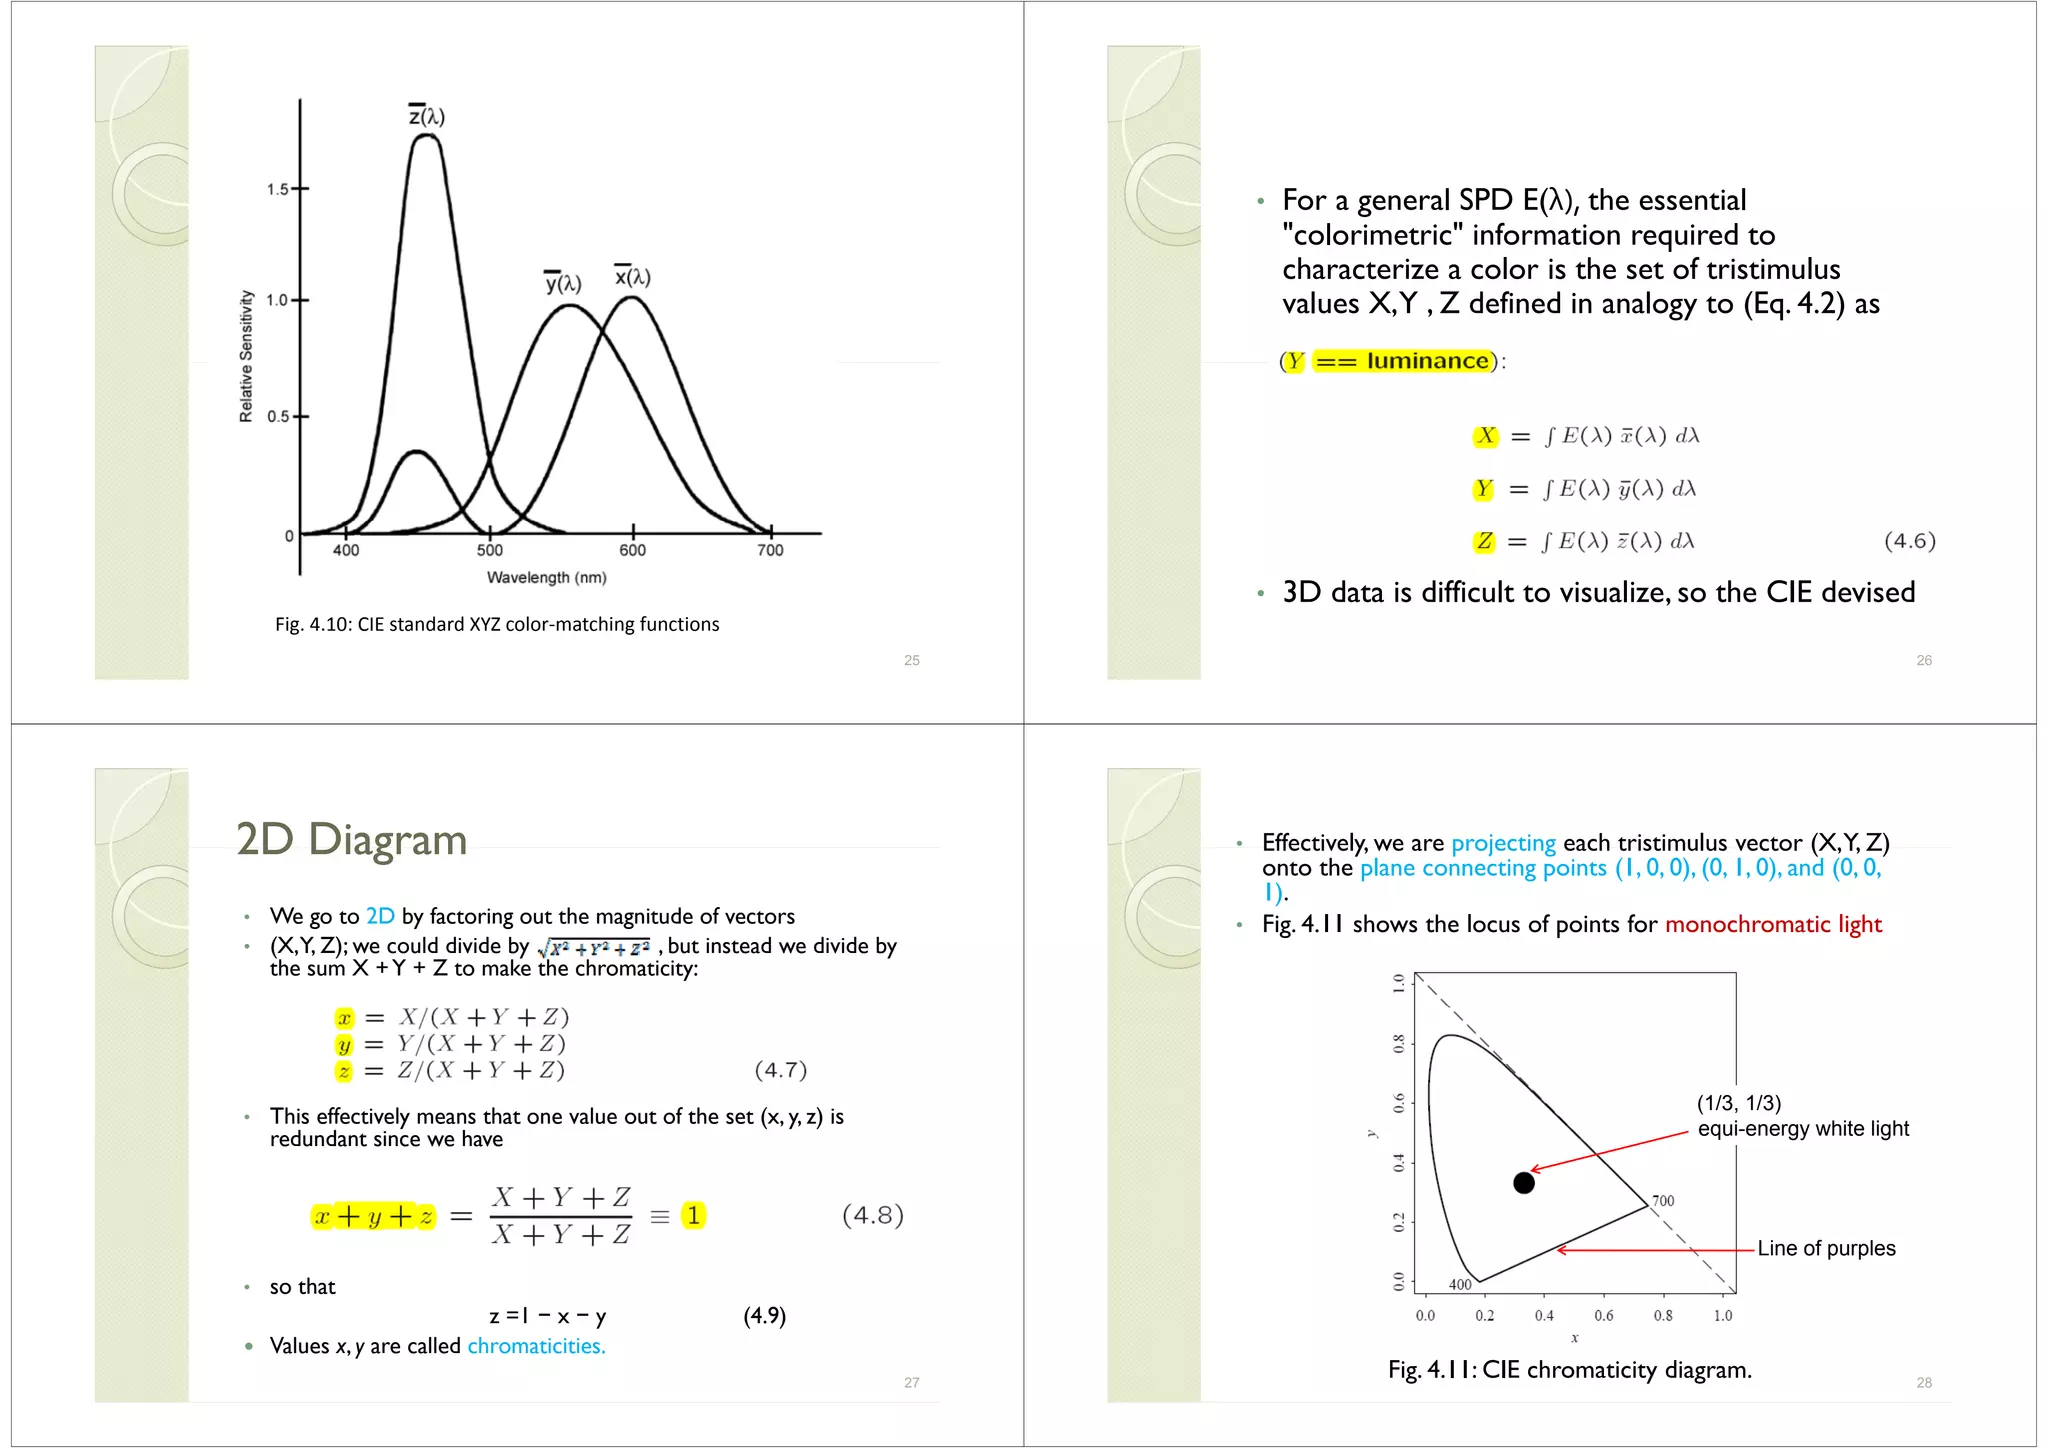
OutOut--ofof--Gamut ColorsGamut ColorsOutOut ofof Gamut ColorsGamut Colors
For any (x y) pair we wish to find thatFor any (x, y) pair we wish to find that
RGB triple giving the specified (x, y, z):We
form the z values for the phosphors, via z
=1 − x − y and solve for RGB from they
phosphor chromaticities.
We combine nonzero values of R G andWe combine nonzero values of R, G, and
B via
36](https://image.slidesharecdn.com/unitimmchap4colorinimageandvideo-190403115201/75/Unit-i-mm_chap4_color-in-image-and-video-9-2048.jpg)
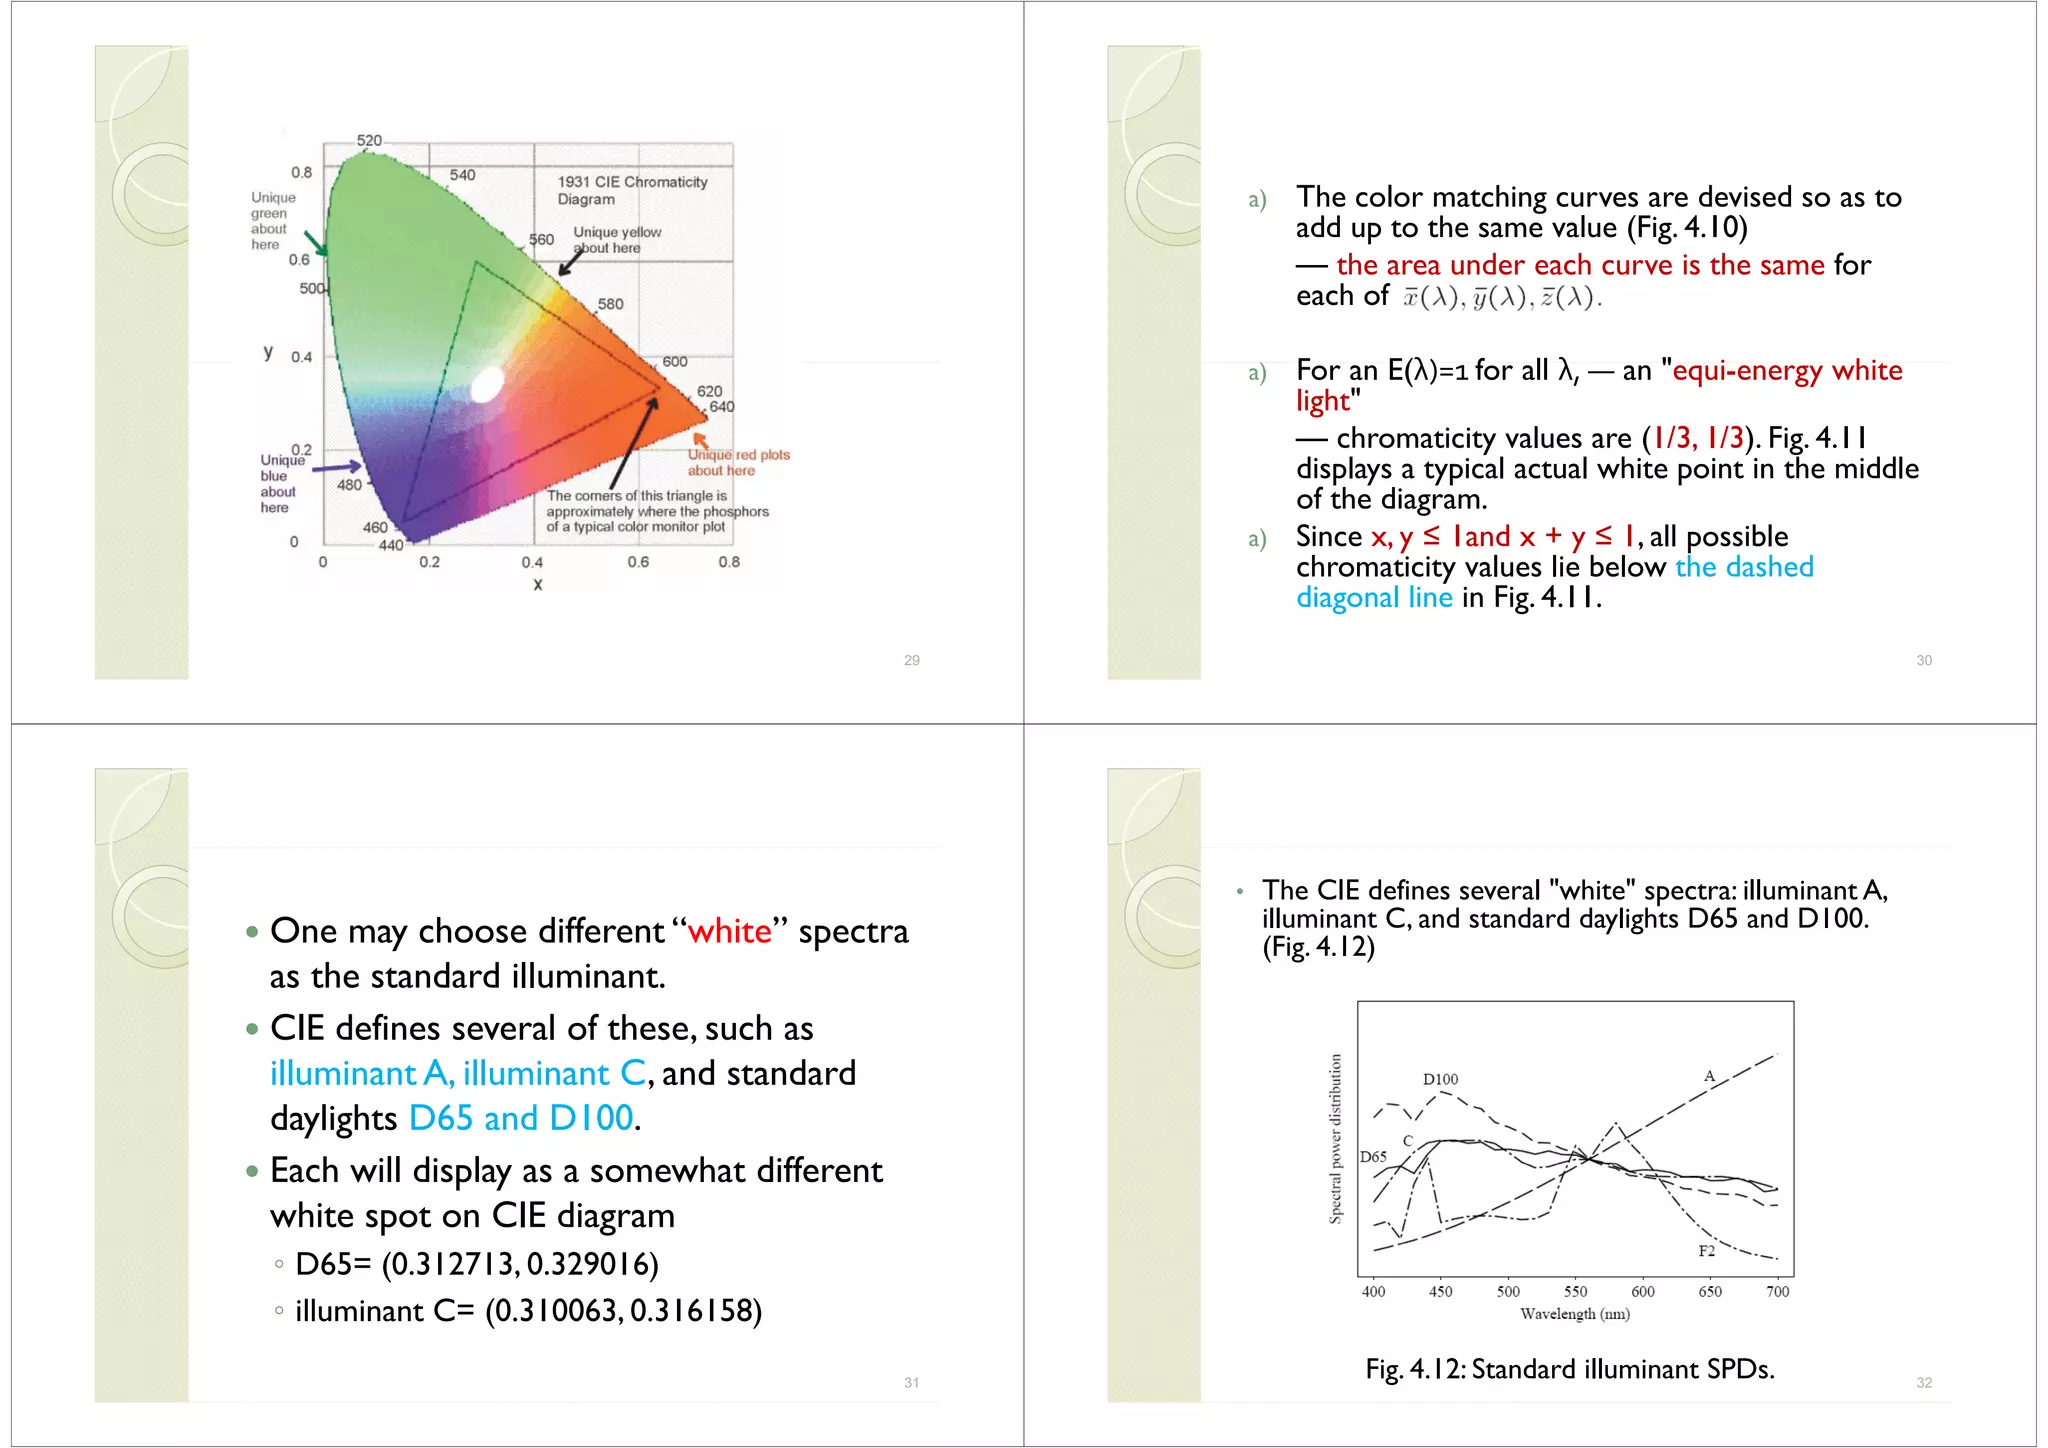
![(x y z)=>(R G B)(x y z)=>(R G B)(x, y, z) >(R,G,B)(x, y, z) >(R,G,B)
• If (x y) [color without magnitude] is• If (x, y) [color without magnitude] is
specified, instead of derived as above, we
have to invert the matrix of phosphor (xhave to invert the matrix of phosphor (x,
y, z) values to obtain RGB.
Wh d d if f h RGB• What do we do if any of the RGB
numbers is negative?— that color, visible
h i f f di lto humans, is out-of-gamut for our display.
1. One method: simply use the closest in-
gamut color available, as in Fig. 4.13.
2. Another approach: select the closest
complementary color.
37
Fig. 4.13: Approximating an out‐of‐gamut color by an in‐gamut one. The out‐of‐gamut
color shown by a triangle is approximated by the intersection of (a) the line
38
y g pp y ( )
from that color to the white point with (b) the boundary of the device color
gamut.
• Grassman's Law: (Additive) color matching is linear.Grassman s Law: (Additive) color matching is linear.
This means that if we match color1 with a linear
combinations of lights and match color2 with another
set of weights the combined color color1+ color2 isset of weights, the combined color color1+ color2 is
matched by the sum of the two sets of weights.
• Additive color results from self-luminous sources,
h li h j d hi hsuch as lights projected on a white screen, or the
phosphors glowing on the monitor glass. (Subtractive
color applies for printers, and is very different).pp p y )
• Fig. 4.13 above shows the triangular gamut for the
NTSC system, drawn on the CIE diagram — a
monitor can display only the colors inside a triangularmonitor can display only the colors inside a triangular
gamut.
39
White Point CorrectionWhite Point CorrectionWhite Point CorrectionWhite Point Correction
• Problems:Problems:
(a) One deficiency in what we have done so far is
that we need to be able to map tristimulus
l XYZ d RGB l dvalues XYZ to device RGBs including
magnitude, and not just deal with chromaticity
xyz.xyz.
(b) Table 4.1 would produce incorrect values:
E.g., consider the SMPTE specifications. Setting R =g p g
G = B = 1 results in a value of X that equals the
sum of the x values, or 0.630 + 0.310 + 0.155,
which is 1.095. Similarly theY and Z values comey
out to 1.005 and 0.9. Now, dividing by (X +Y + Z)
this results in a chromaticity of (0.365, 0.335),
rather than the desired values of (0.3127, 0.3291).rather than the desired values of (0.3127, 0.3291).
40](https://image.slidesharecdn.com/unitimmchap4colorinimageandvideo-190403115201/75/Unit-i-mm_chap4_color-in-image-and-video-10-2048.jpg)
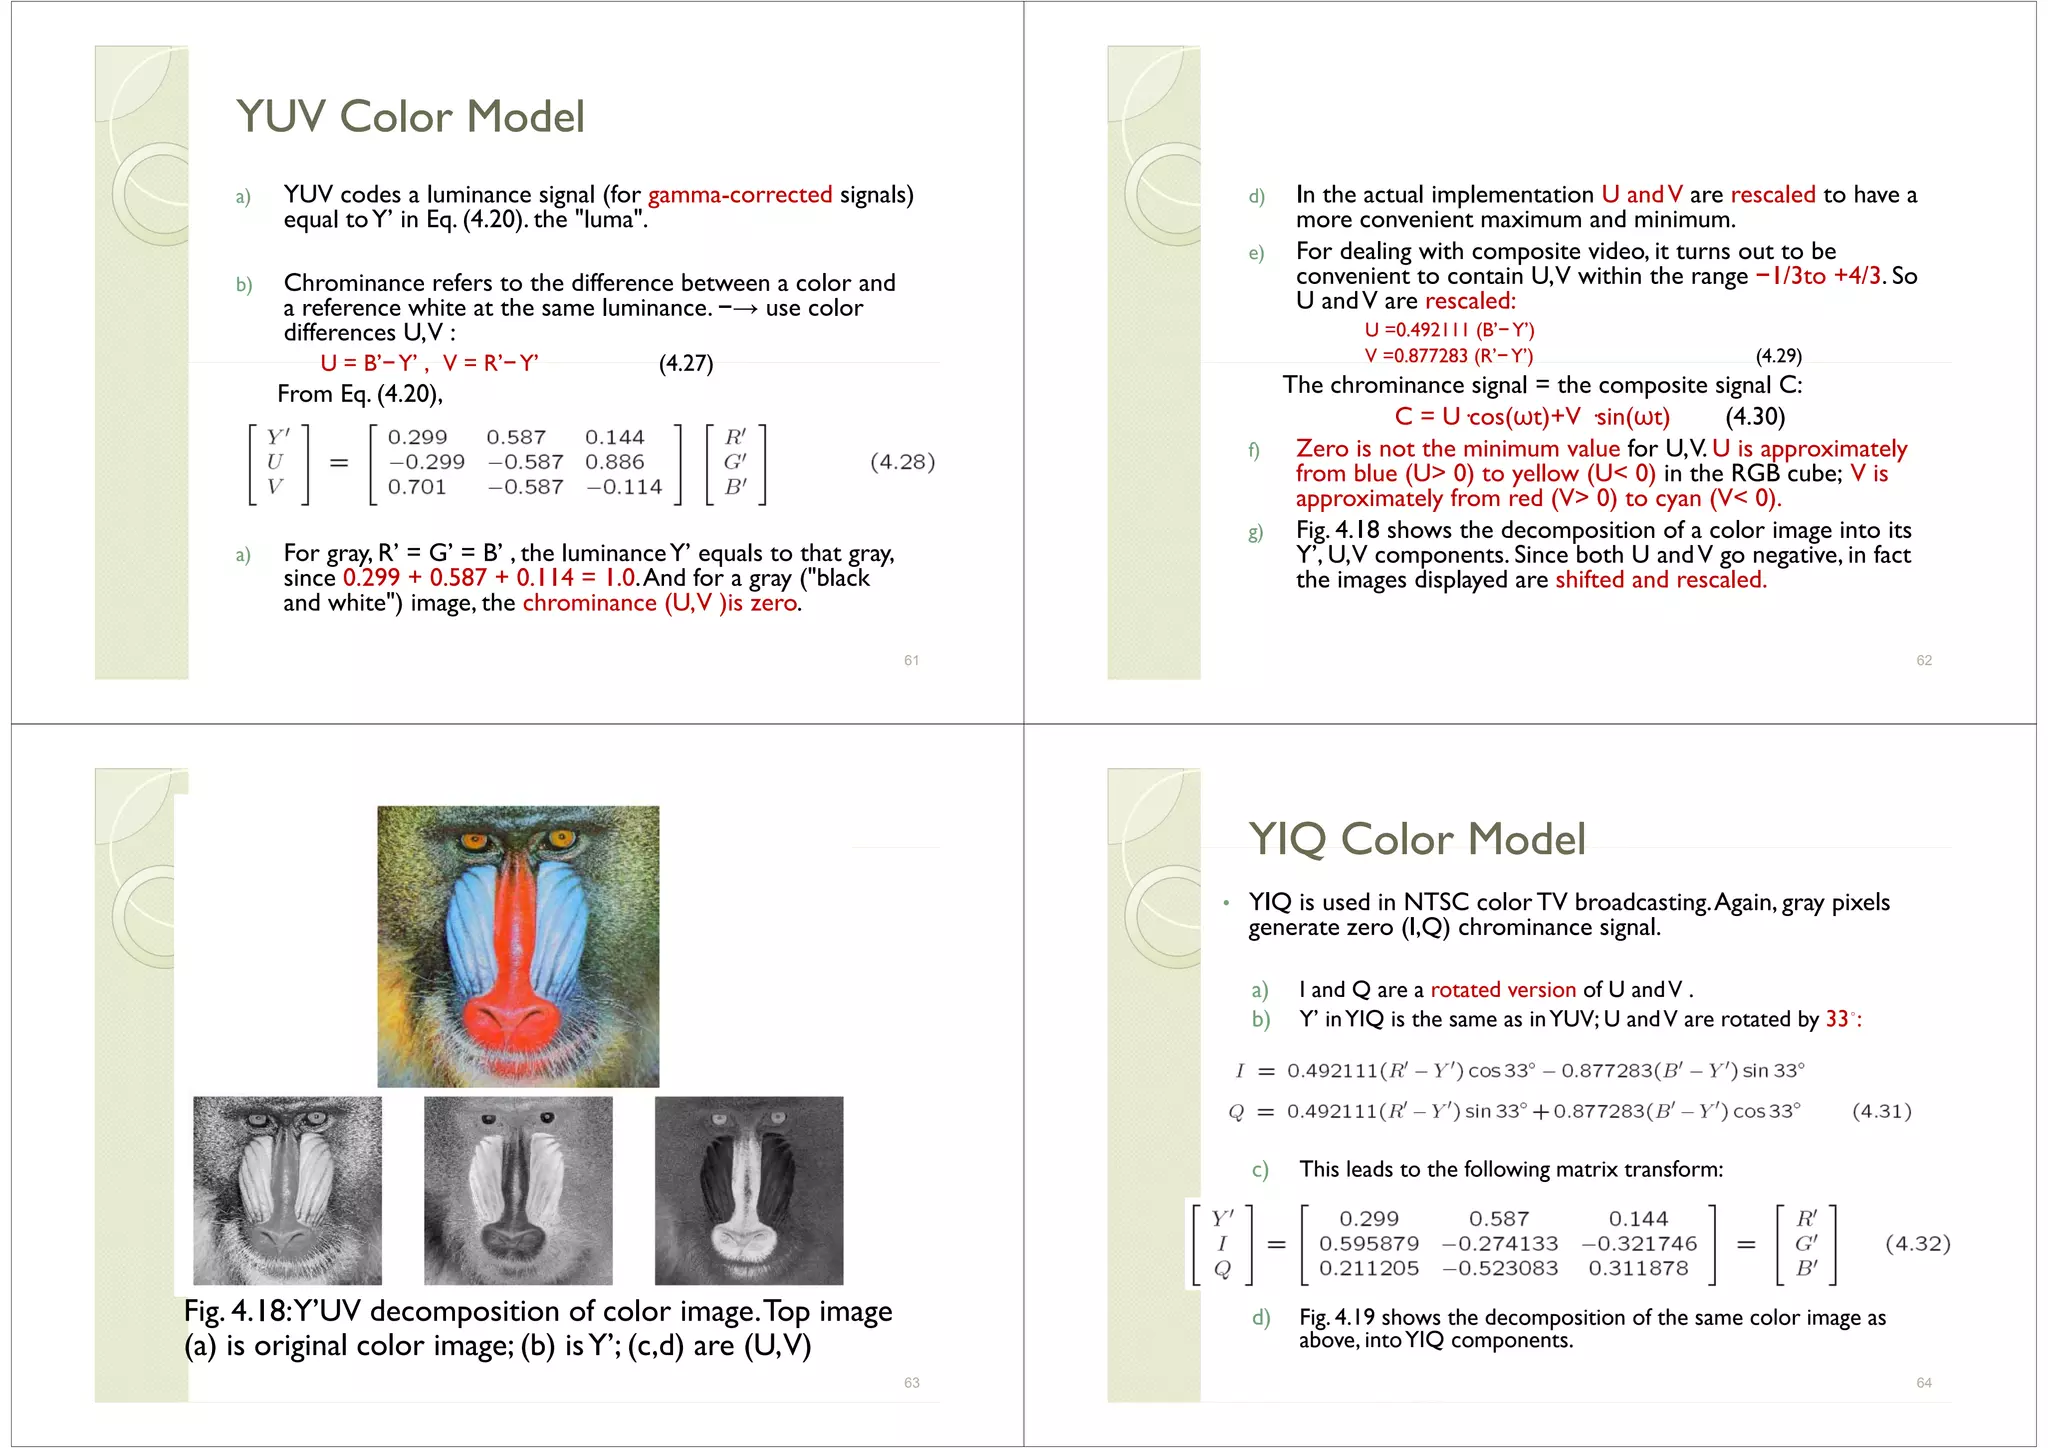
![Fig.4.19: I and Q components of color image.
65
YCbCr Color ModelYCbCr Color ModelYCbCr Color ModelYCbCr Color Model
• The Rec 601 standard for digital video usesThe Rec. 601 standard for digital video uses
another color space,YCbCr, often simply
writtenYCbCr — closely related to theYUVy
transform.
a) YUV is changed by scaling such that Cb is U,
b t ith ffi i t f 0 5 lti l i B’ Ibut with a coefficient of 0.5 multiplying B’ . In
some software systems, Cb and Cr are also
shifted such that values are between 0 and 1.
b) This makes the equations as follows:
Cb =((B’−Y’)/1.772) +0.5
Cr =((R’−Y’)/1.402)+ 0.5 (4.33)
c) Written out:
66
d) In practice however Recommendation 601d) In practice, however, Recommendation 601
specifies 8-bit coding, with a maximumY’
value of only 219, and a minimum of +16.y
Cb and Cr have a range of ±112 and offset
of +128. If R’, G’, B’ are floats in [0.. + 1],
then we obtainY’ C C in [0 255] via thethen we obtainY , Cb, Cr in [0..255] via the
transform:
e) TheYCbCr transform is used in JPEG image
compression and MPEG video compressioncompression and MPEG video compression.
67
4 4 Further Exploration4 4 Further Exploration4.4 Further Exploration4.4 Further Exploration
−→ Link to Further Exploration for Chapter 4.Link to Further Exploration for Chapter 4.
• Links in the Chapter 4 section of the “Further
”Exploration” directory on the text website include:
– More details on gamma correction for publication on the
WWW.
– The full specification of the new sRGB standard color
space for WWW applications.
– A link to an excellent review of color transforms– A link to an excellent review of color transforms.
– A Matlab script to exercise (and expand upon) the color
transform functions that are part of the ImageToolbox in
Matlab: the standard ‘Lena’ image is transformed toMatlab: the standard Lena image is transformed to
YIQ and toYCbCr.
– The new MPEG standard, MPEG-7, will be discussed in
Ch t 12 MPEG 7 i l d i lChapter 12. MPEG-7 includes six color spaces.
68](https://image.slidesharecdn.com/unitimmchap4colorinimageandvideo-190403115201/75/Unit-i-mm_chap4_color-in-image-and-video-17-2048.jpg)


![Coded Agents – with UiPath SDK + LangGraph [Virtual Hands-on Workshop]](https://cdn.slidesharecdn.com/ss_thumbnails/codedagentsdeck-251215155422-5497c599-thumbnail.jpg?width=640&height=640&fit=bounds)


