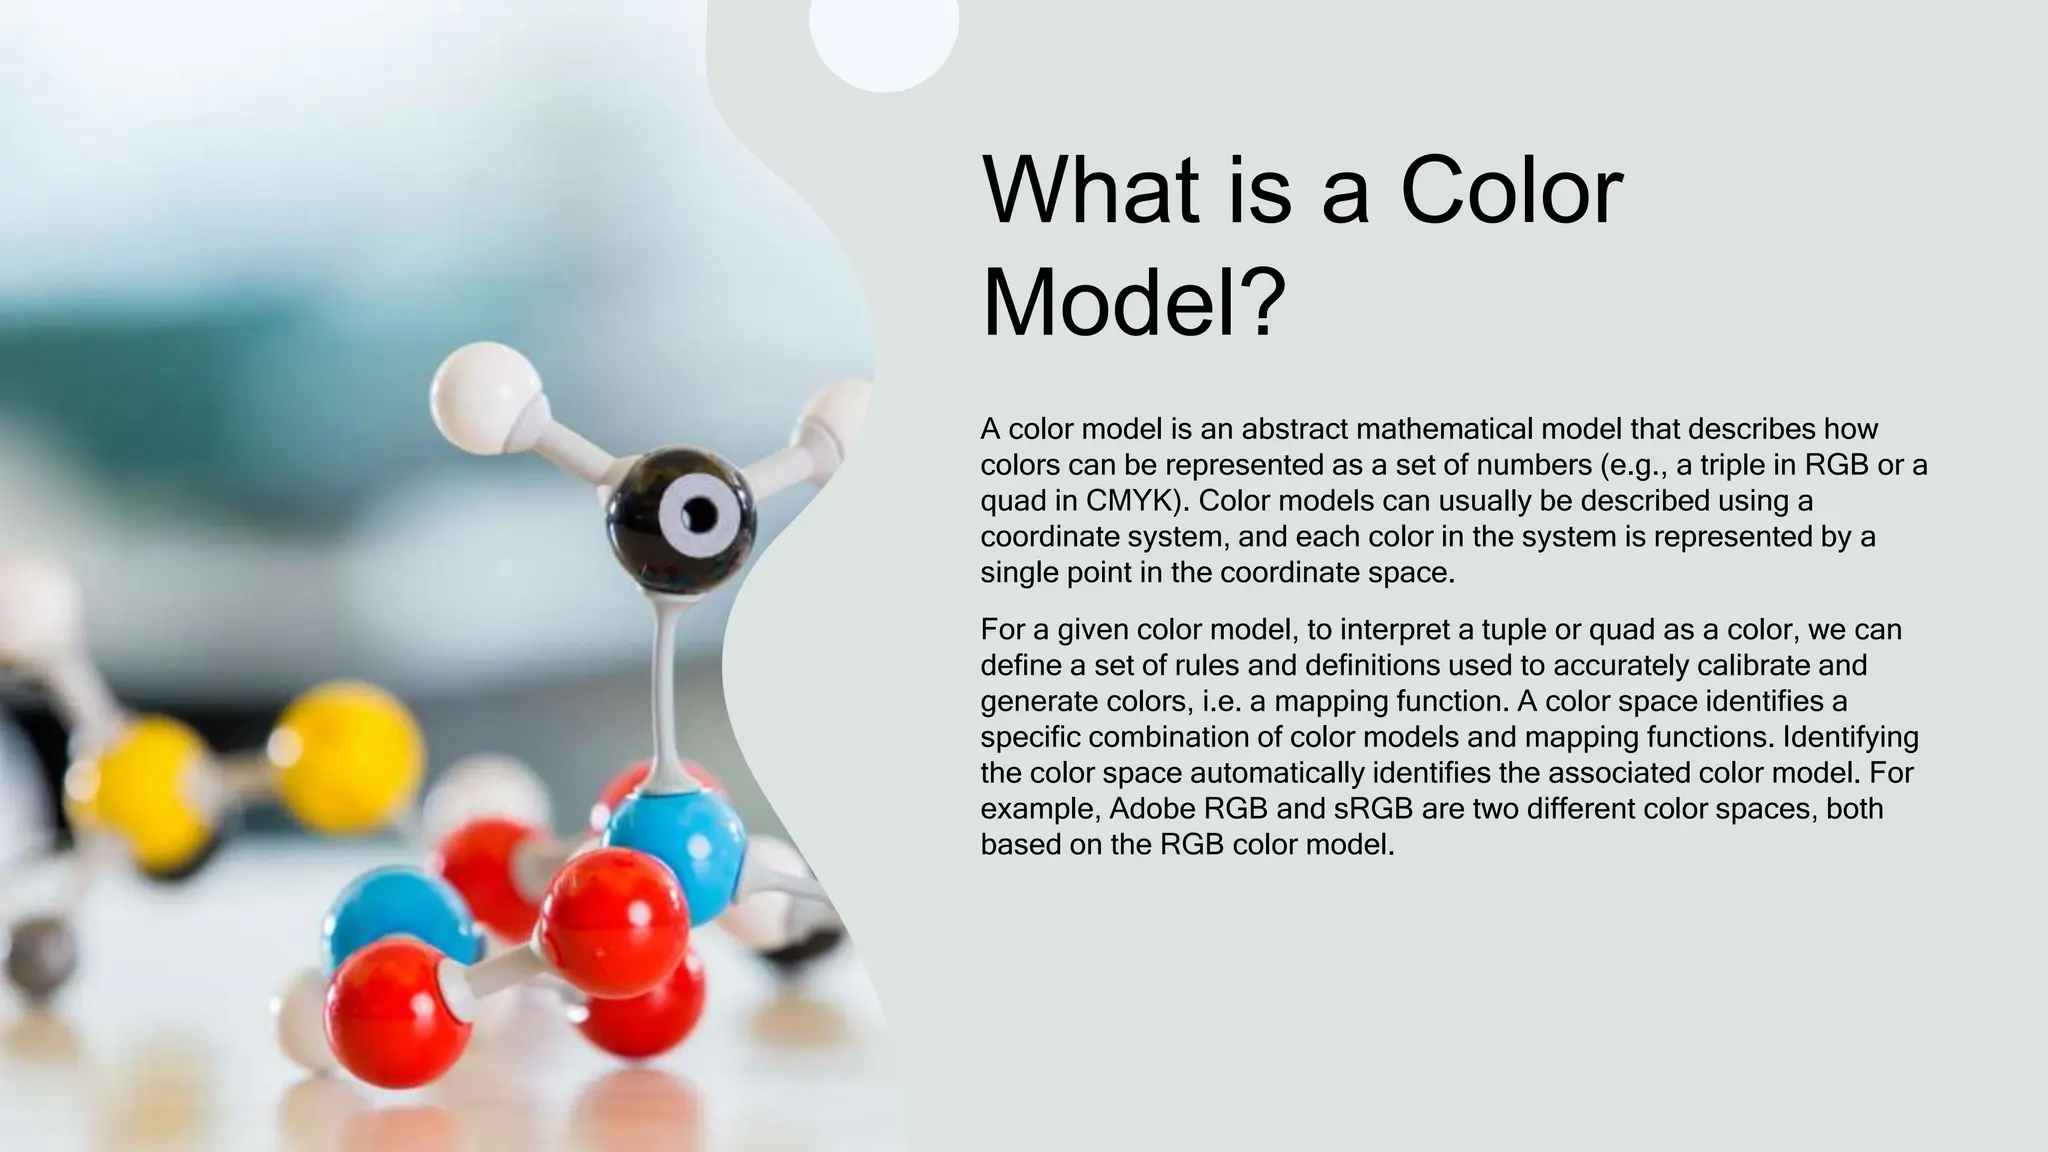
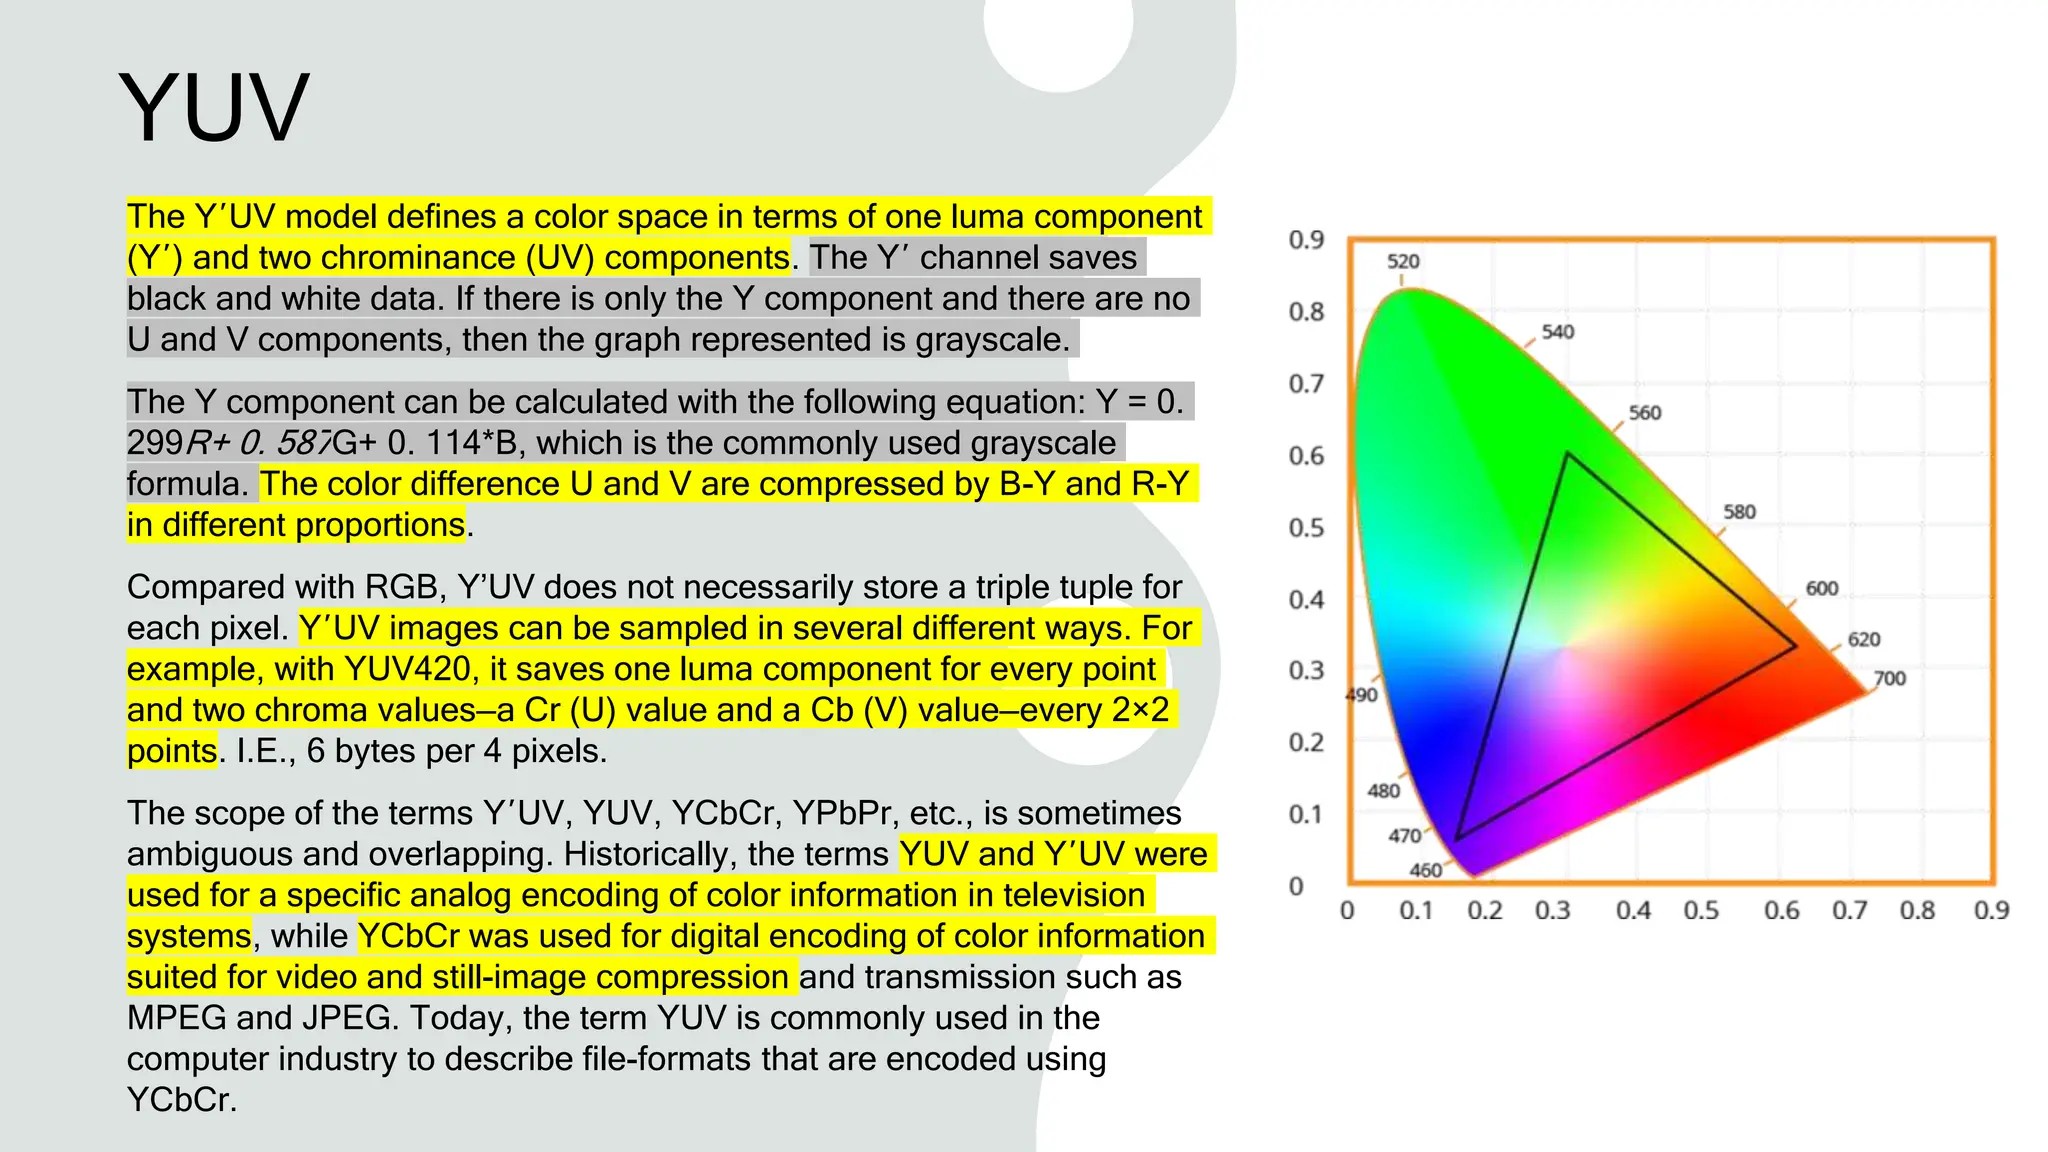
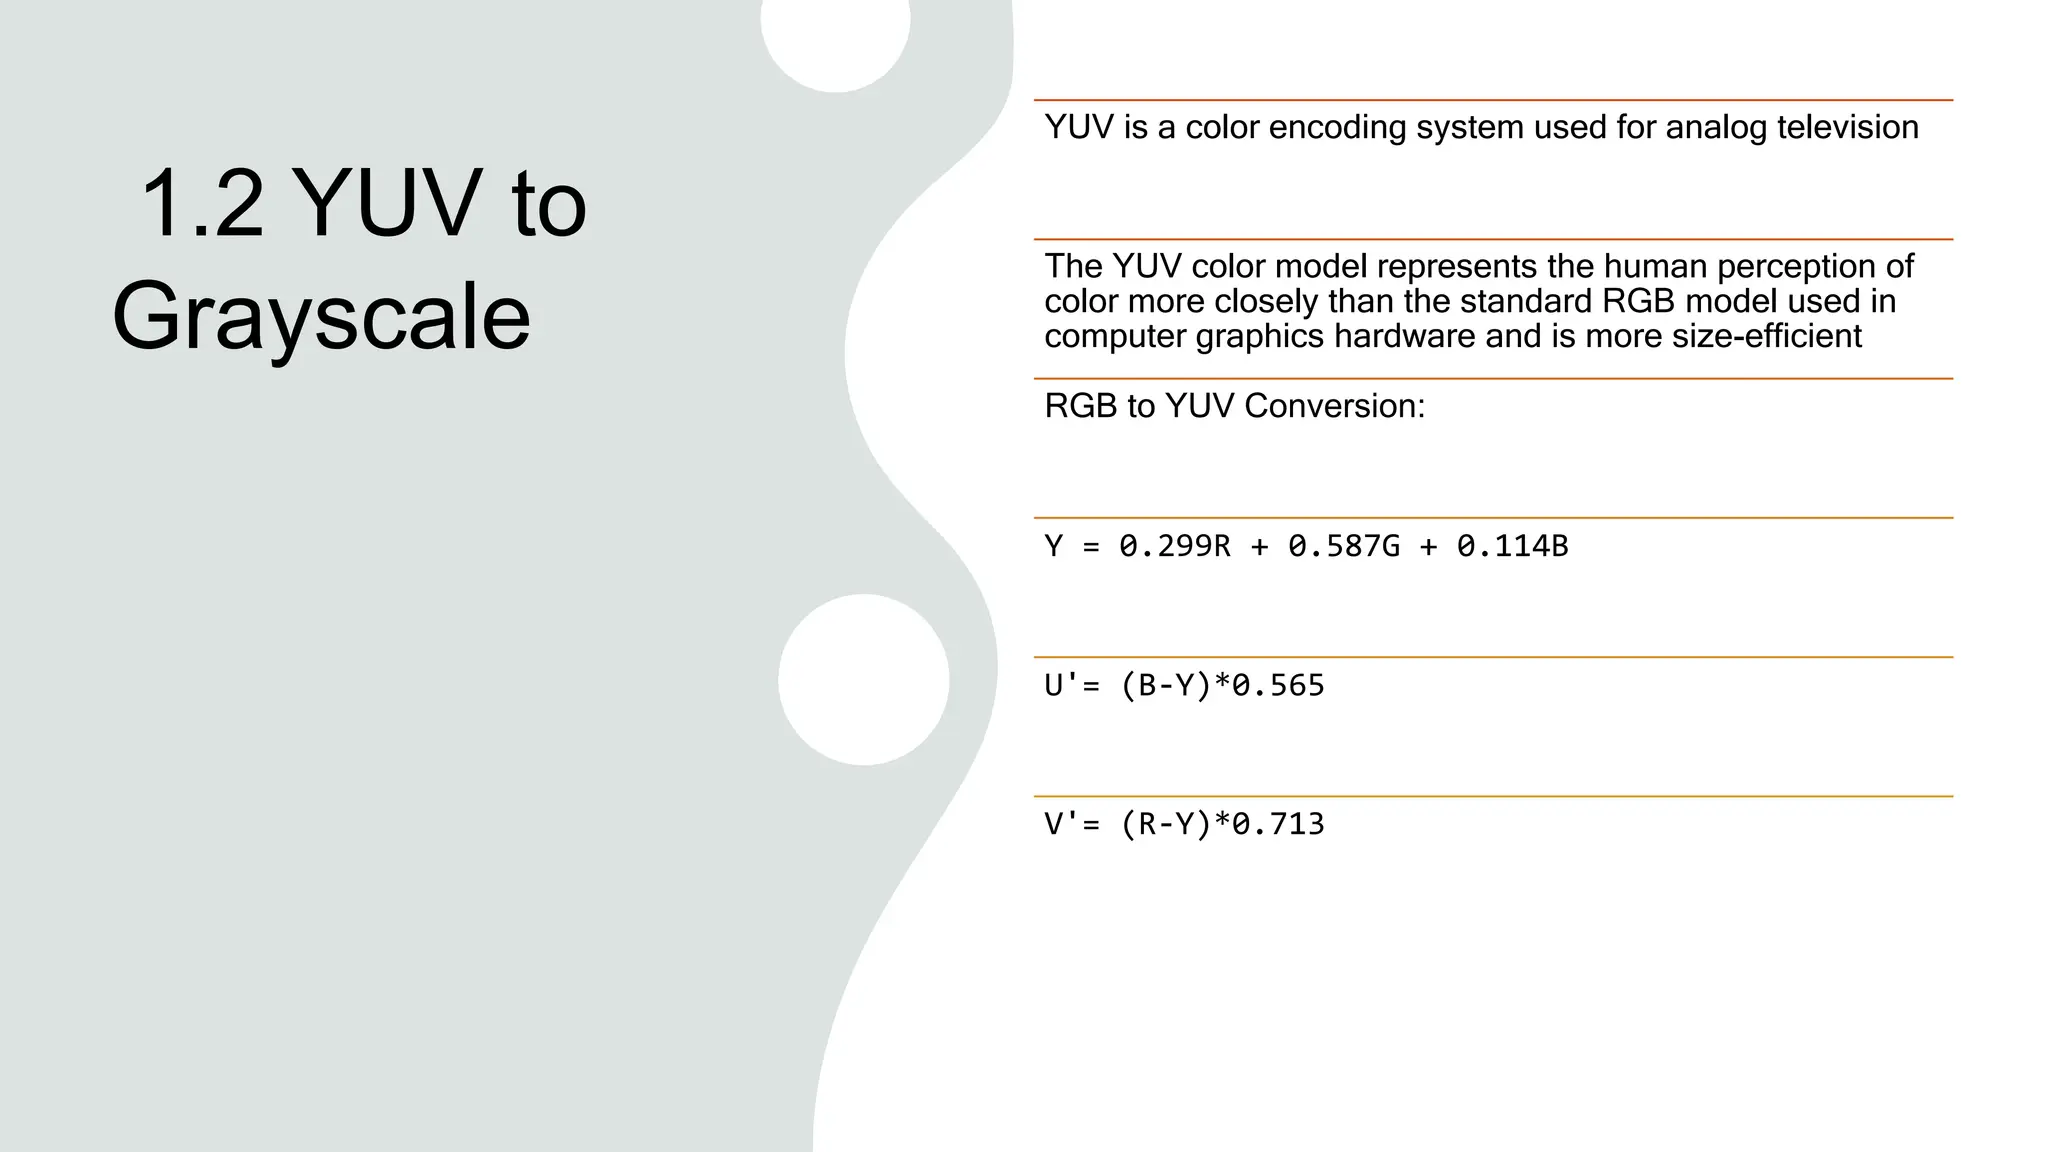
The document discusses various color models and color spaces including RGB, CMY, HSV, YUV, and grayscale. It provides details on:
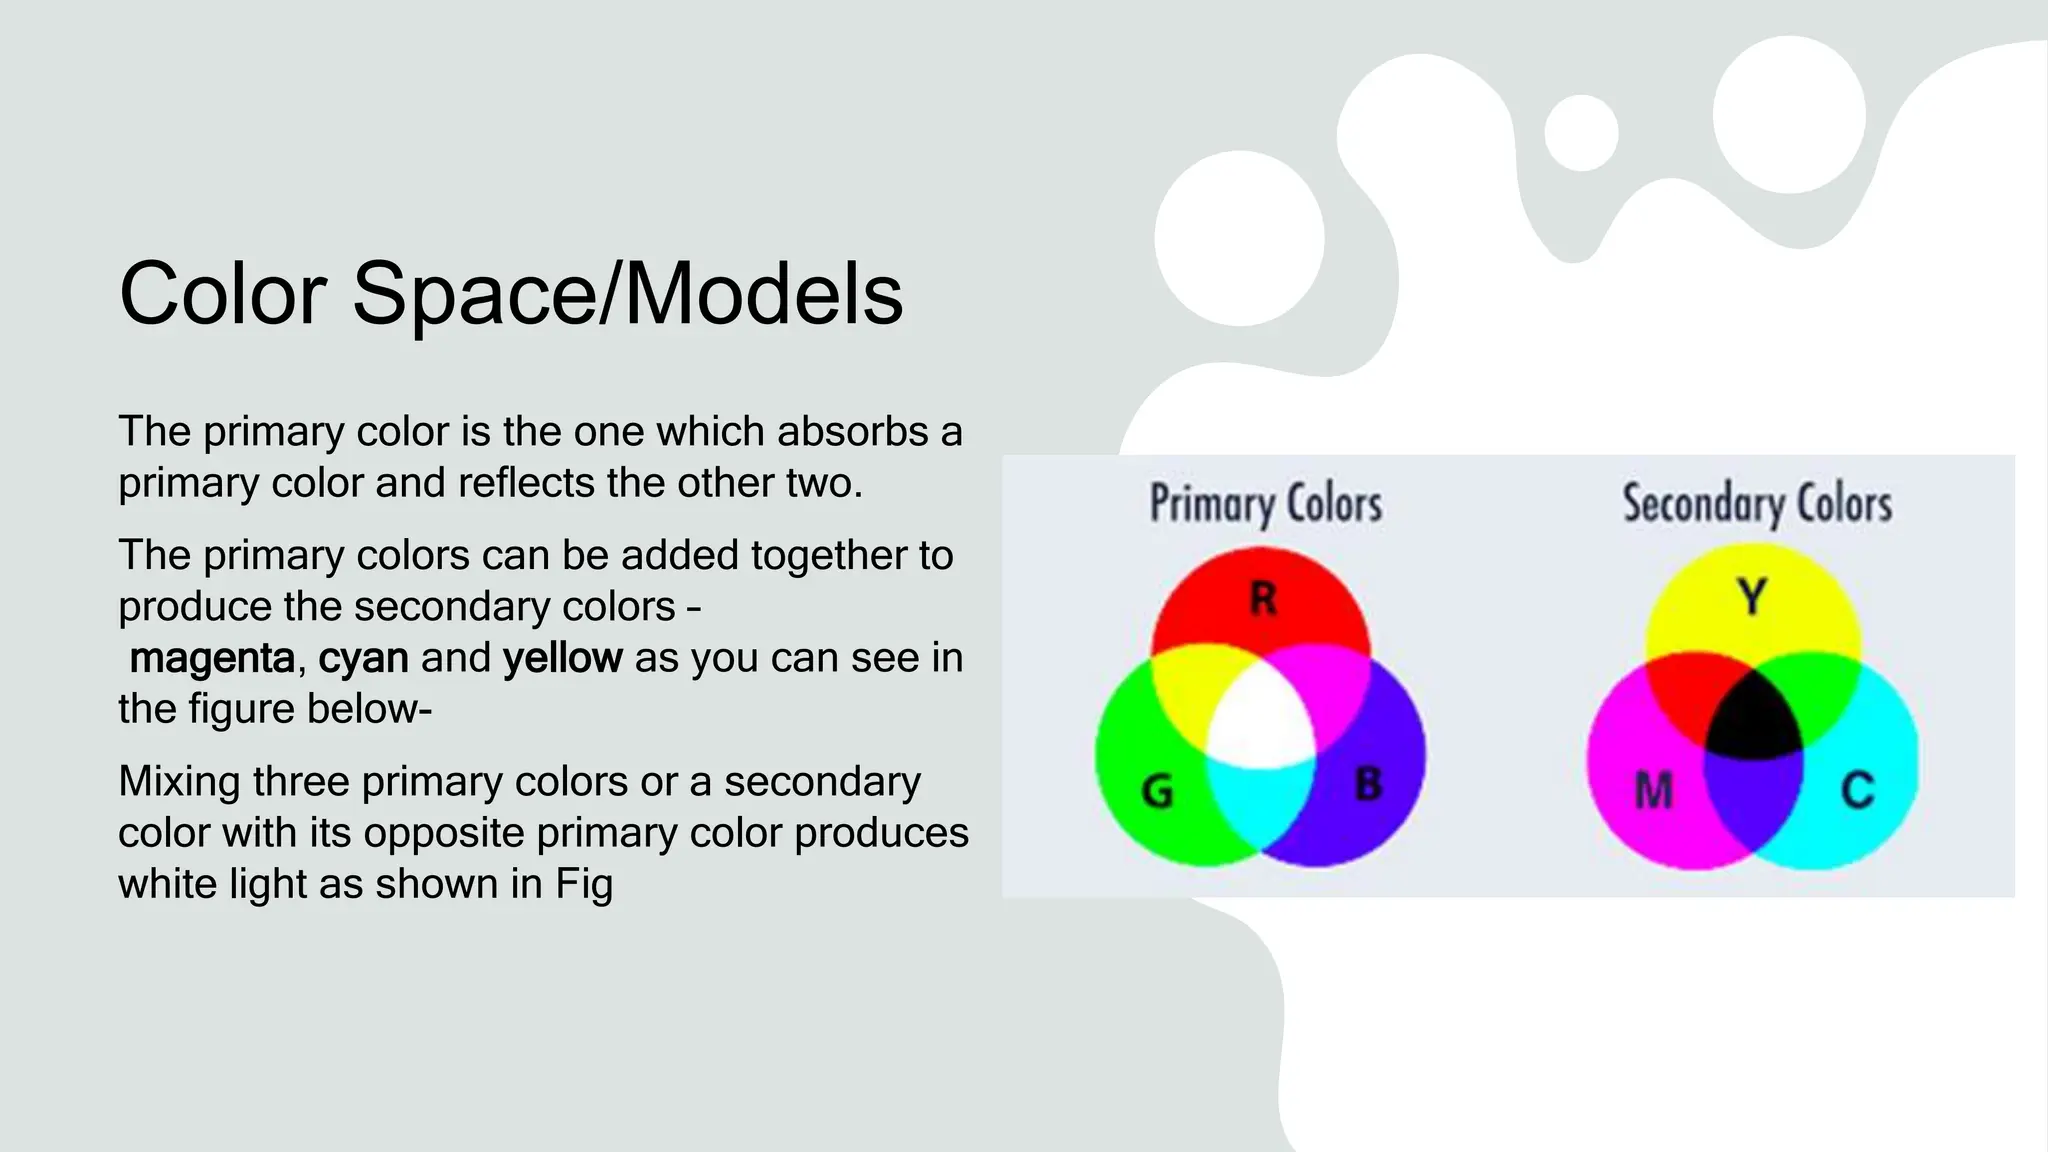
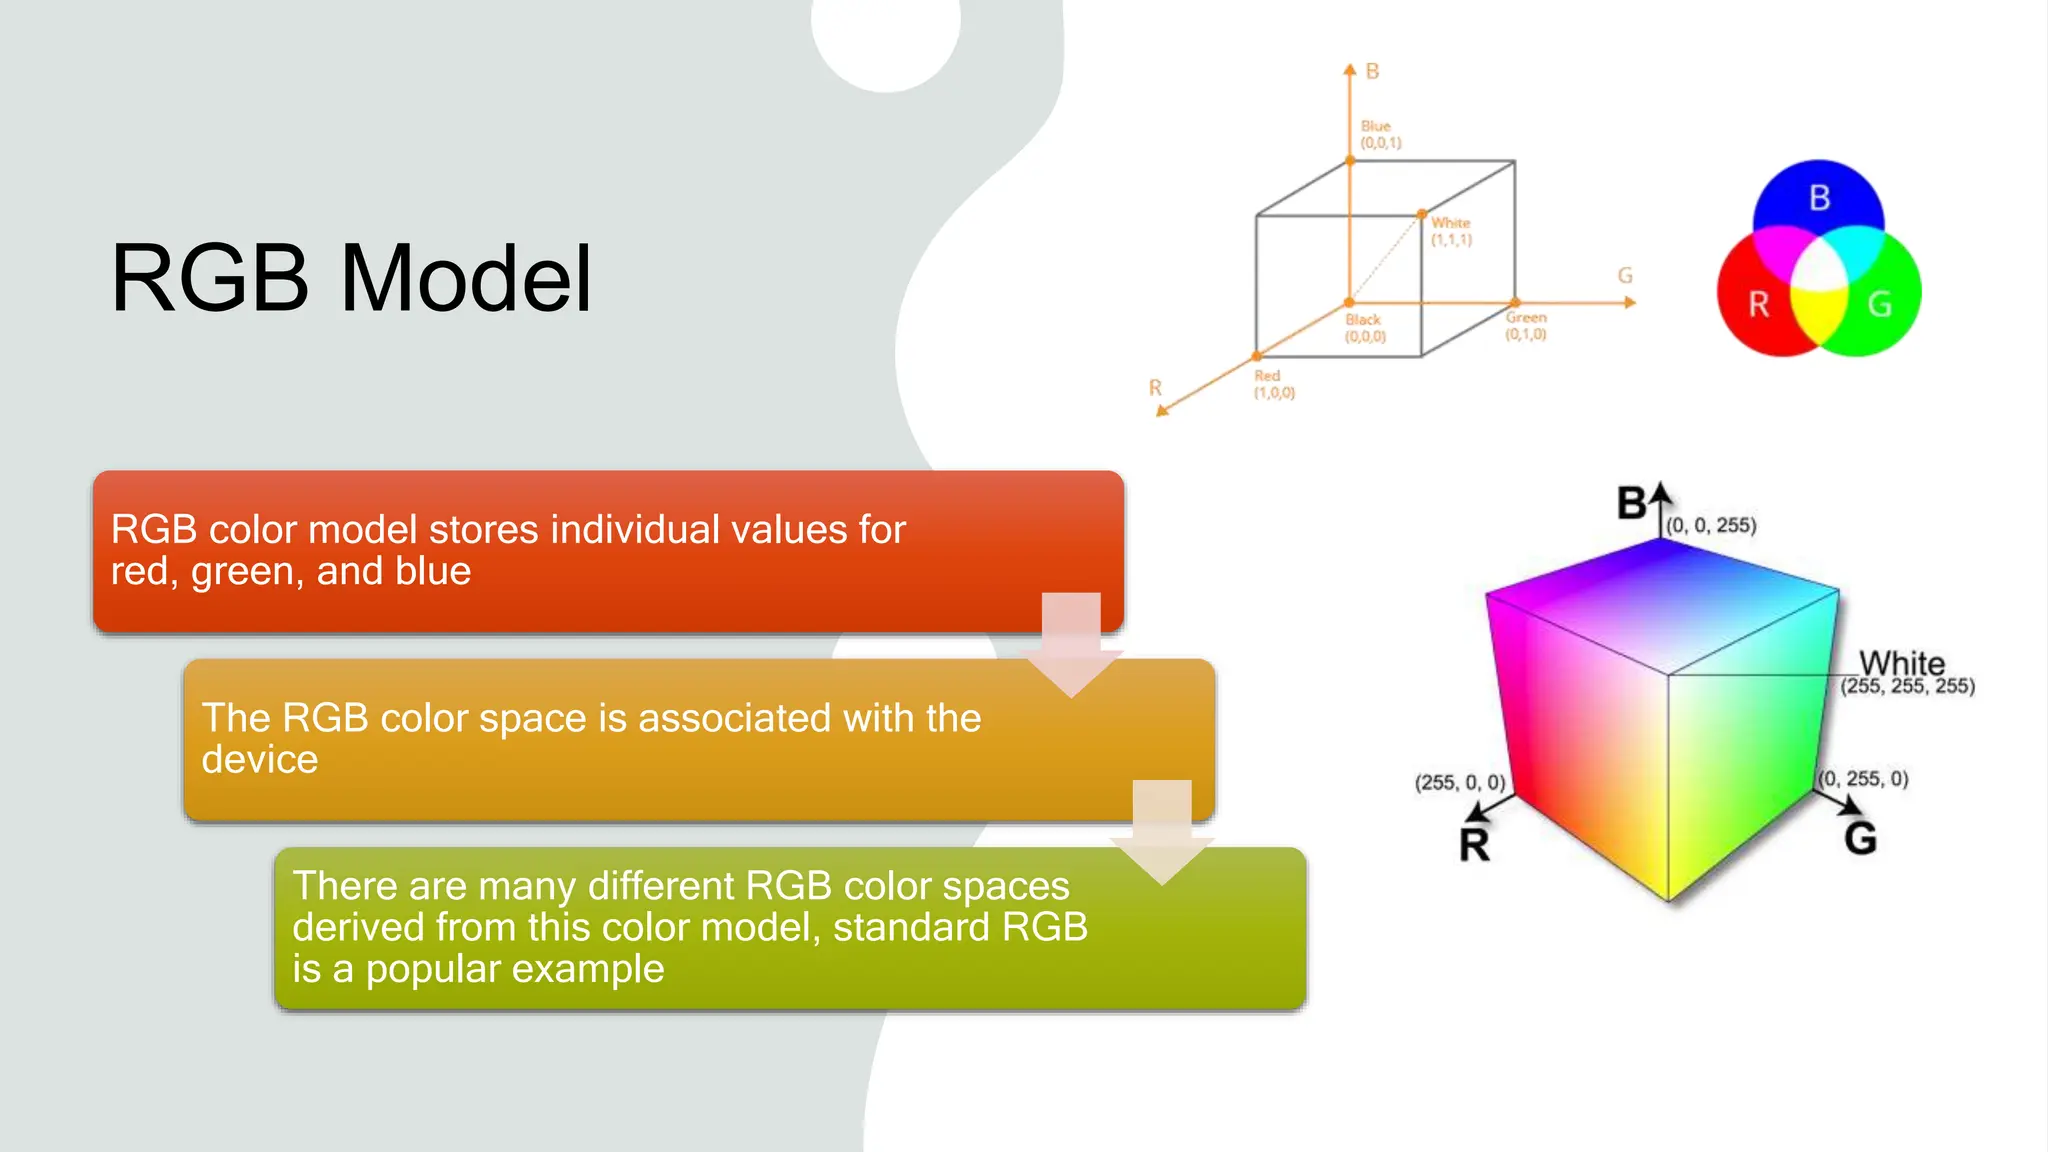
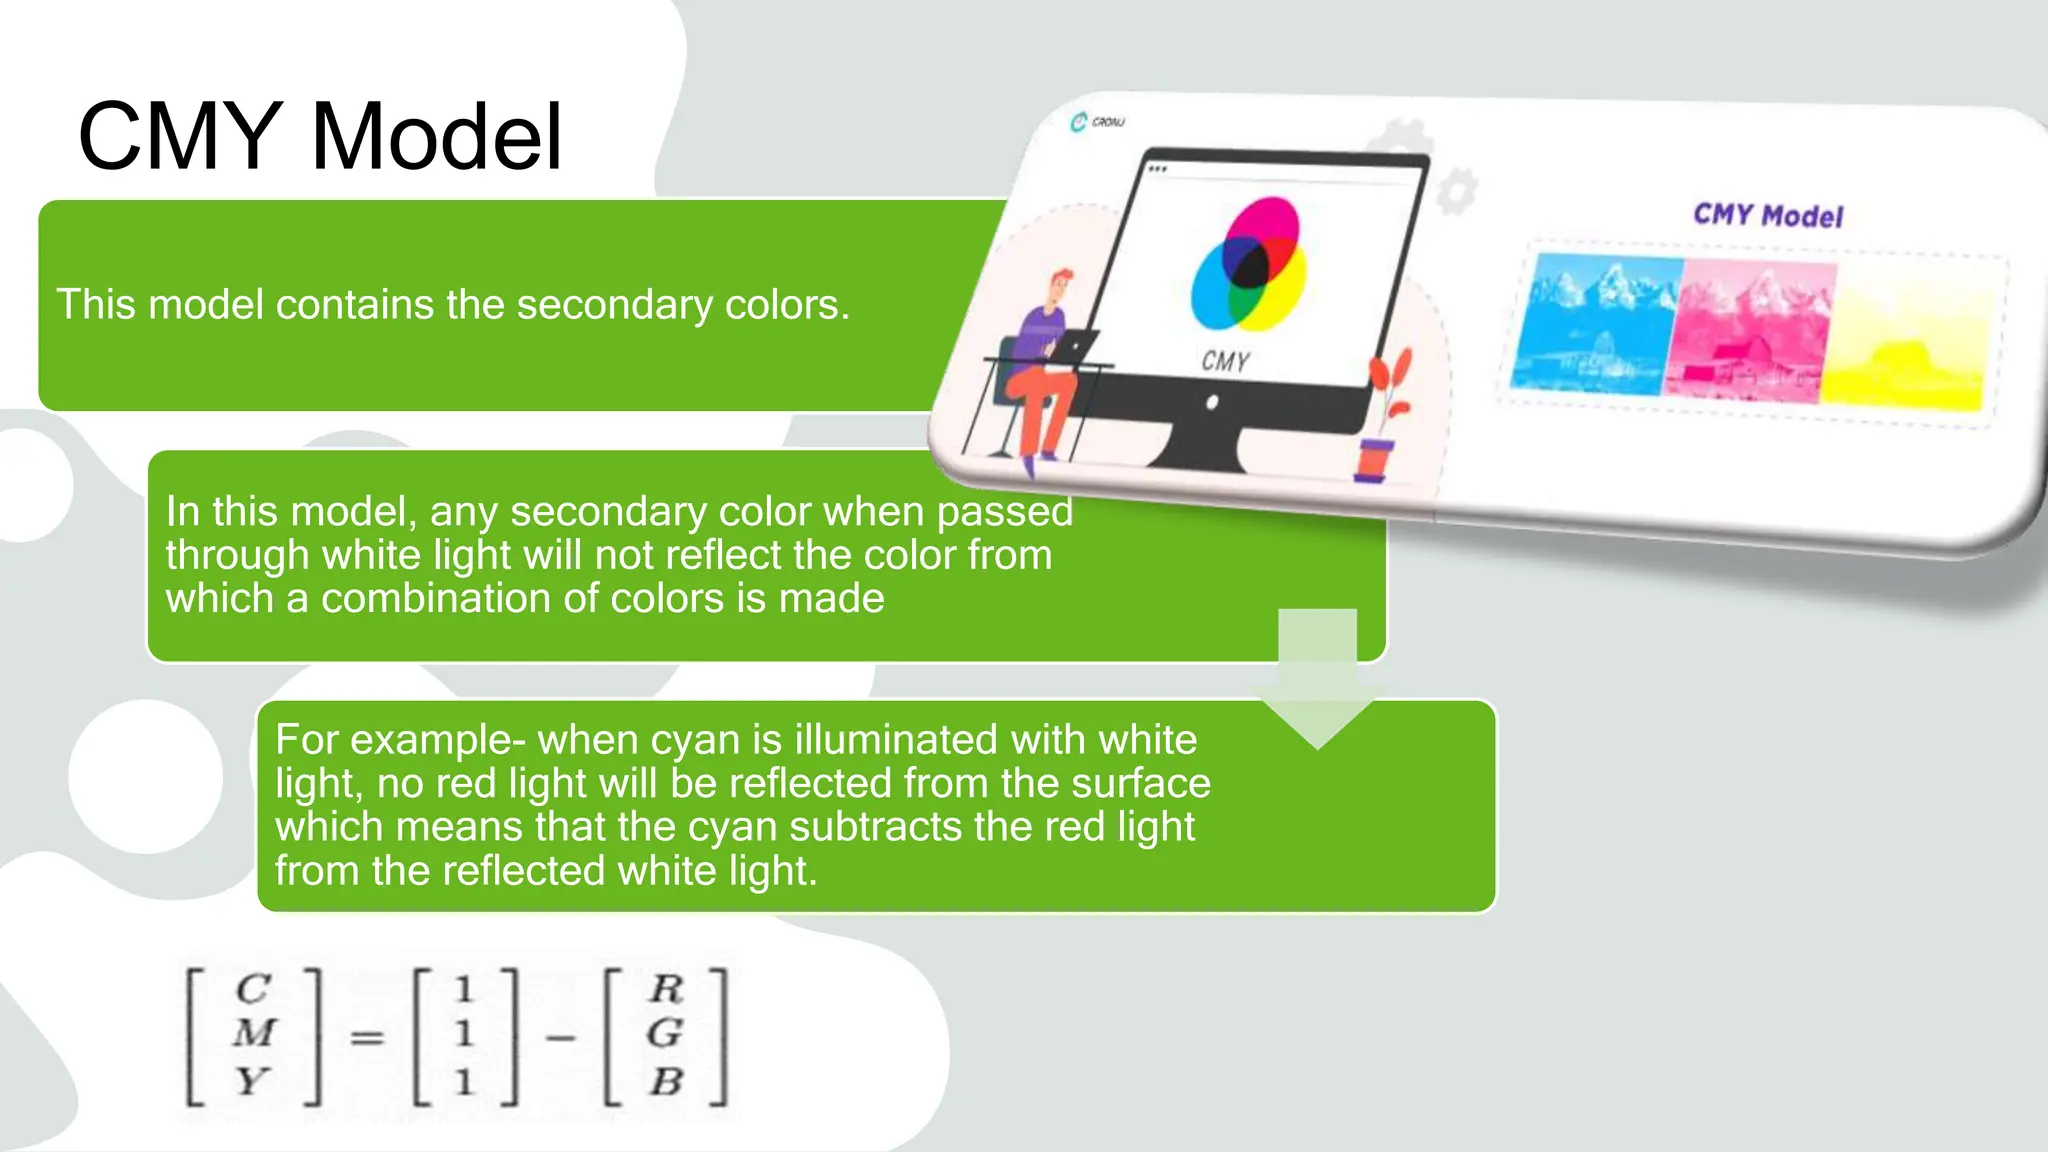
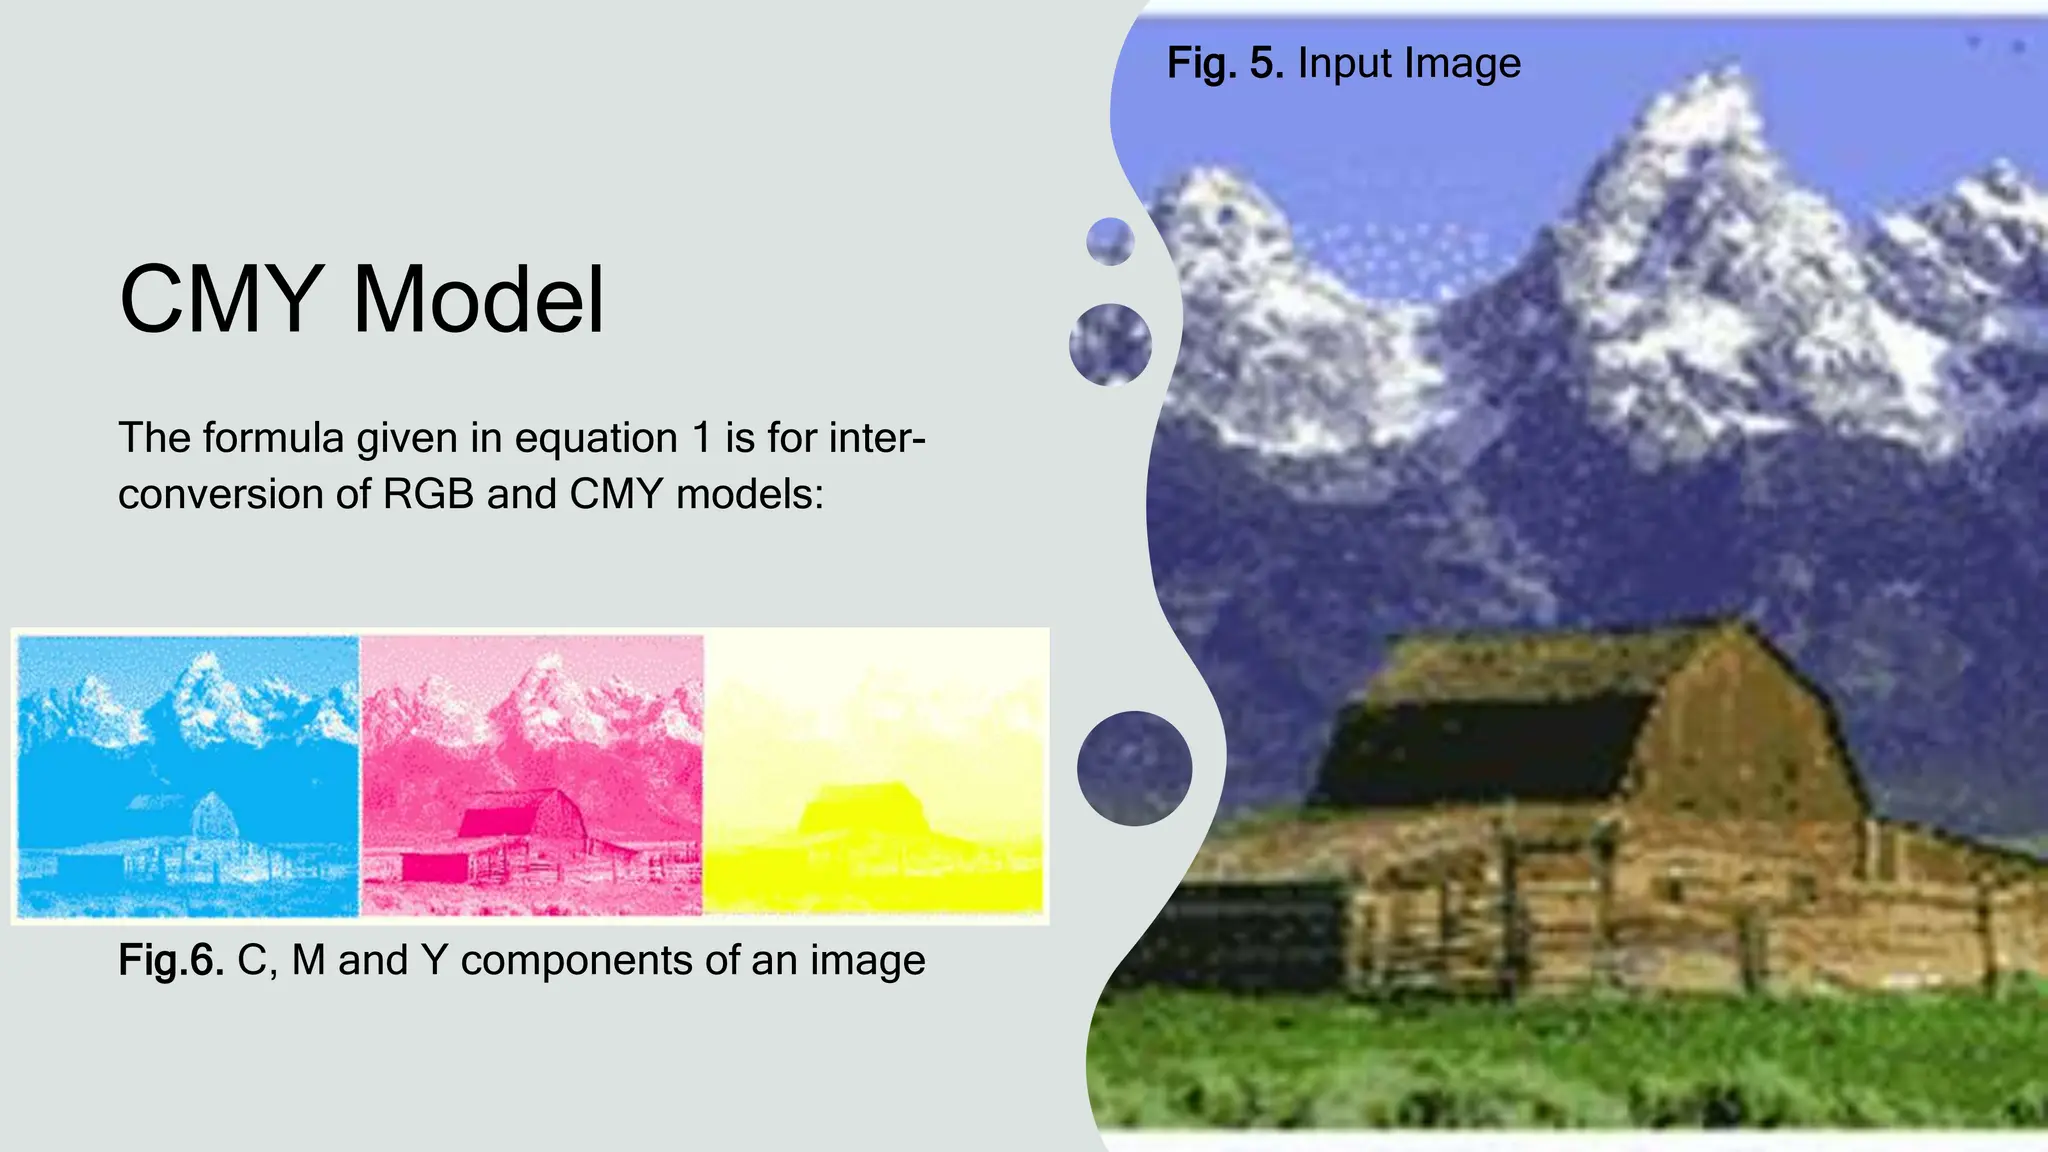
- How RGB, CMY, and other color models represent and define color using combinations of primary/secondary colors.
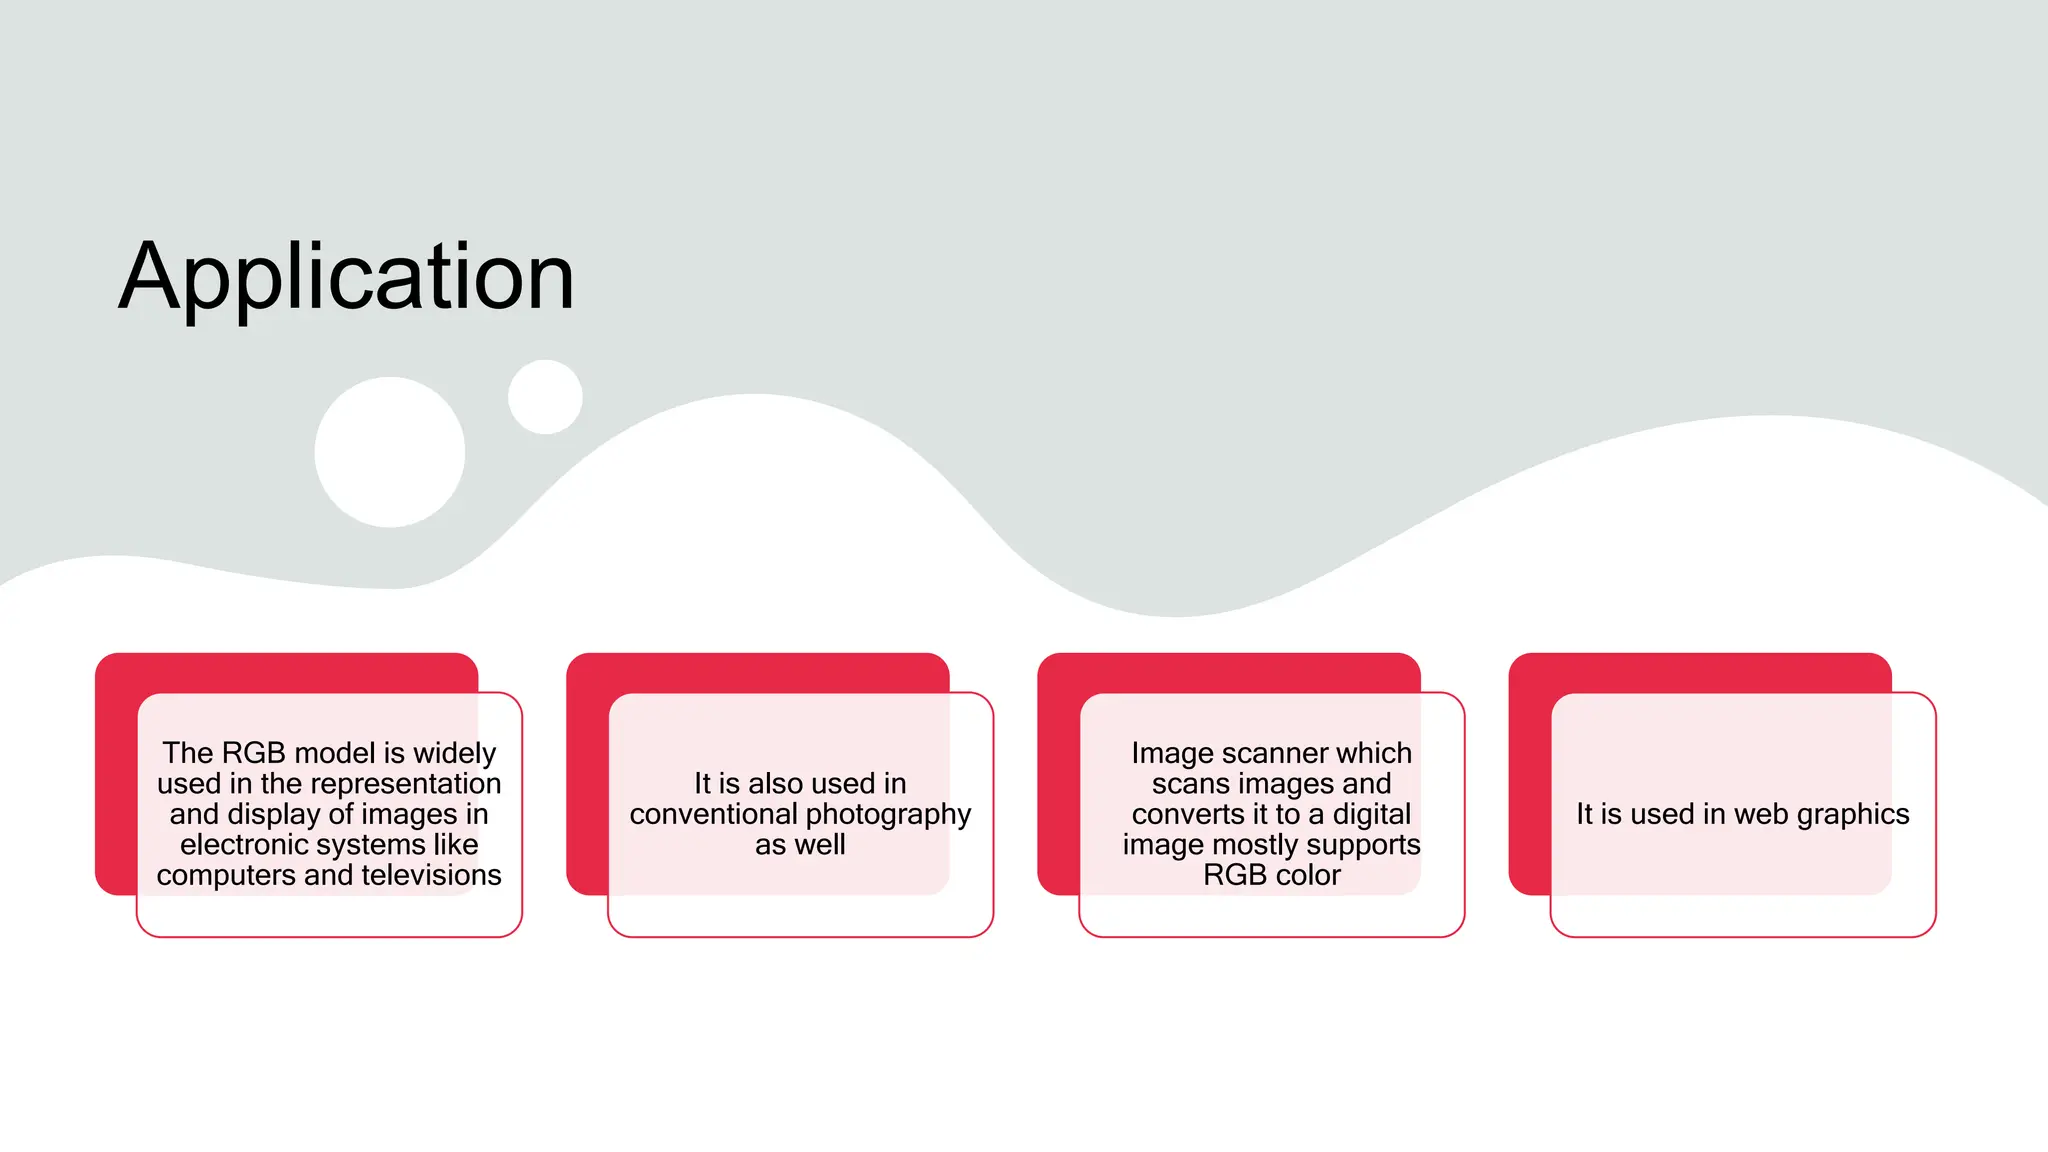
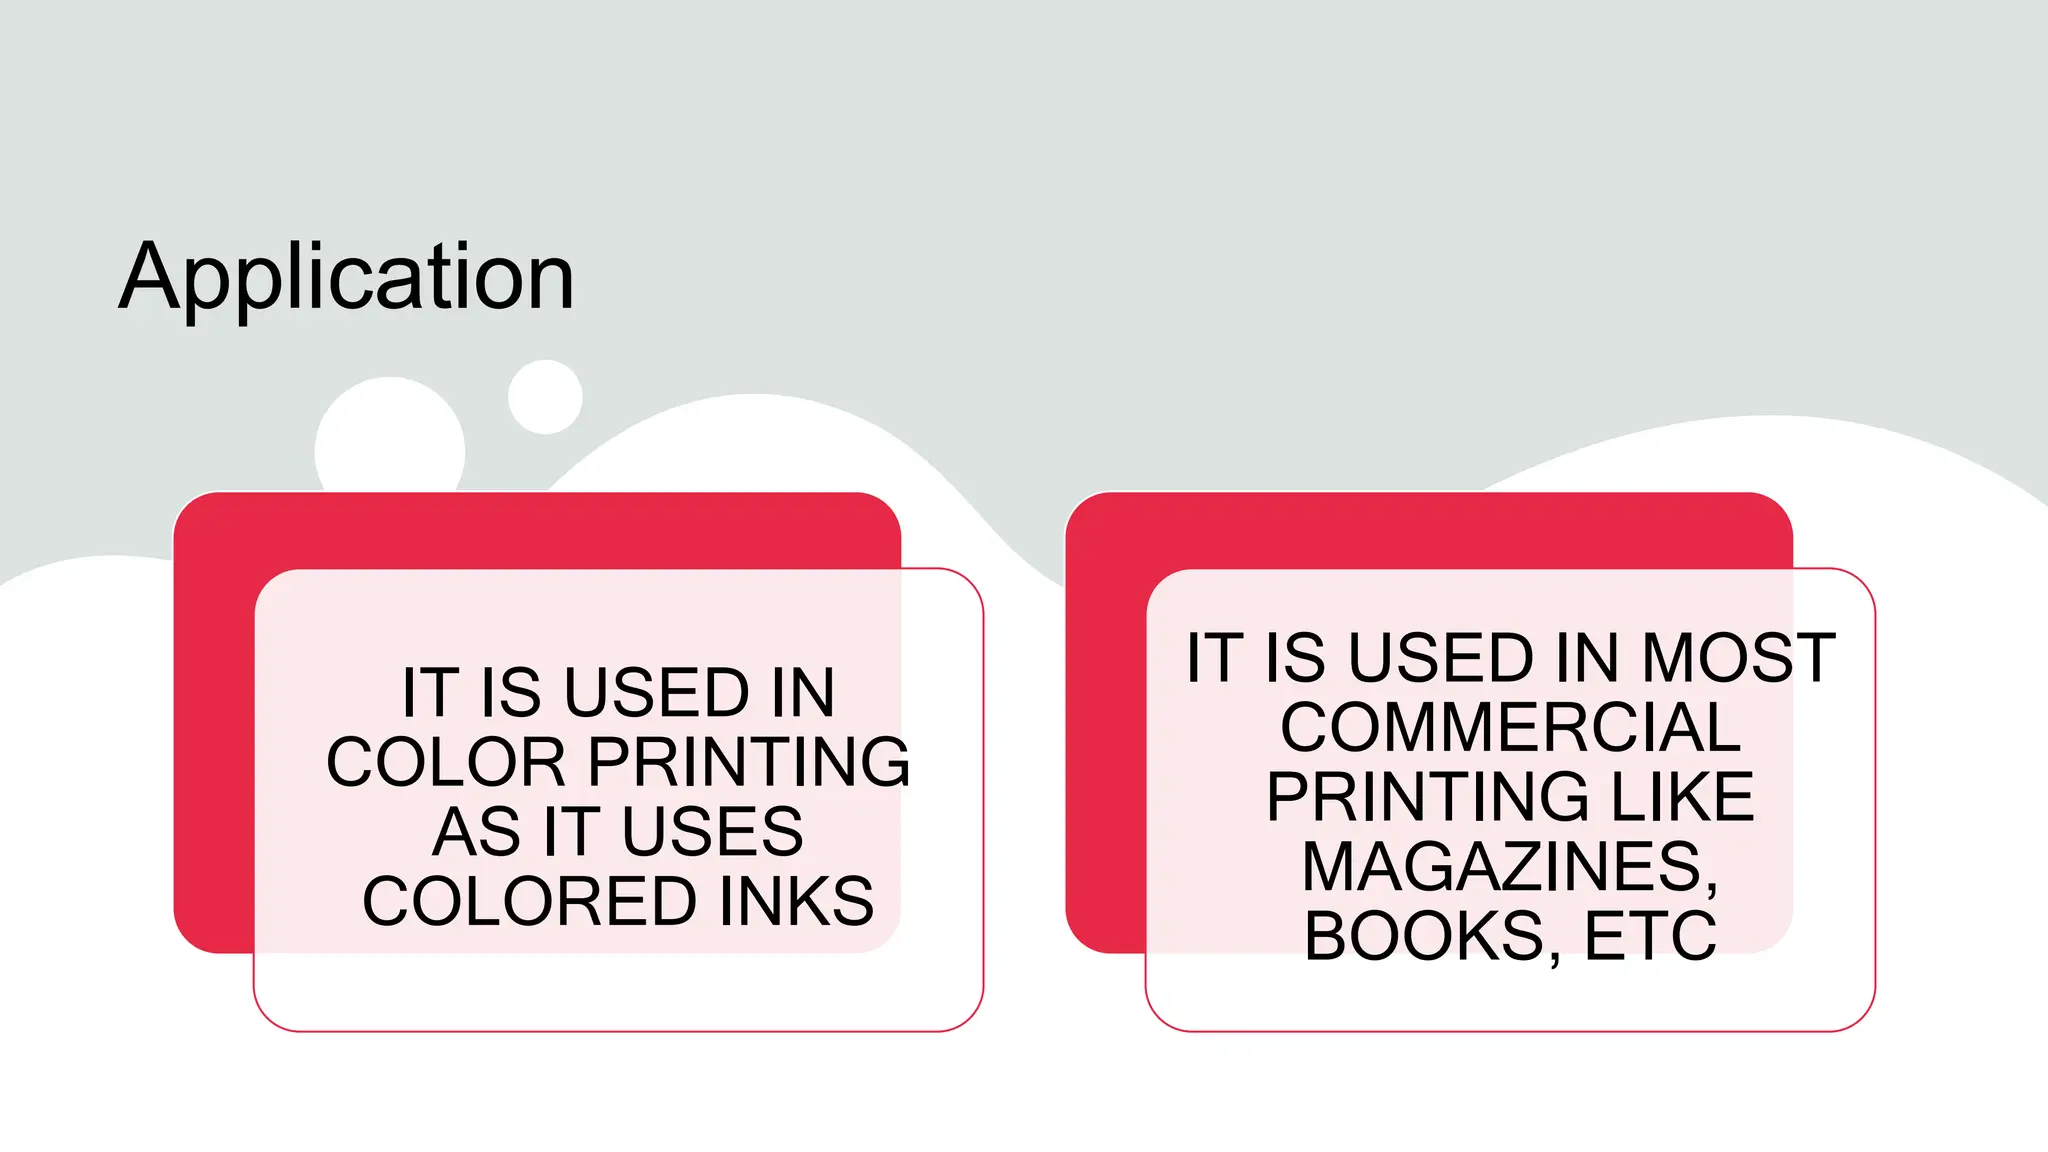
- The differences between color models and how they are used for things like printing (CMY) vs displays (RGB).
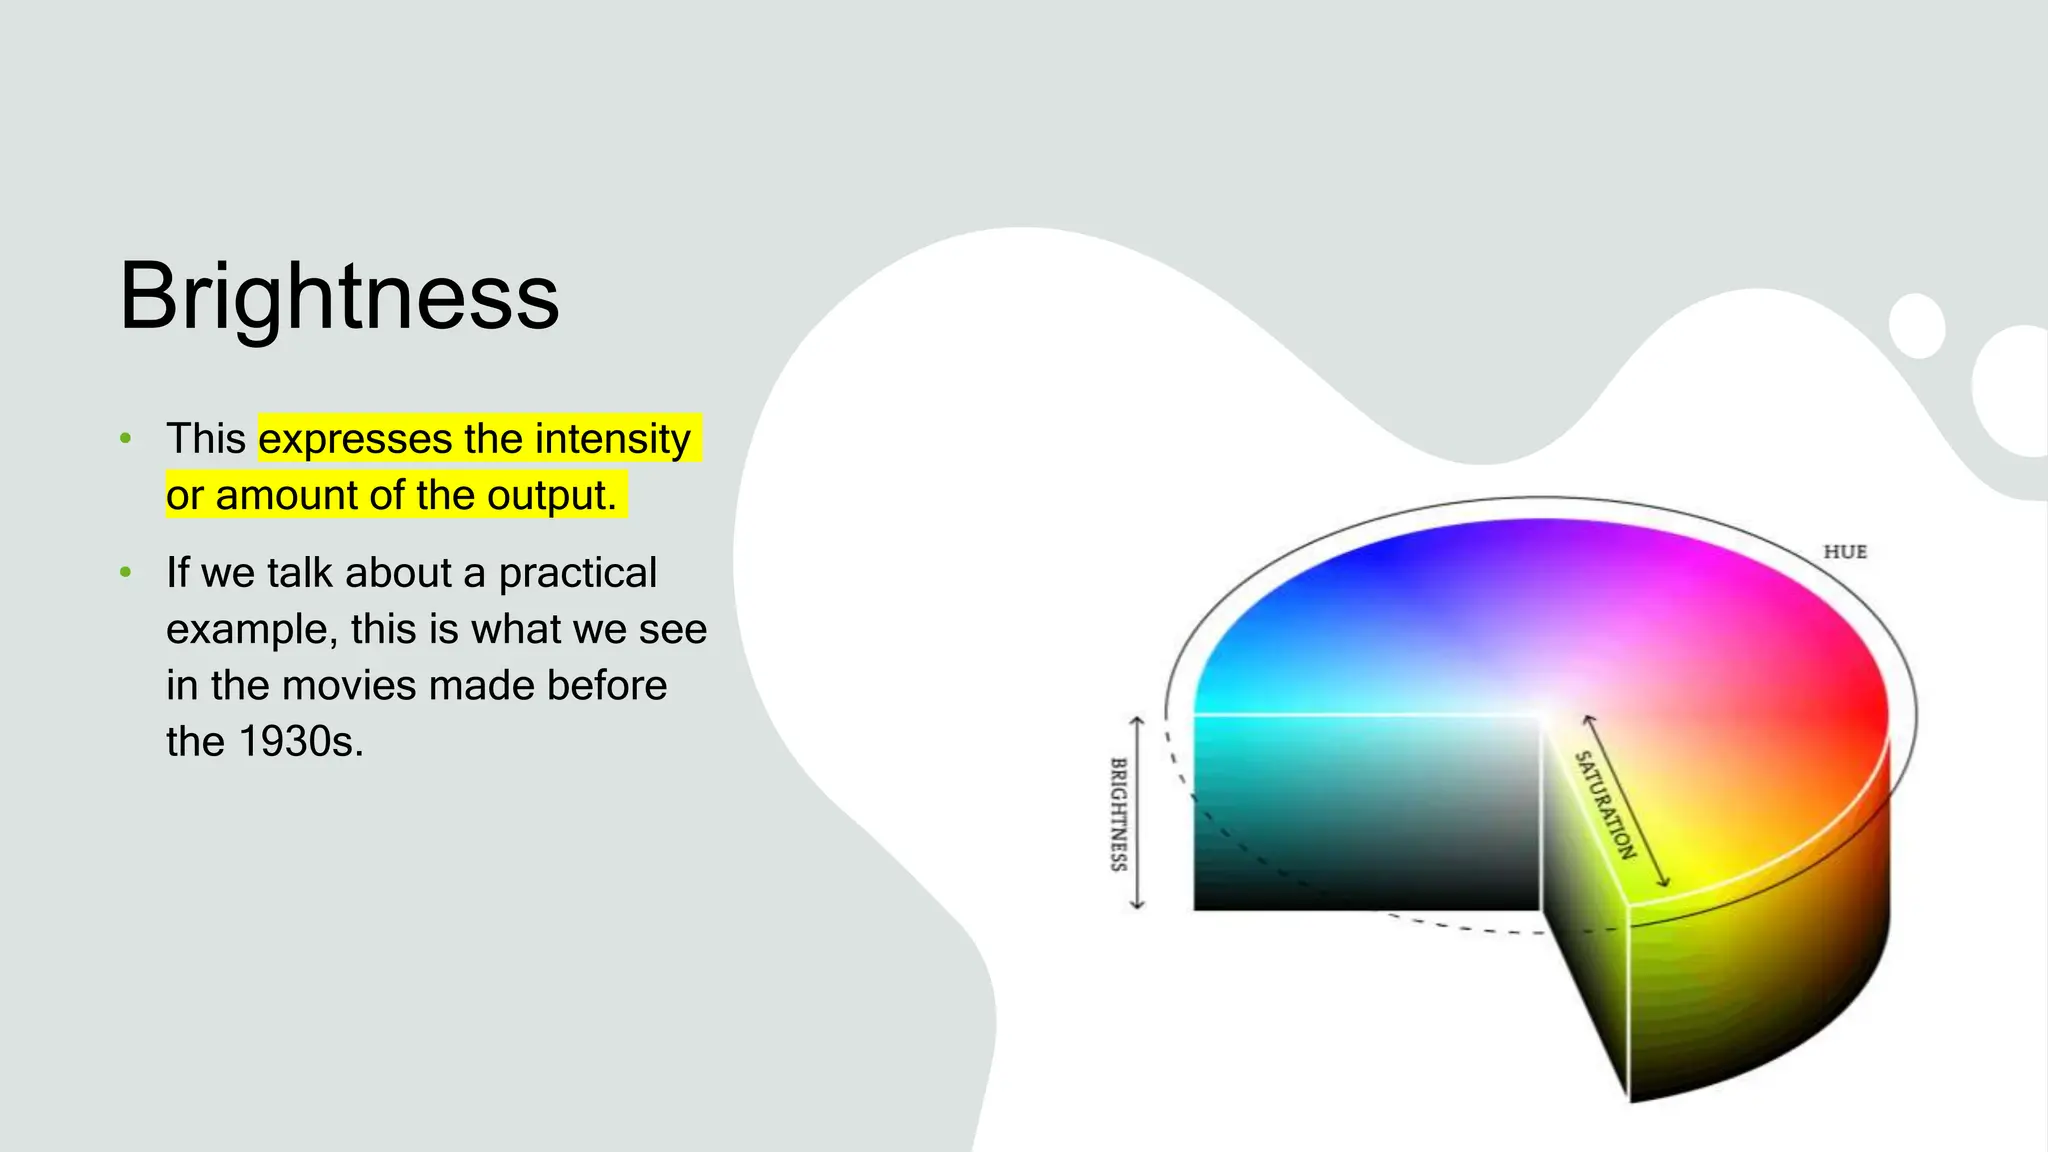
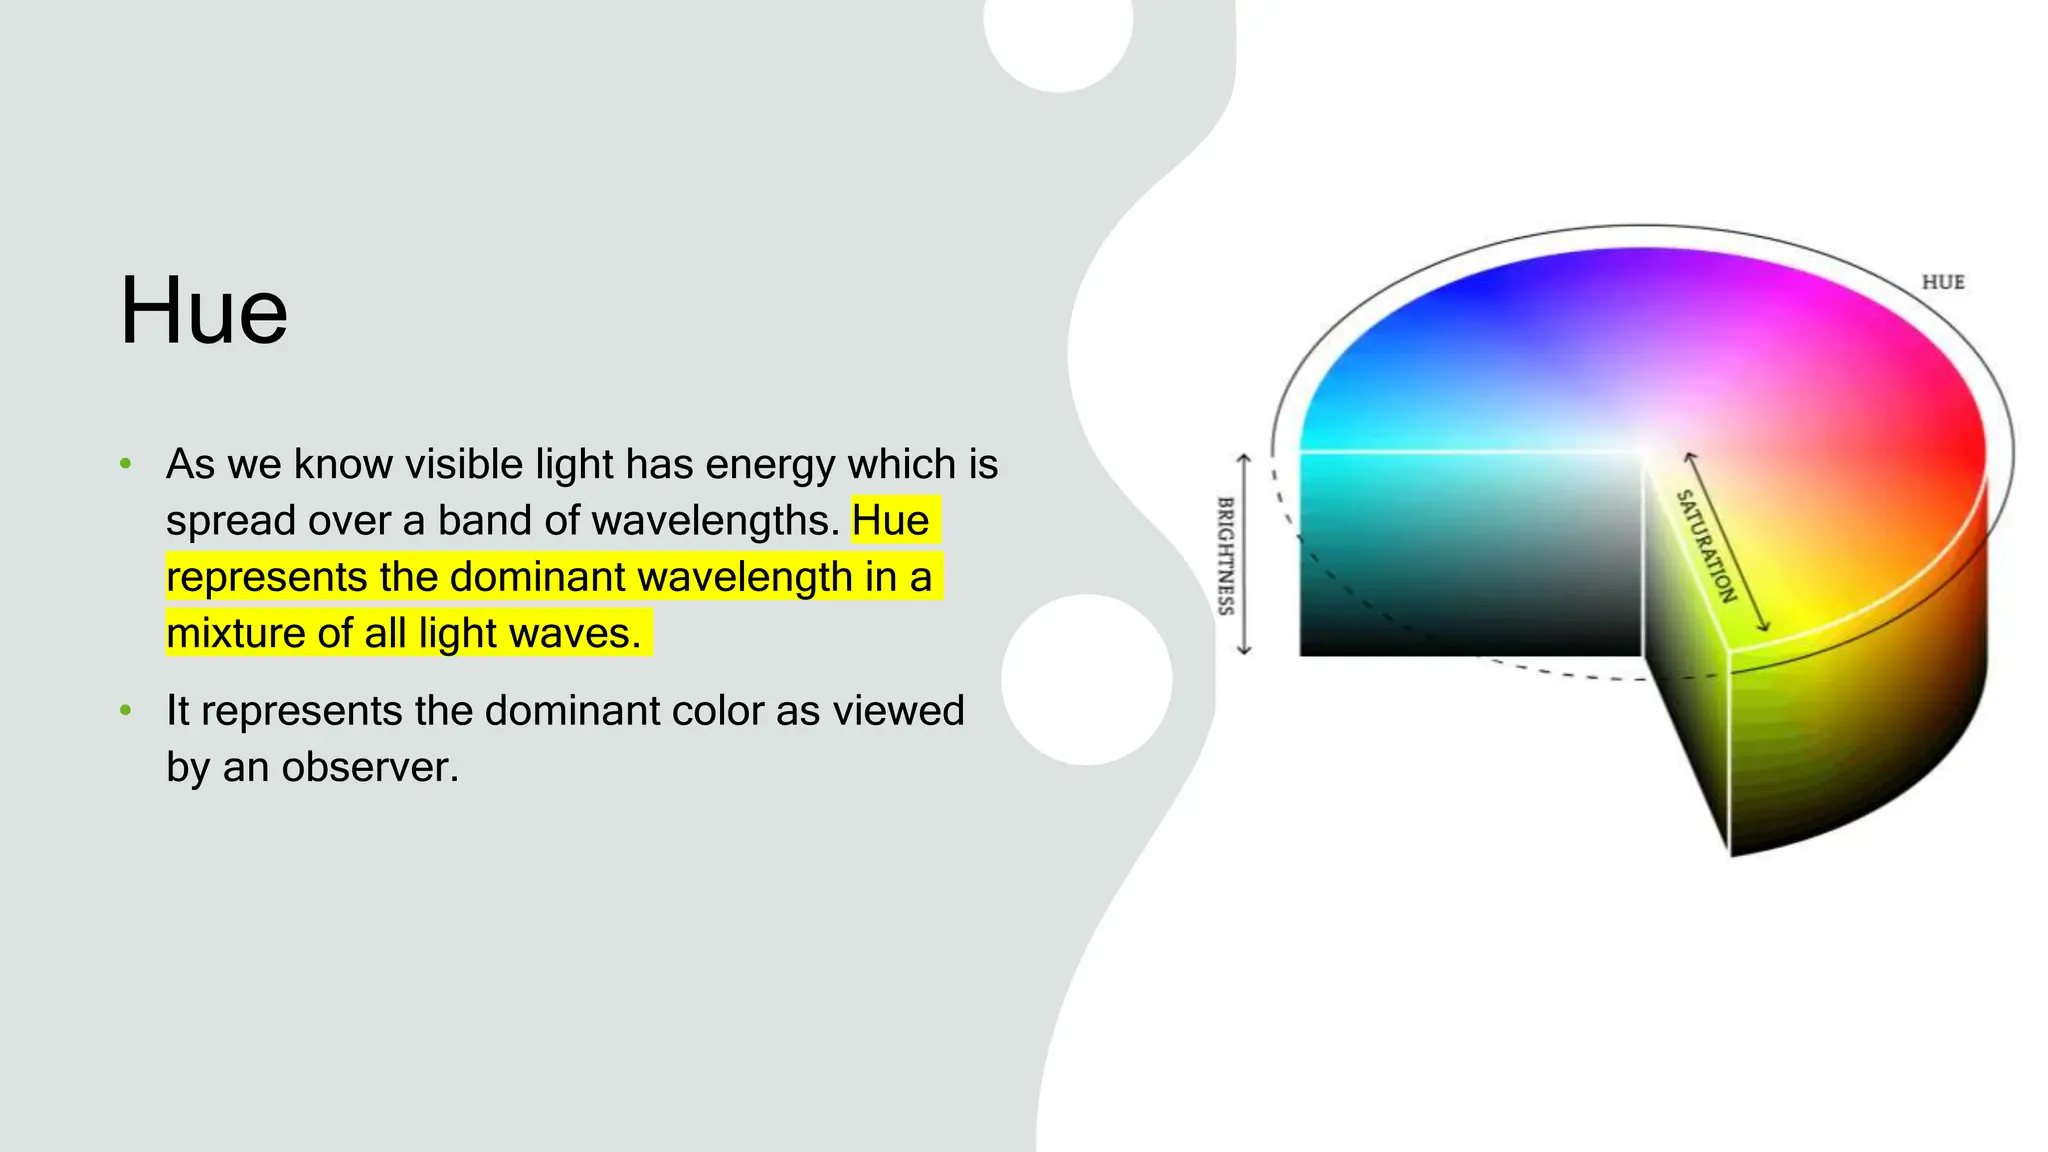
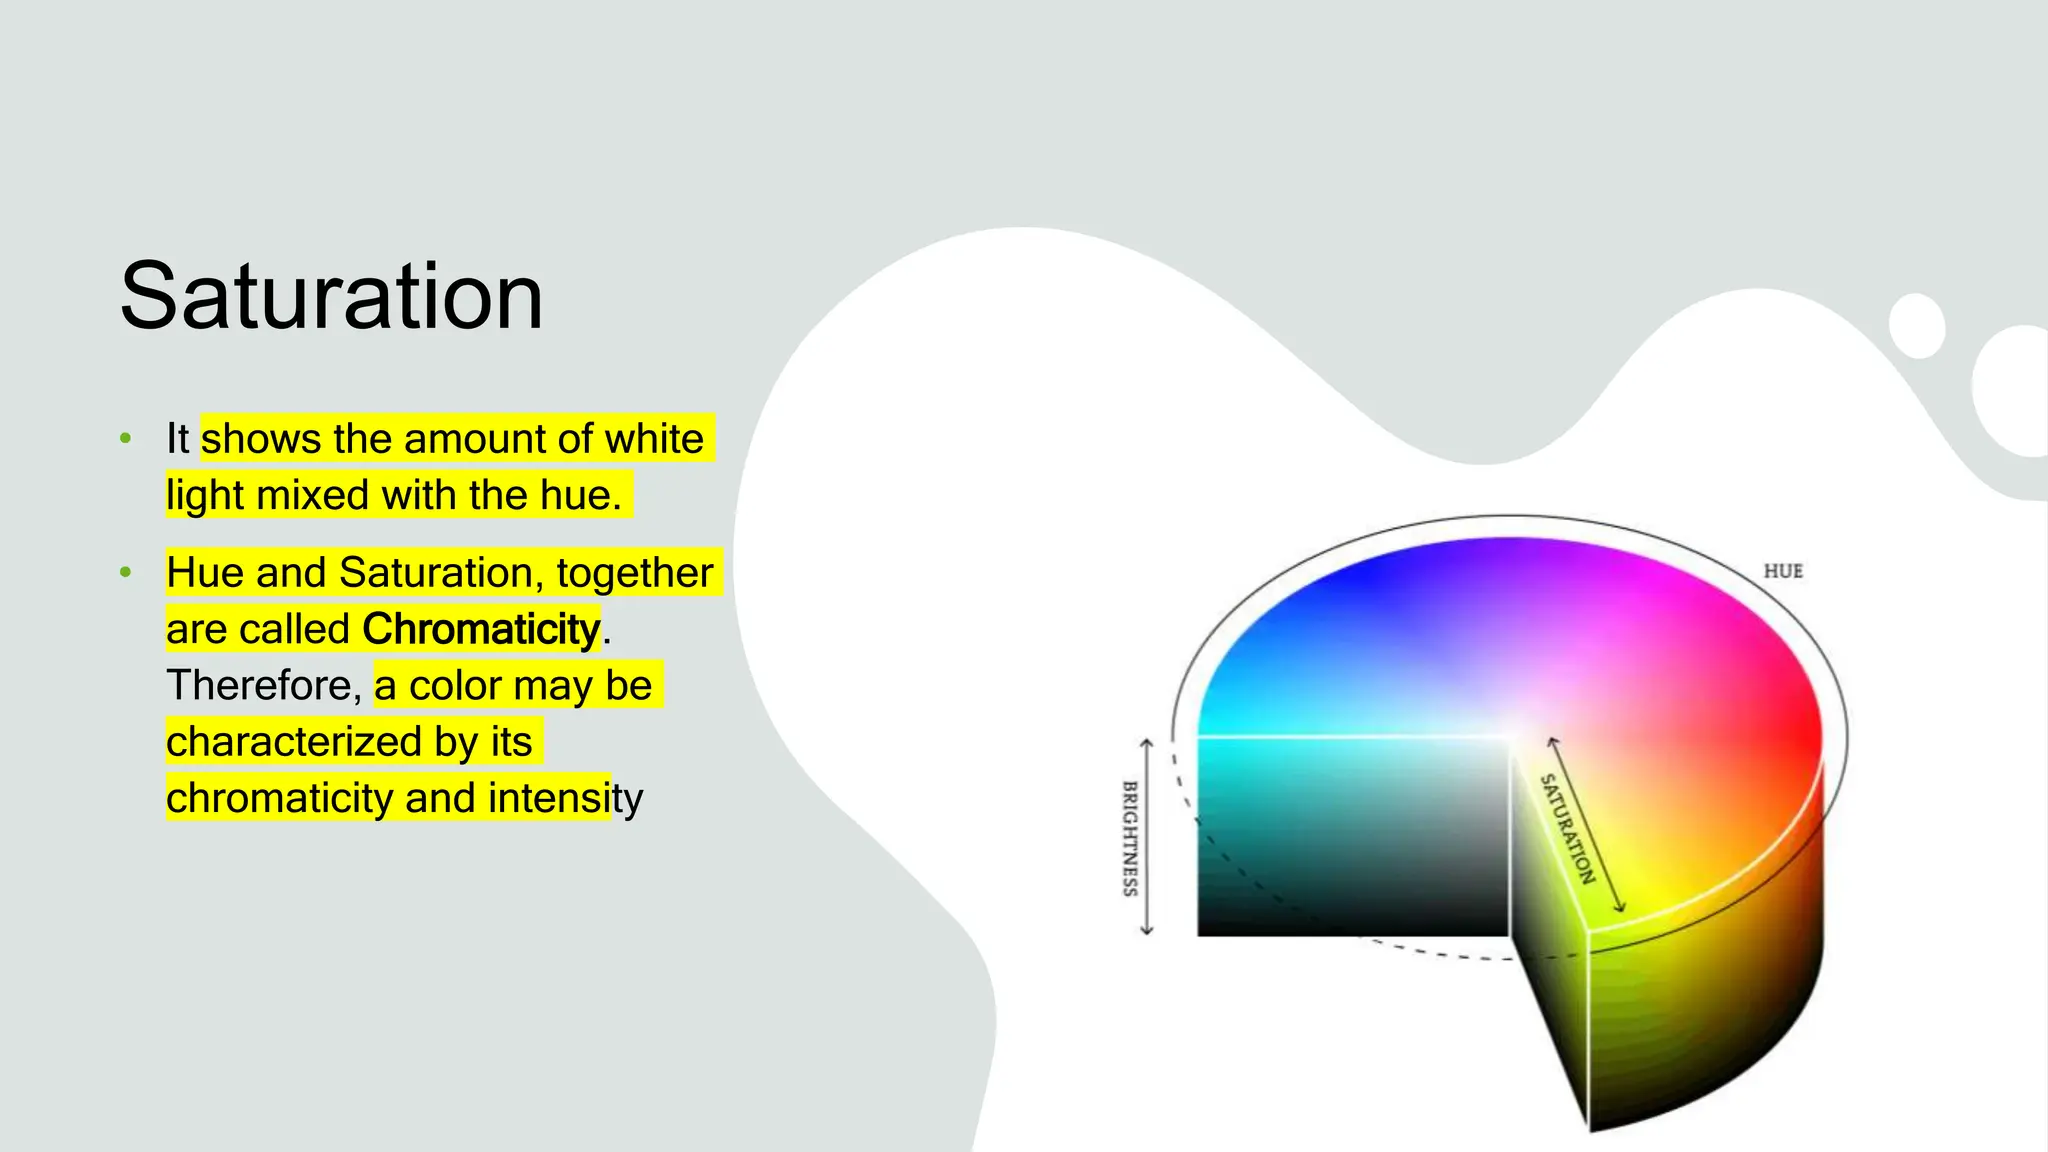
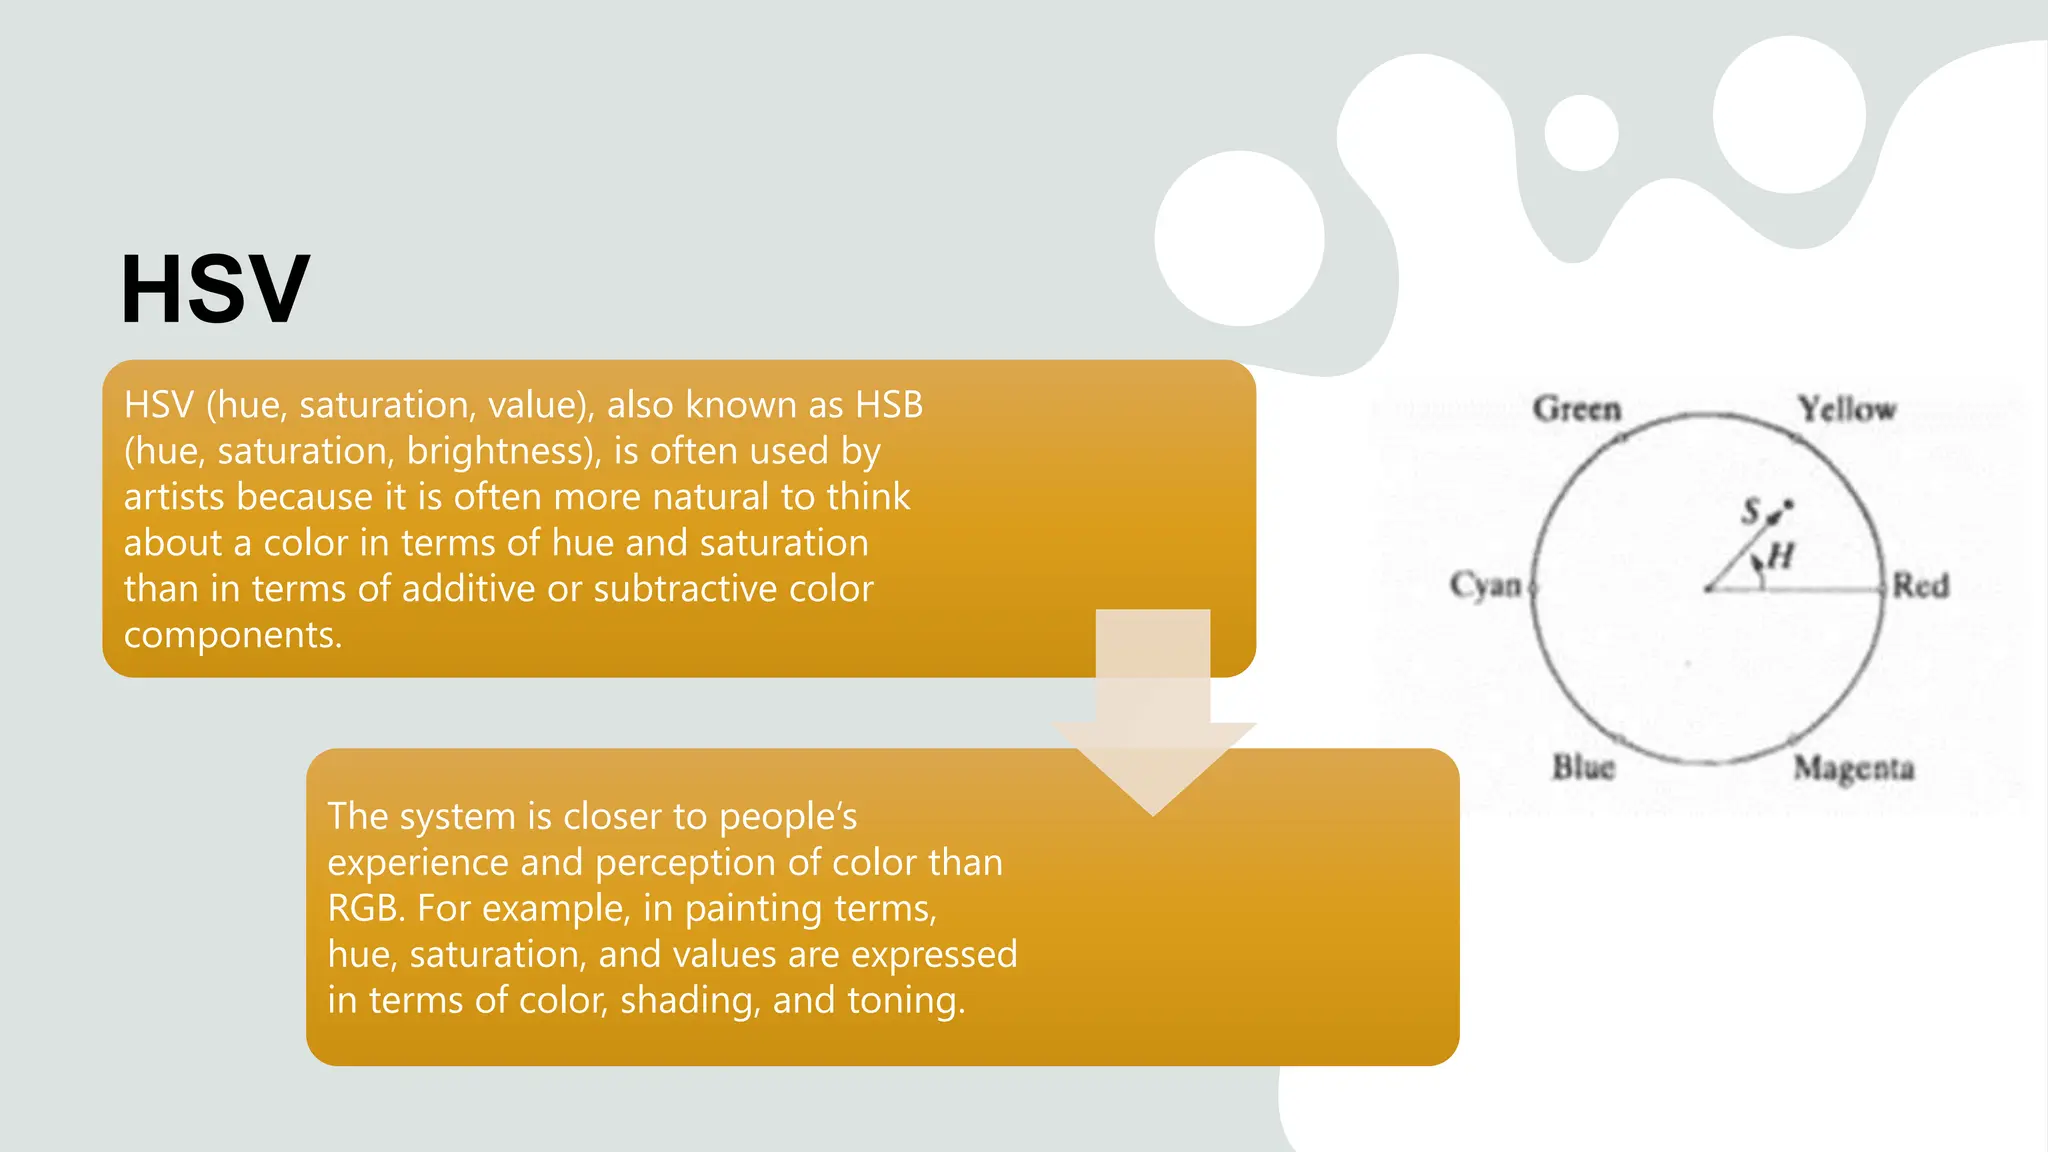
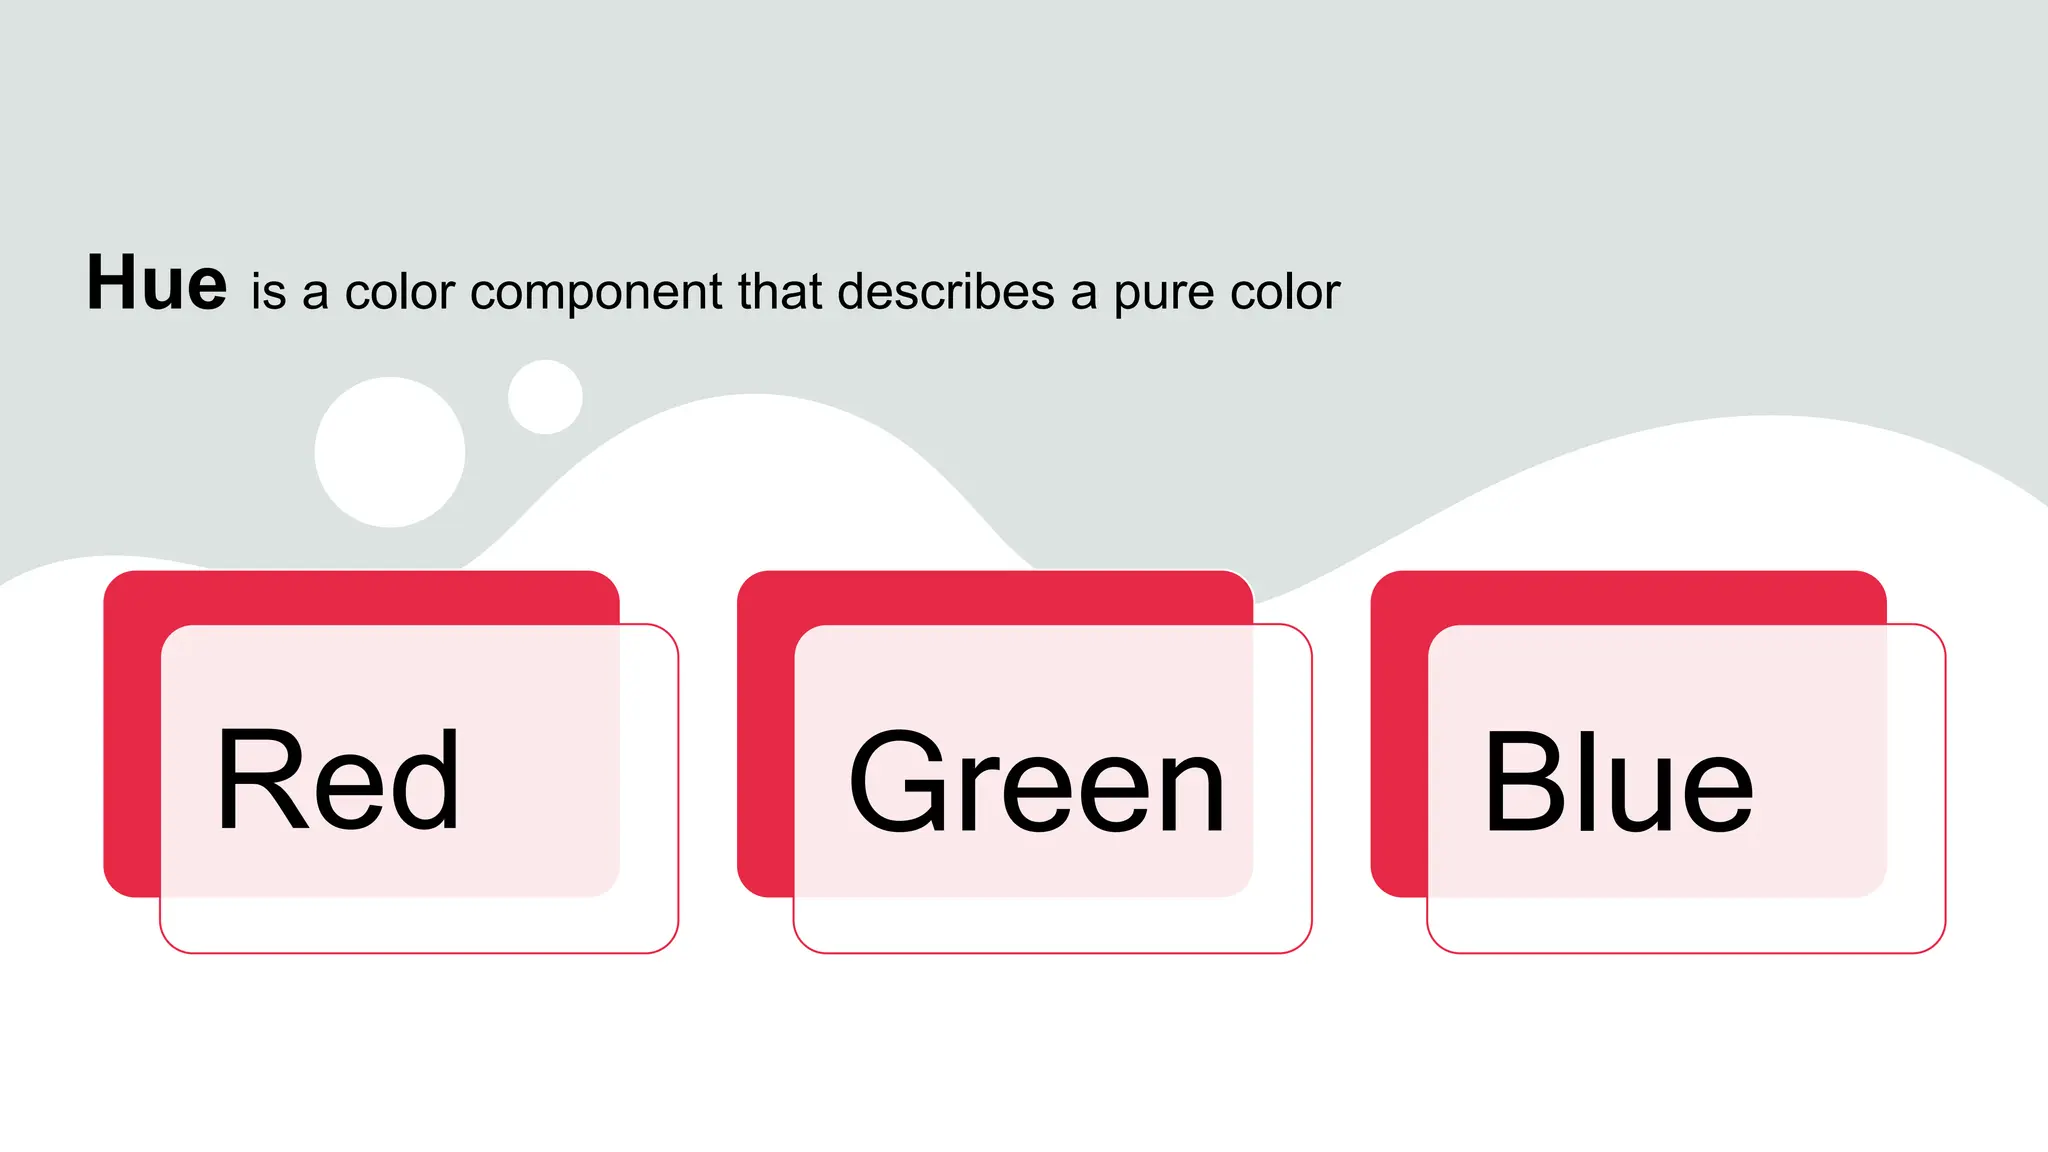
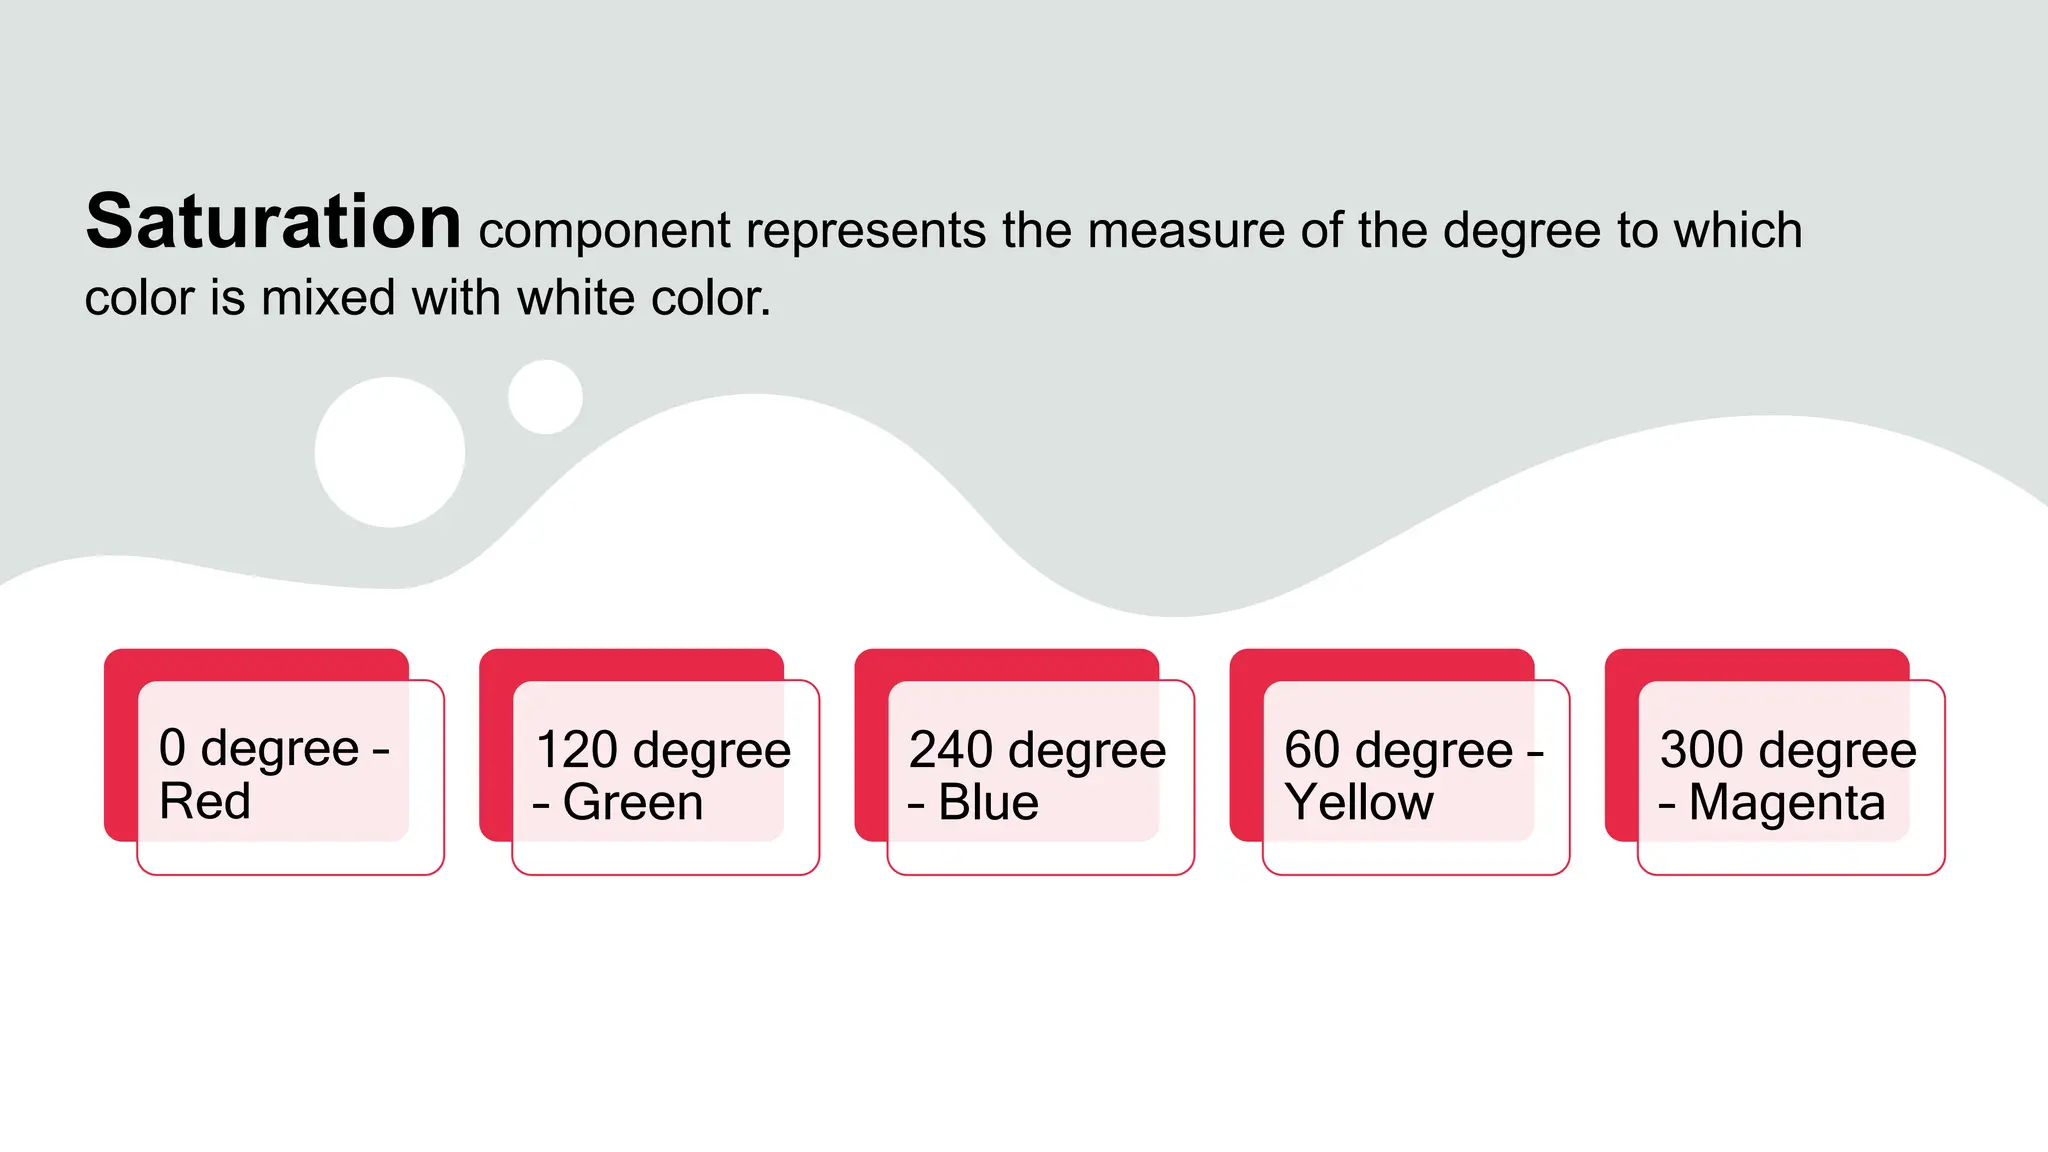
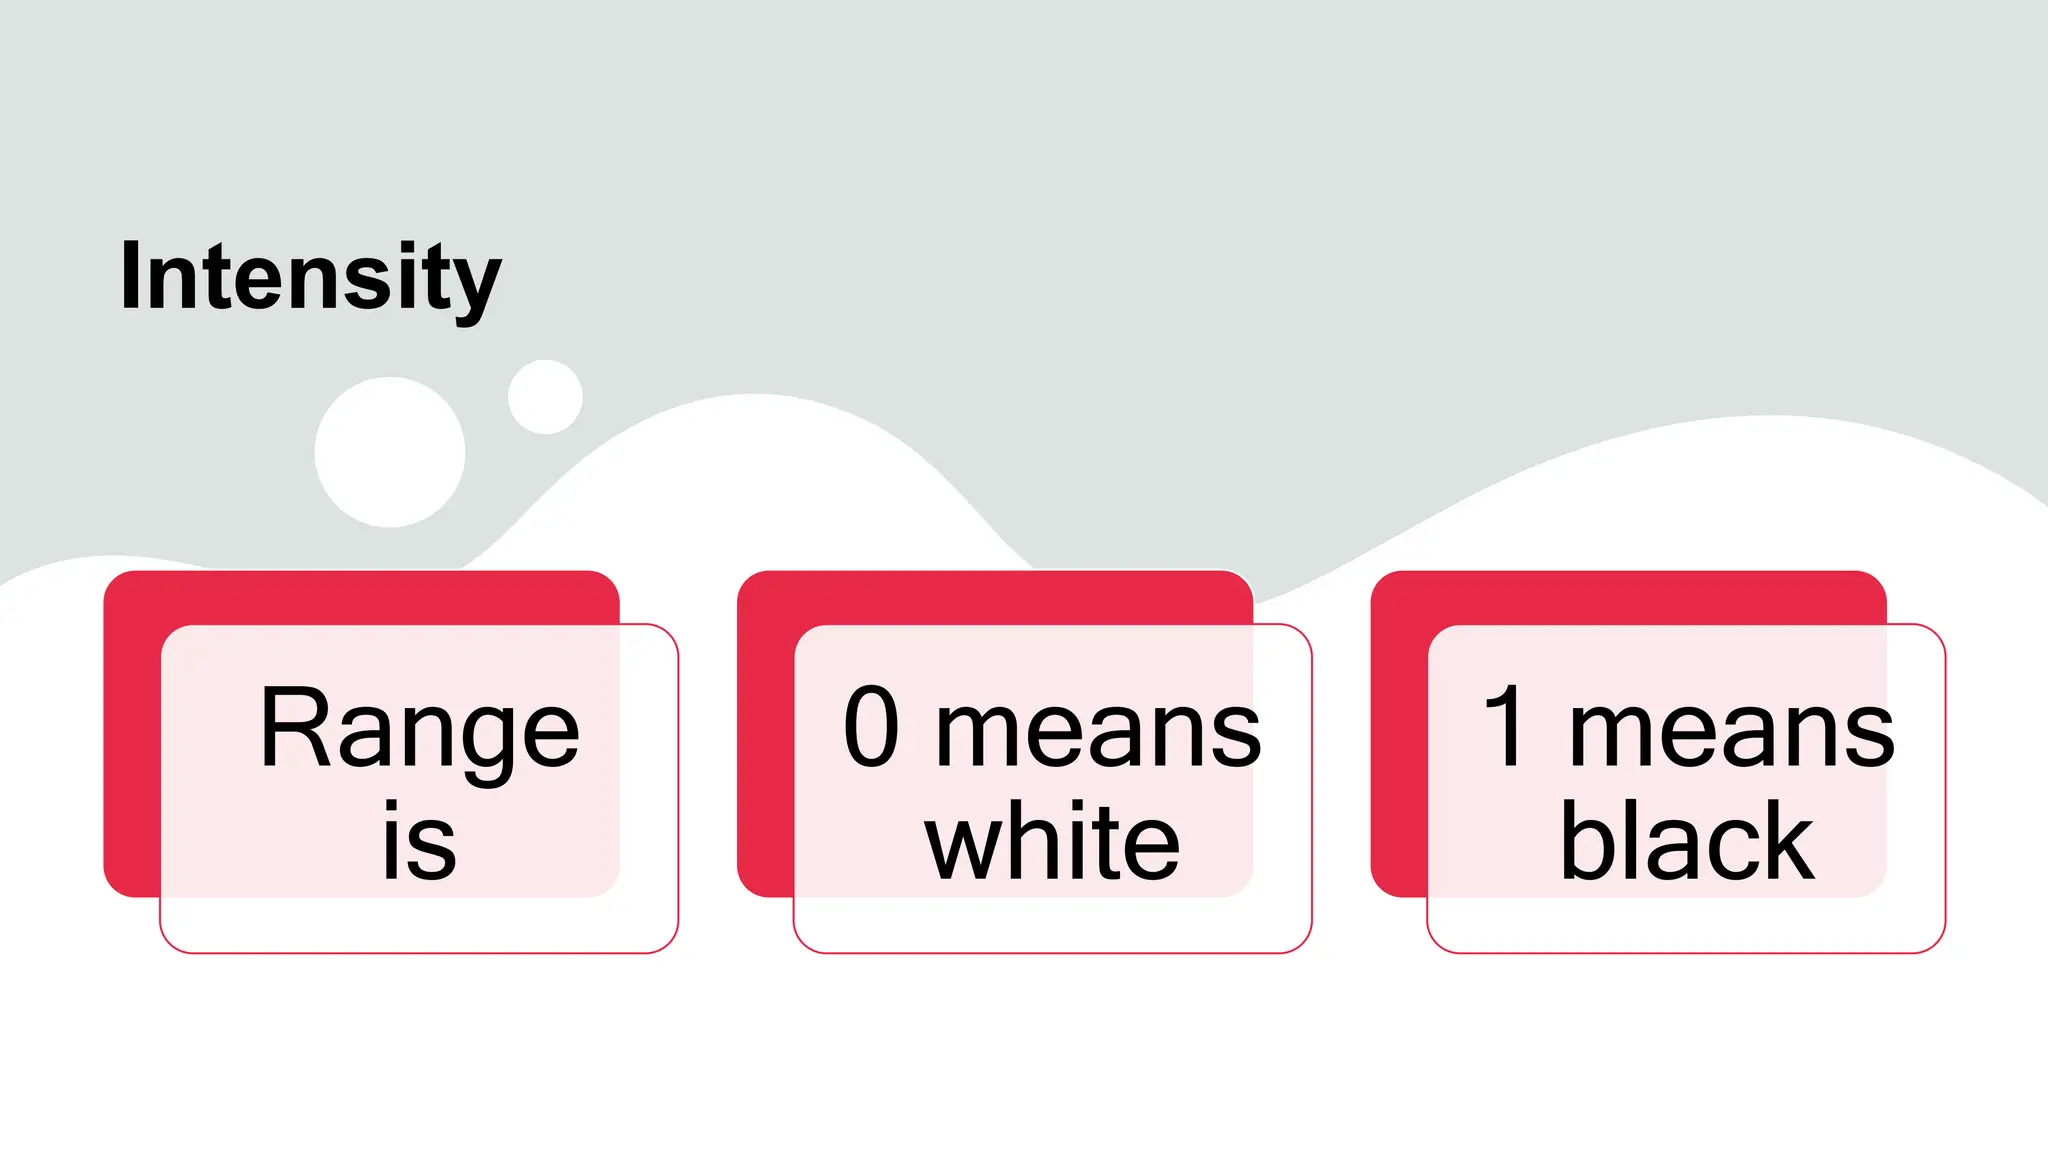
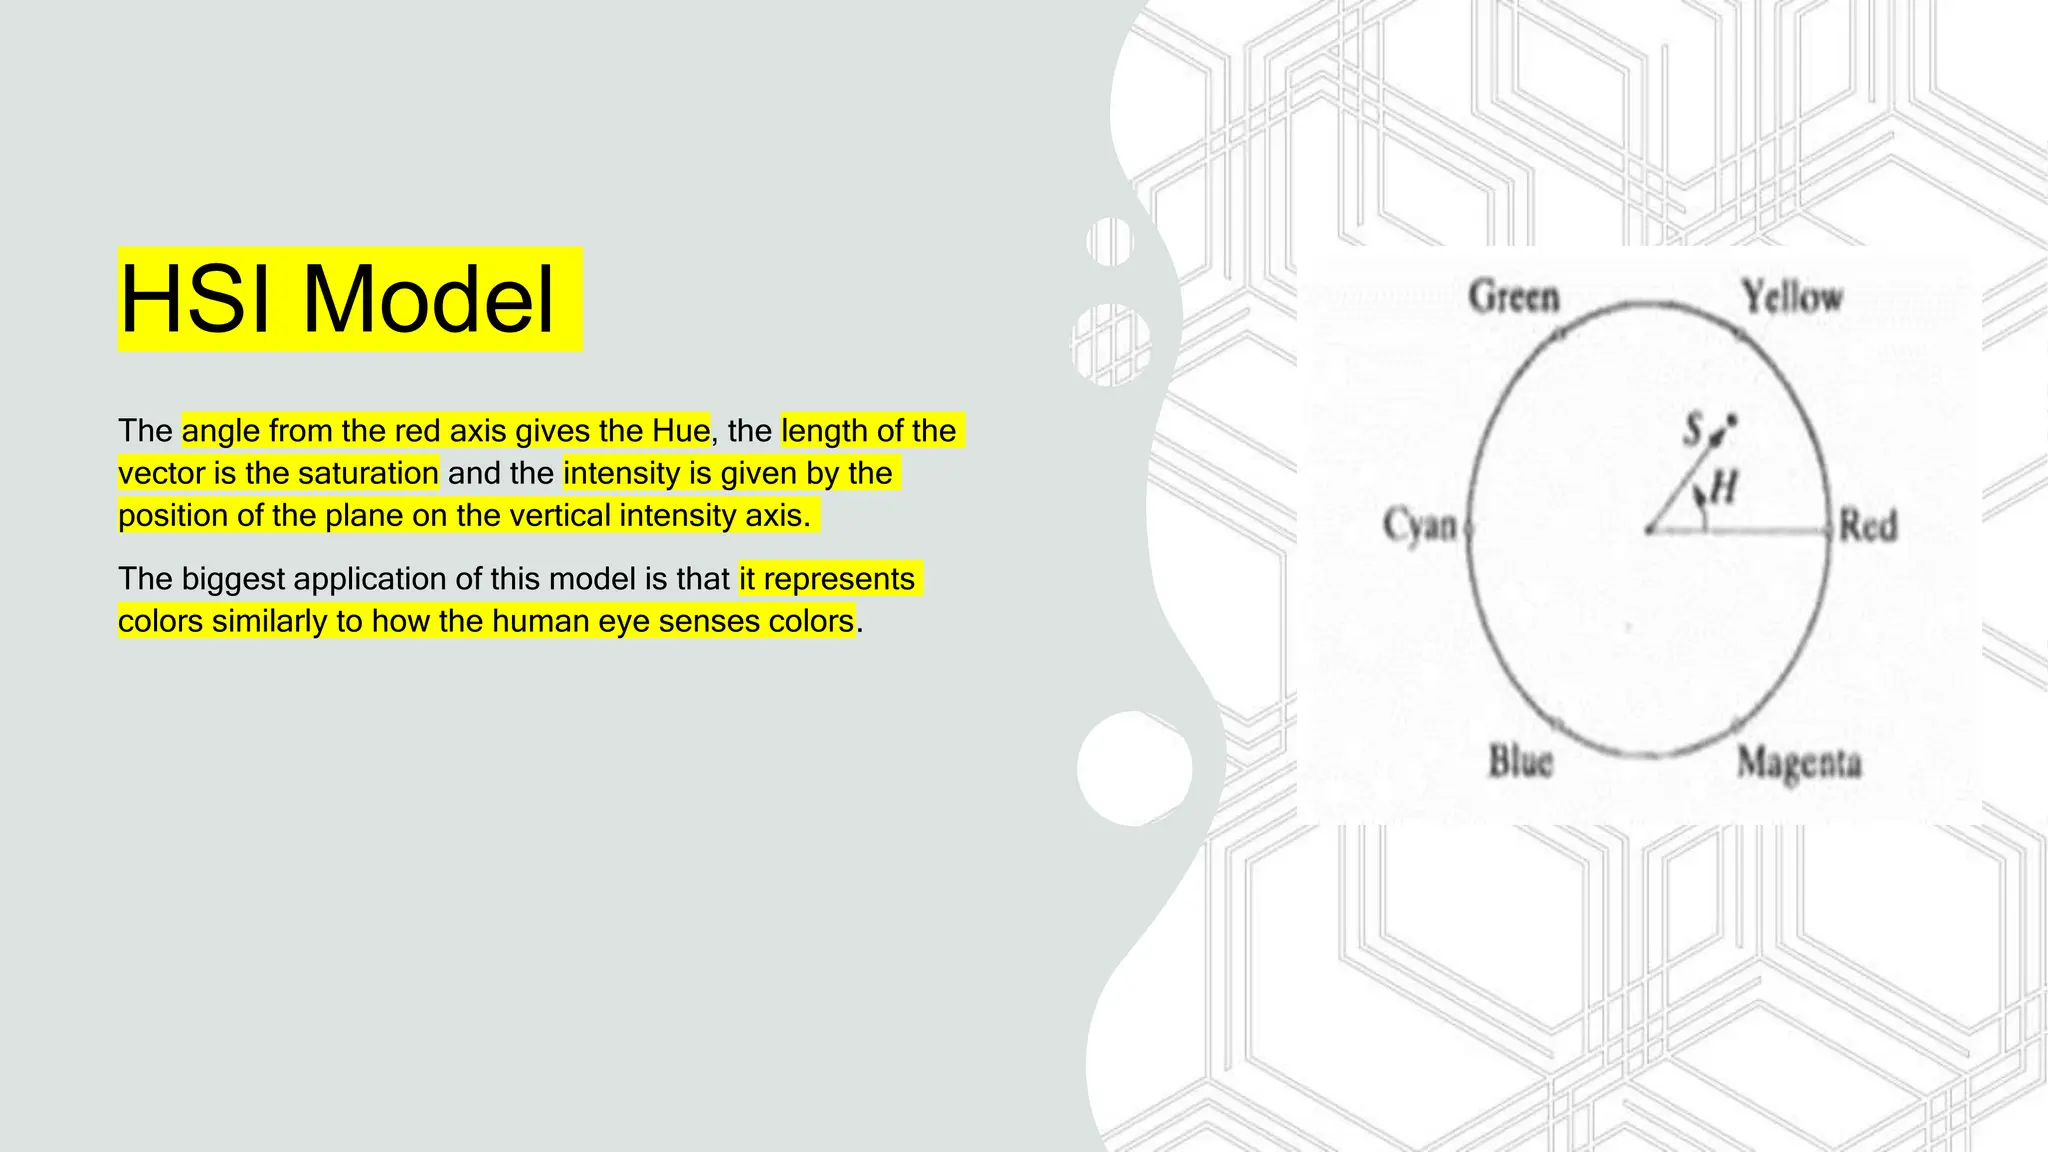
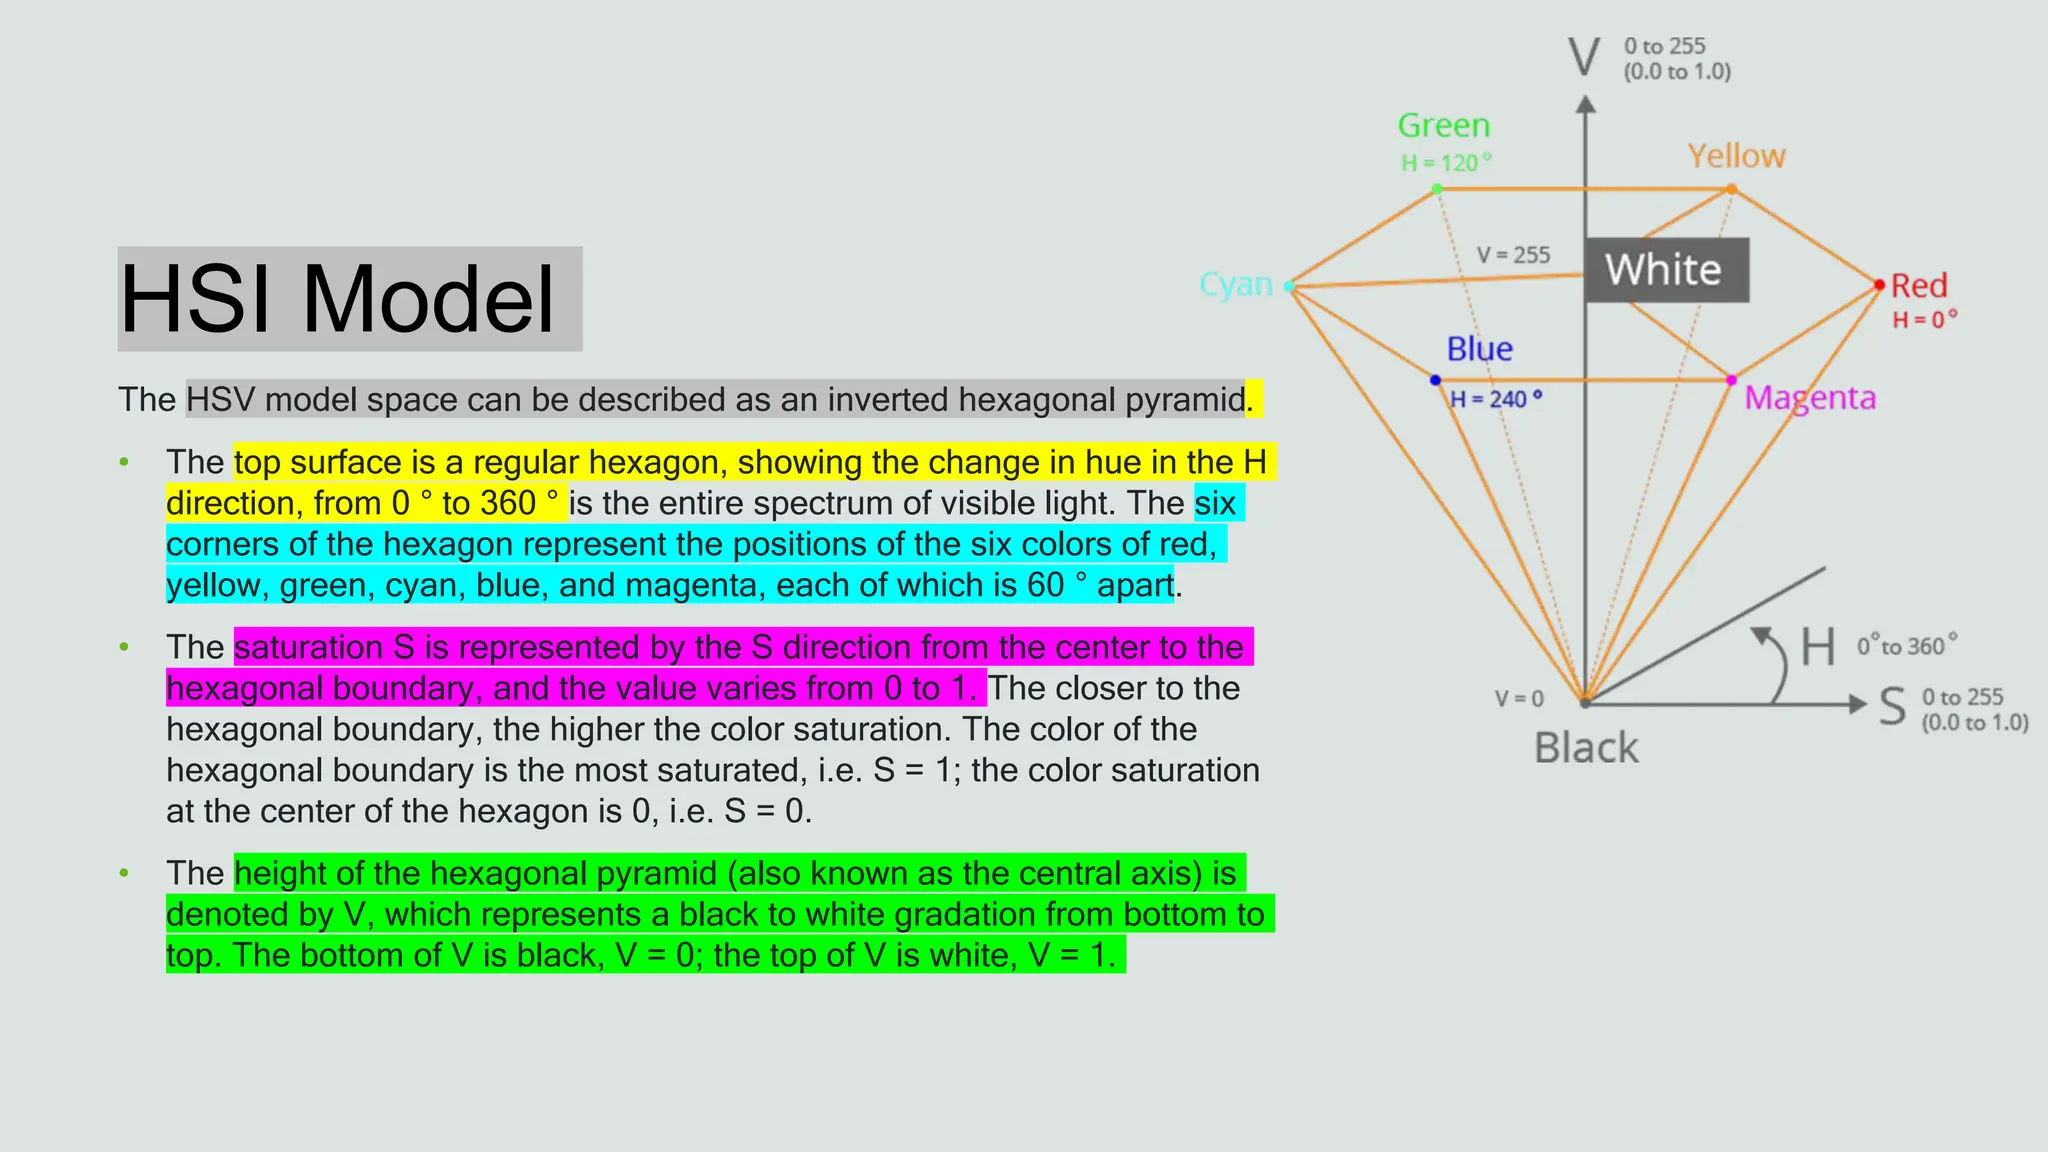
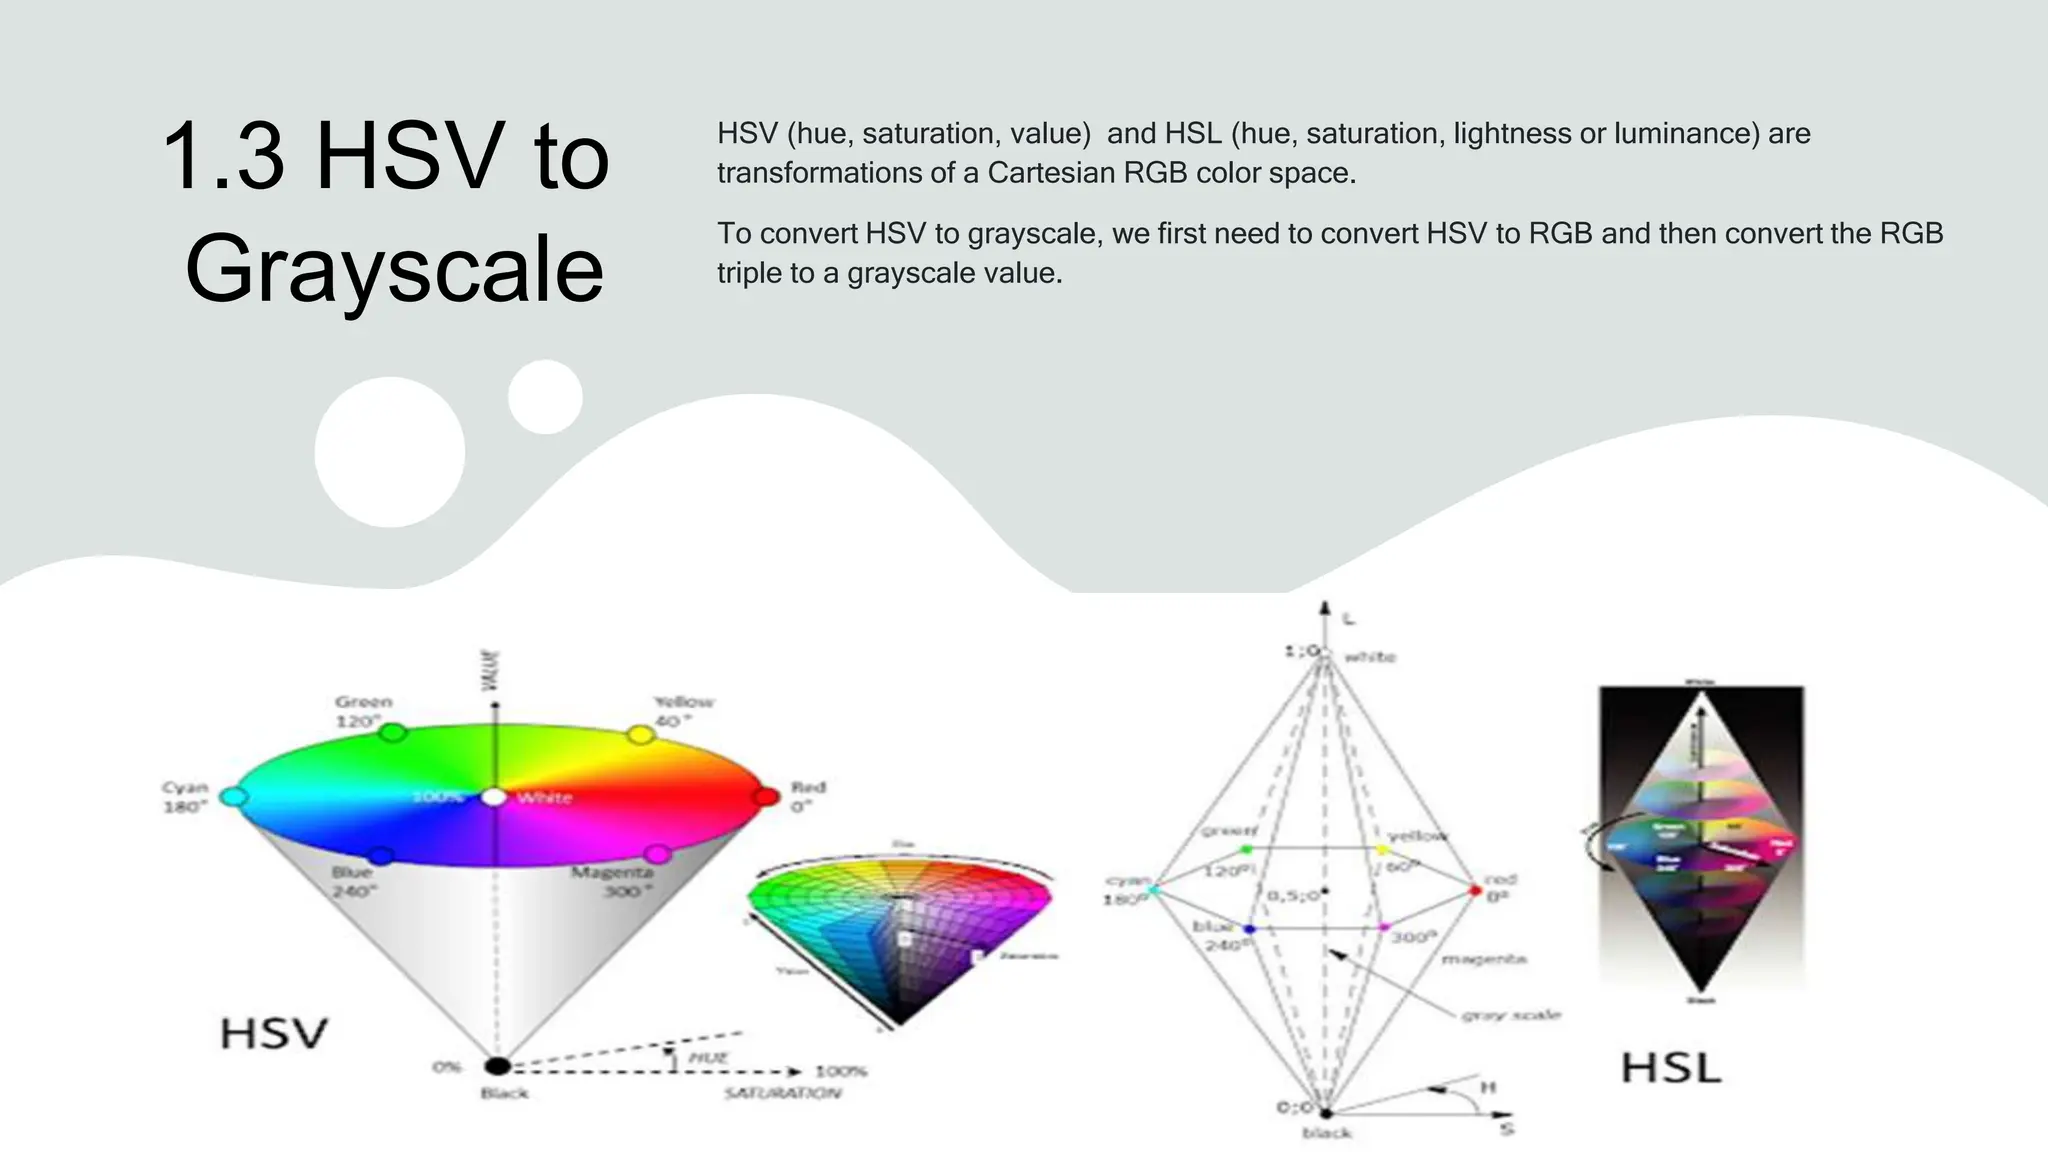
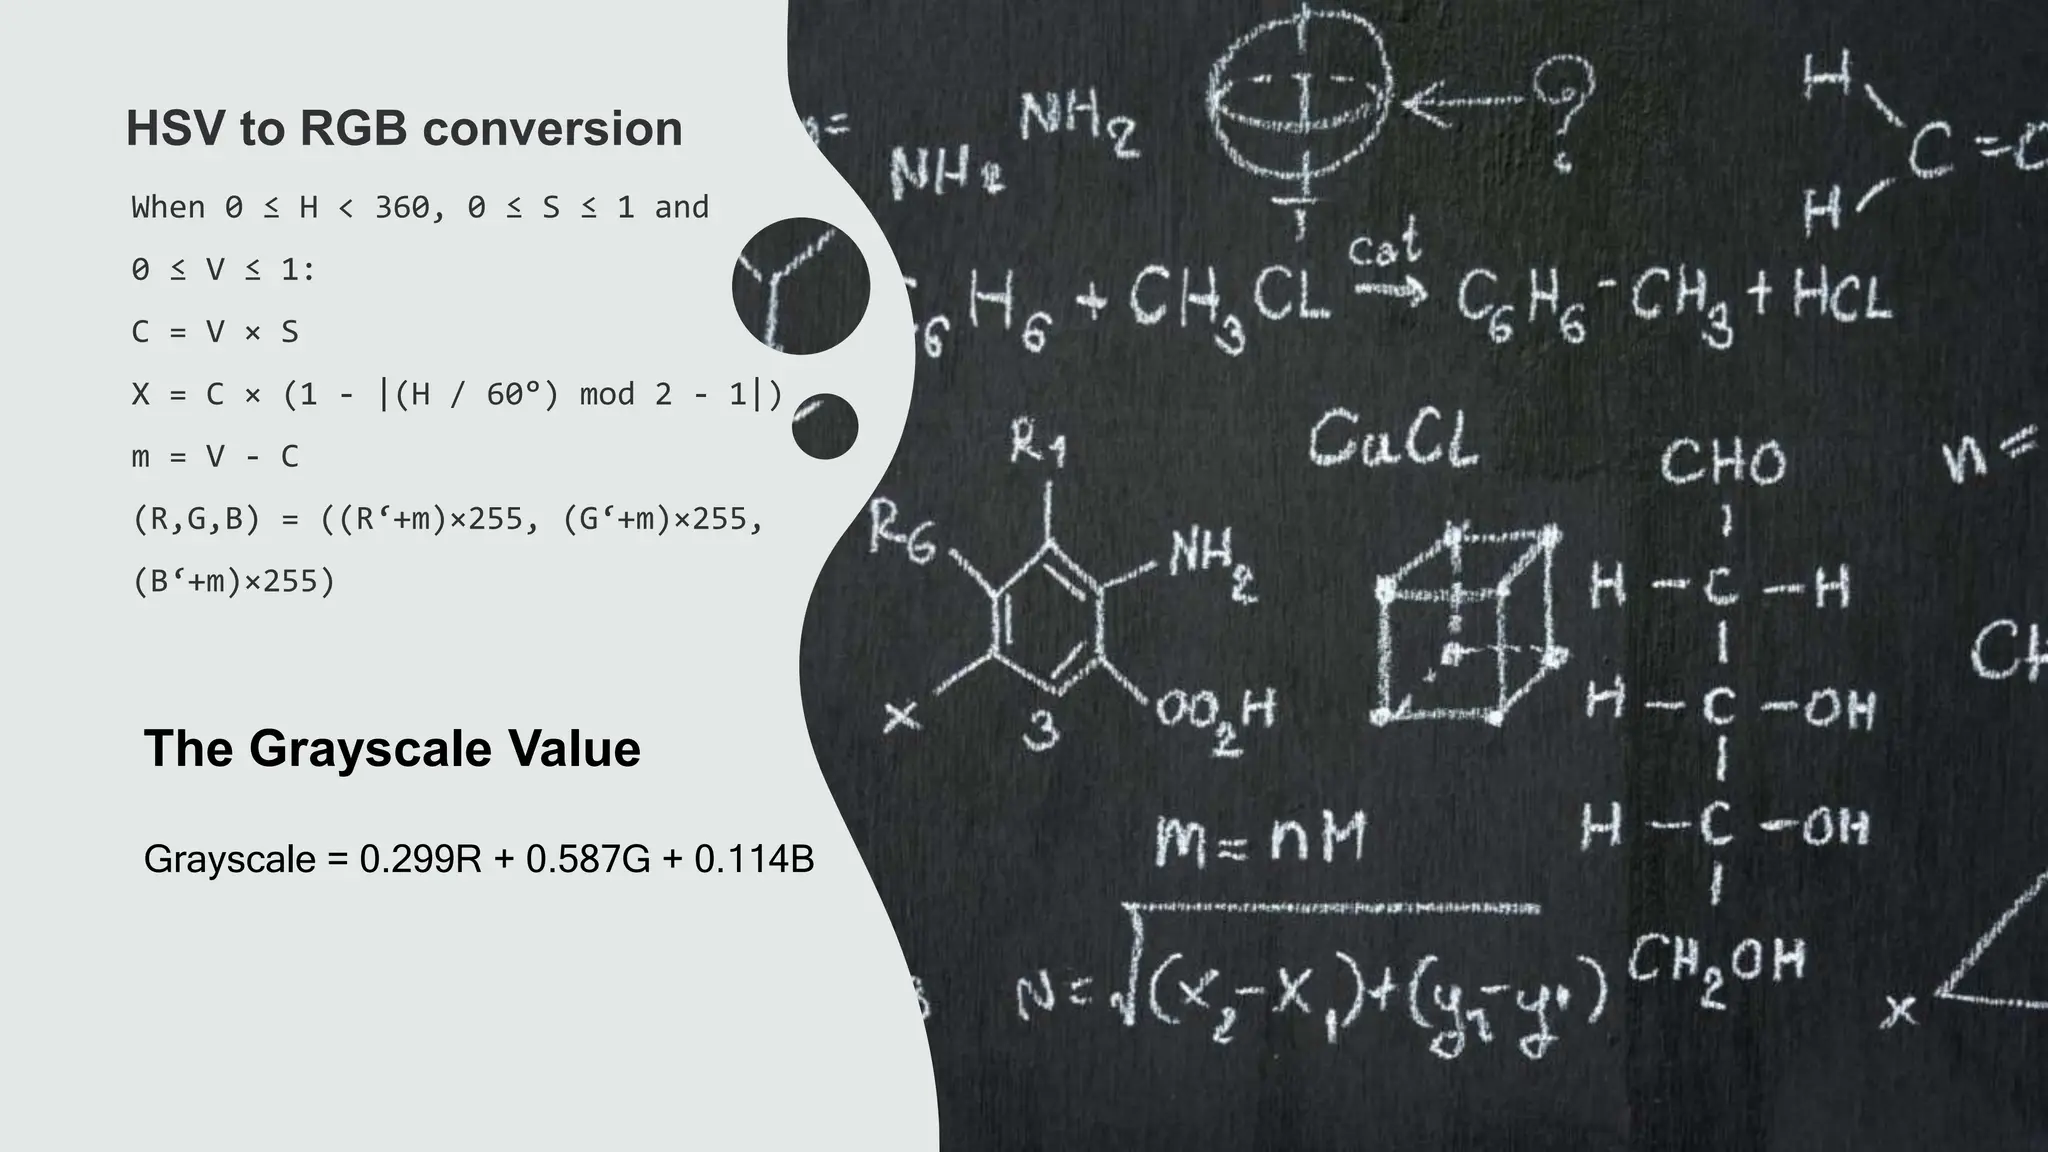
- How HSV represents color in terms of hue, saturation, and value to better match human perception compared to RGB.
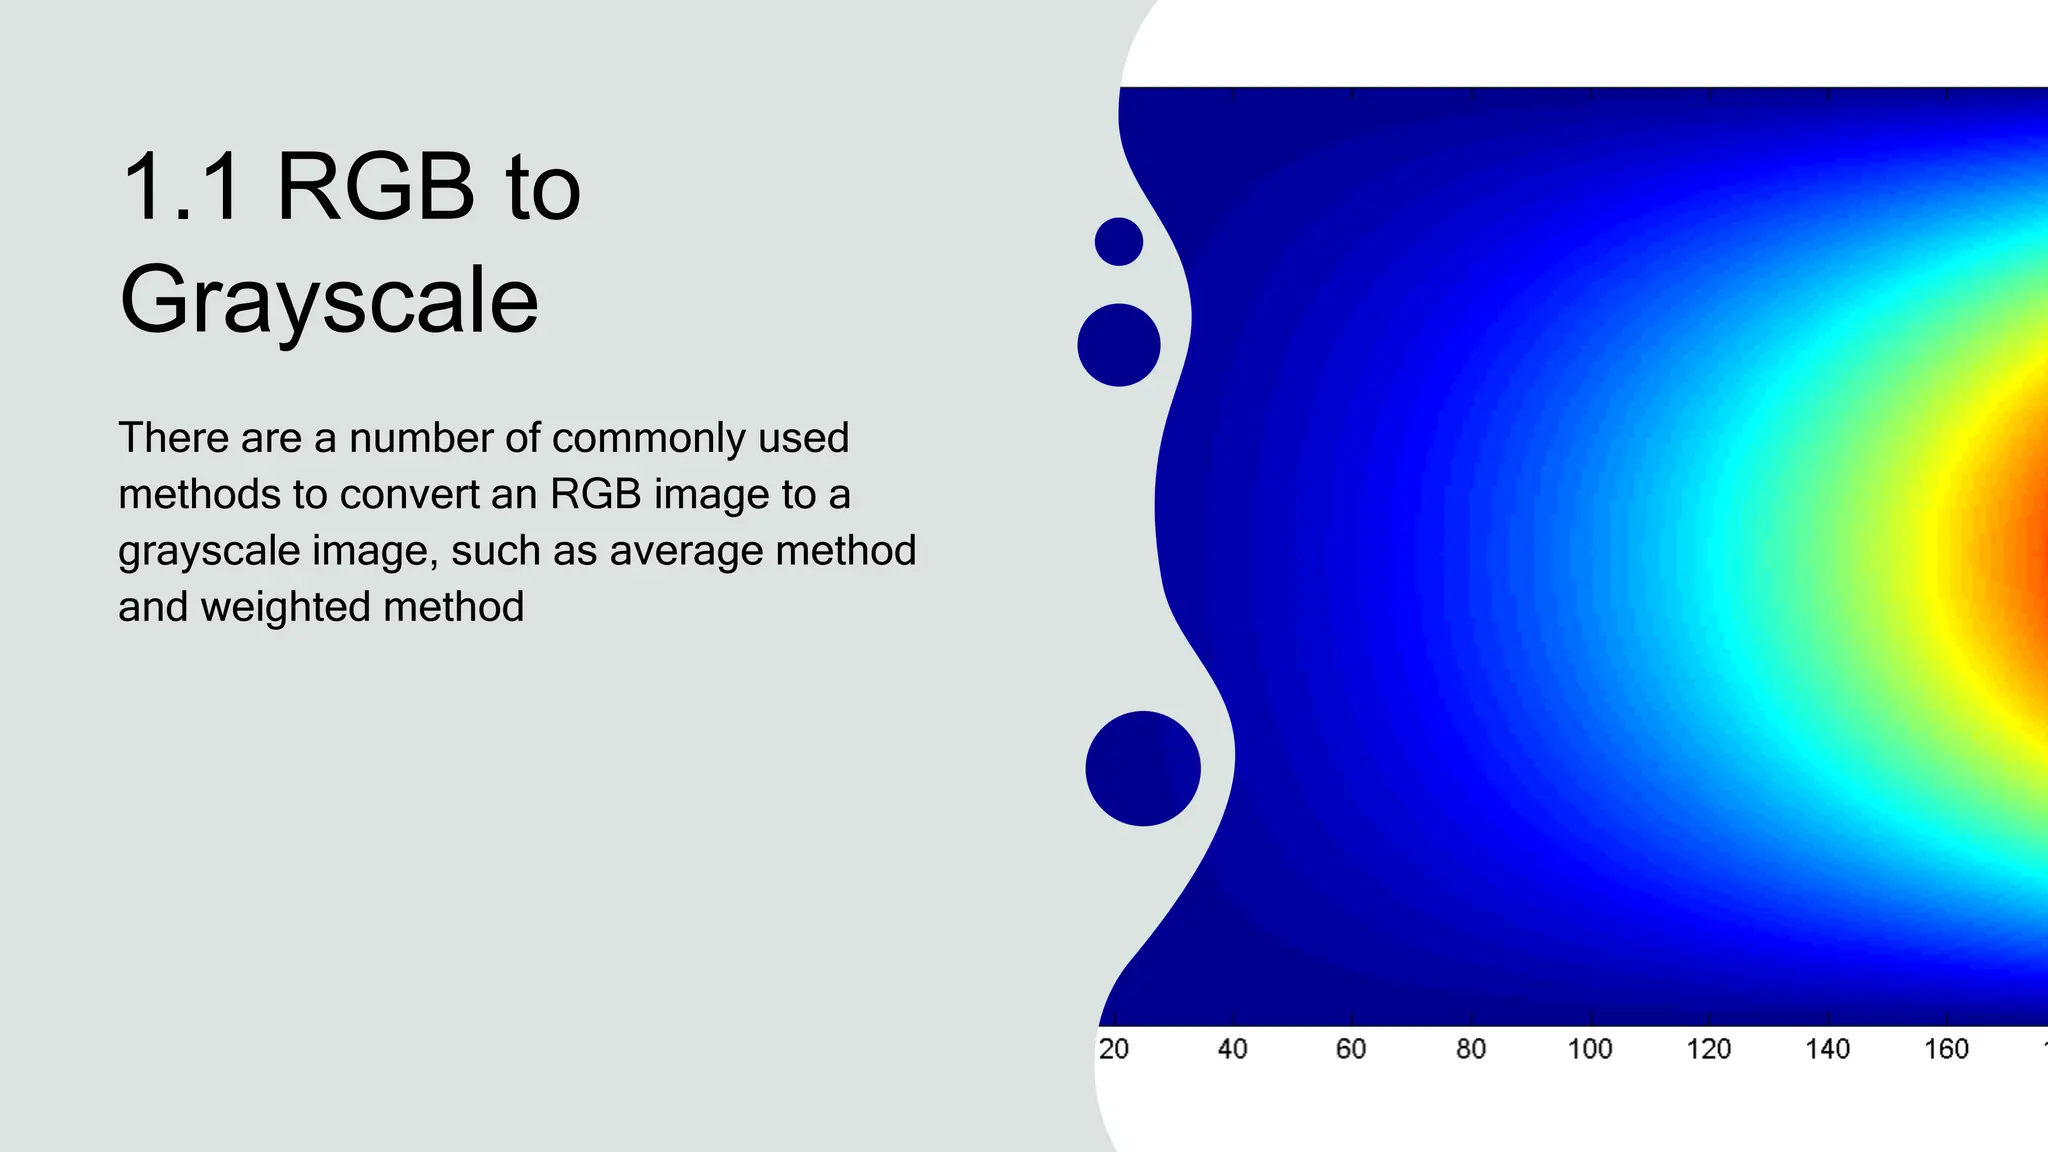
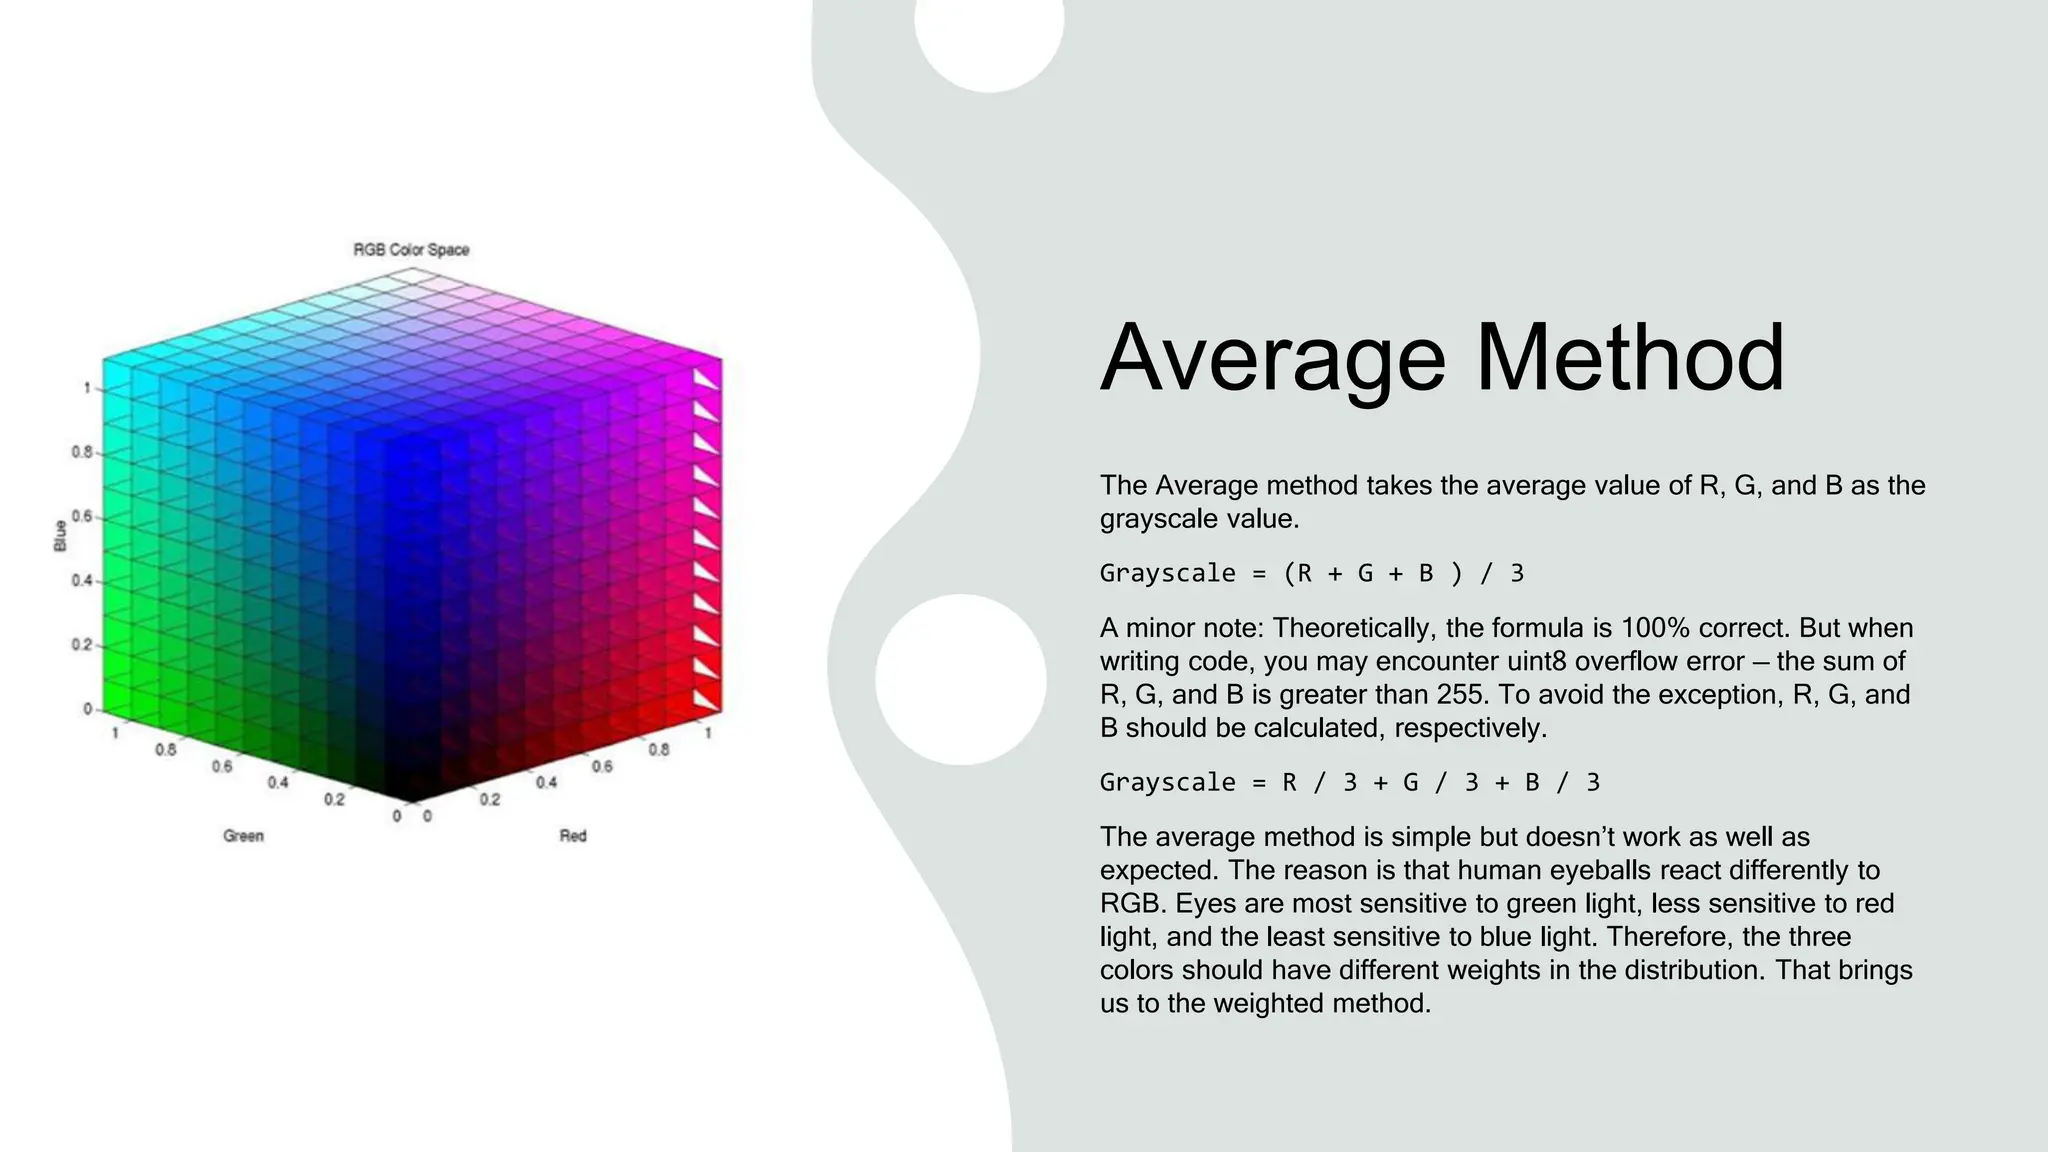
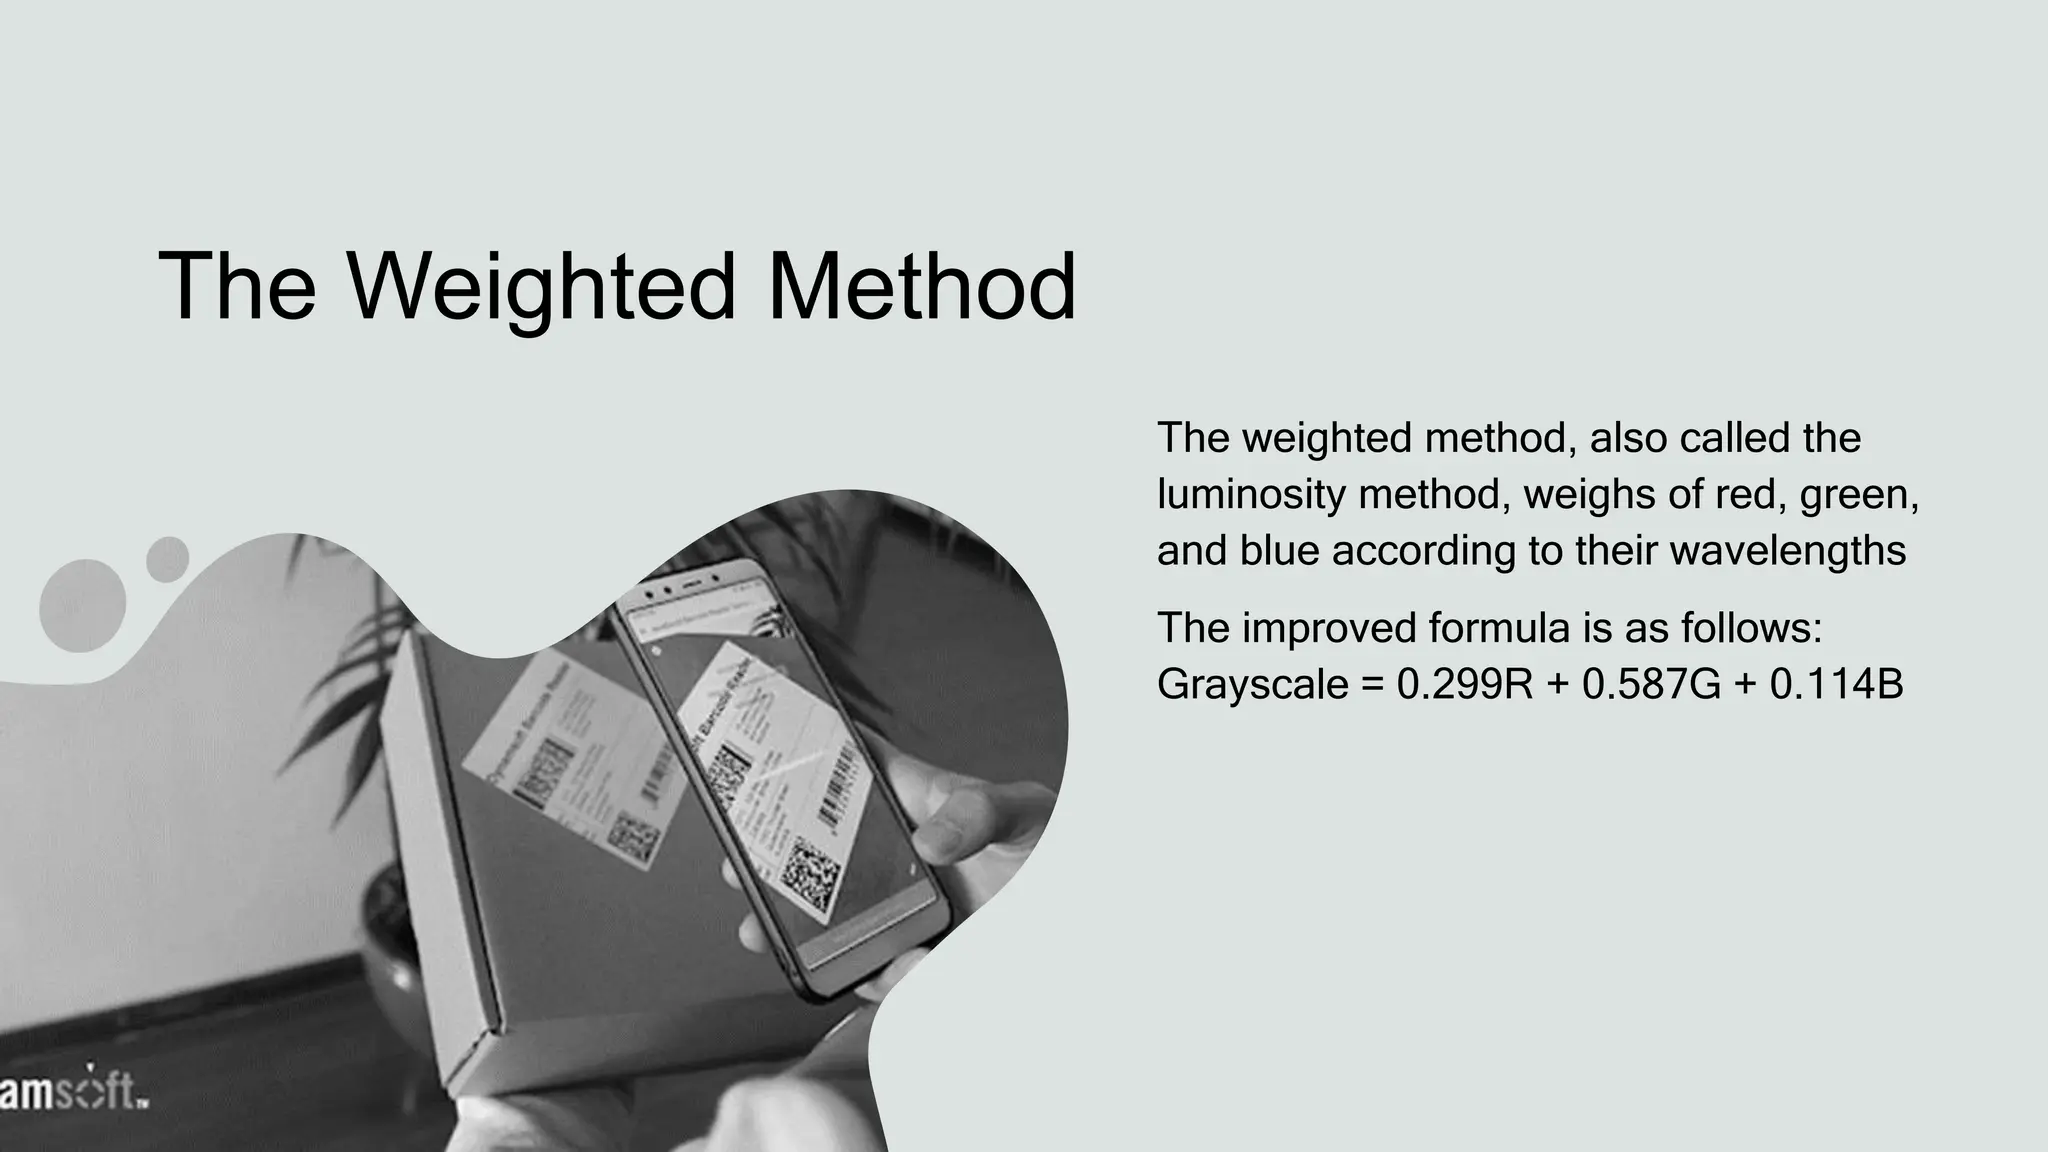
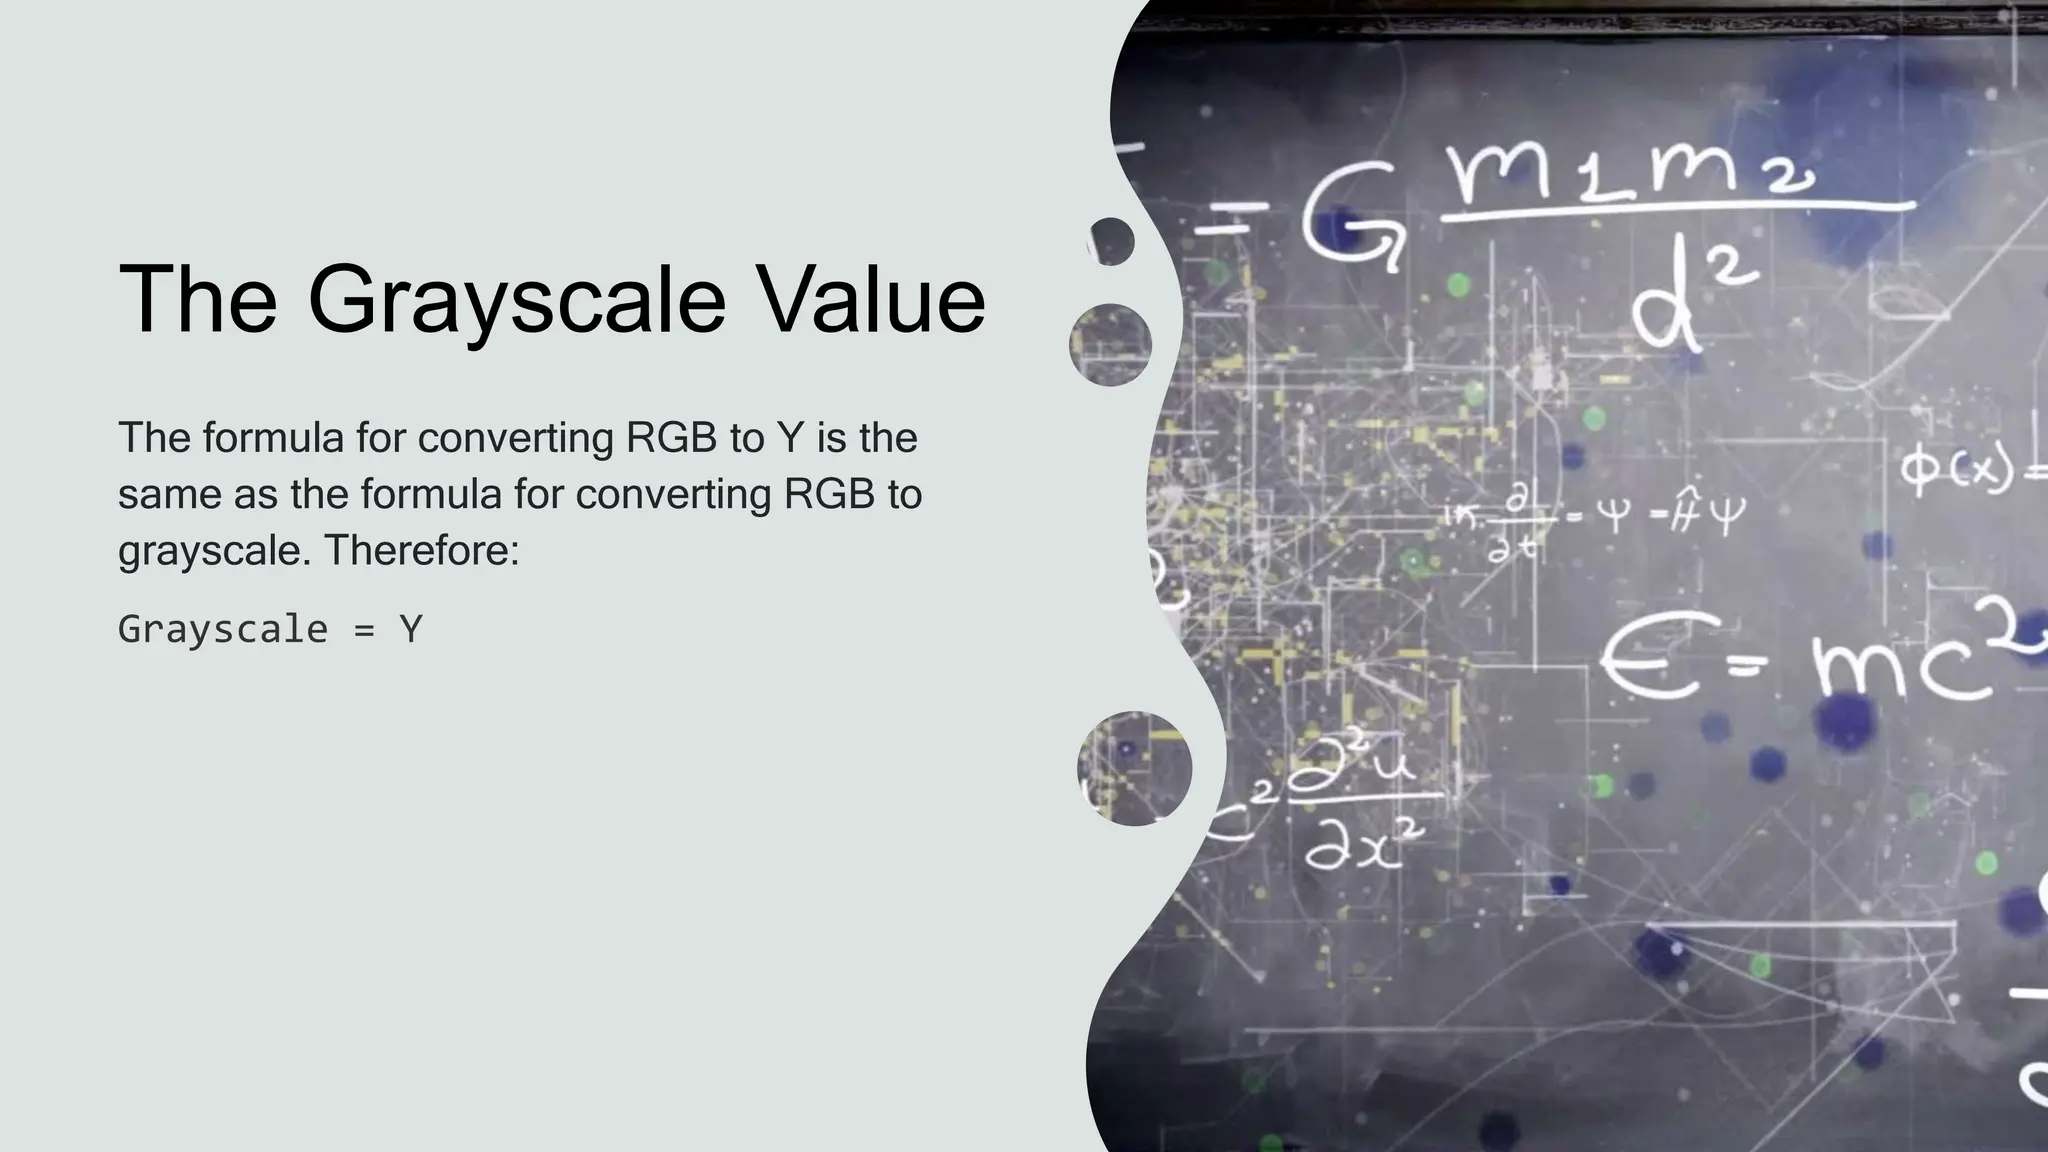
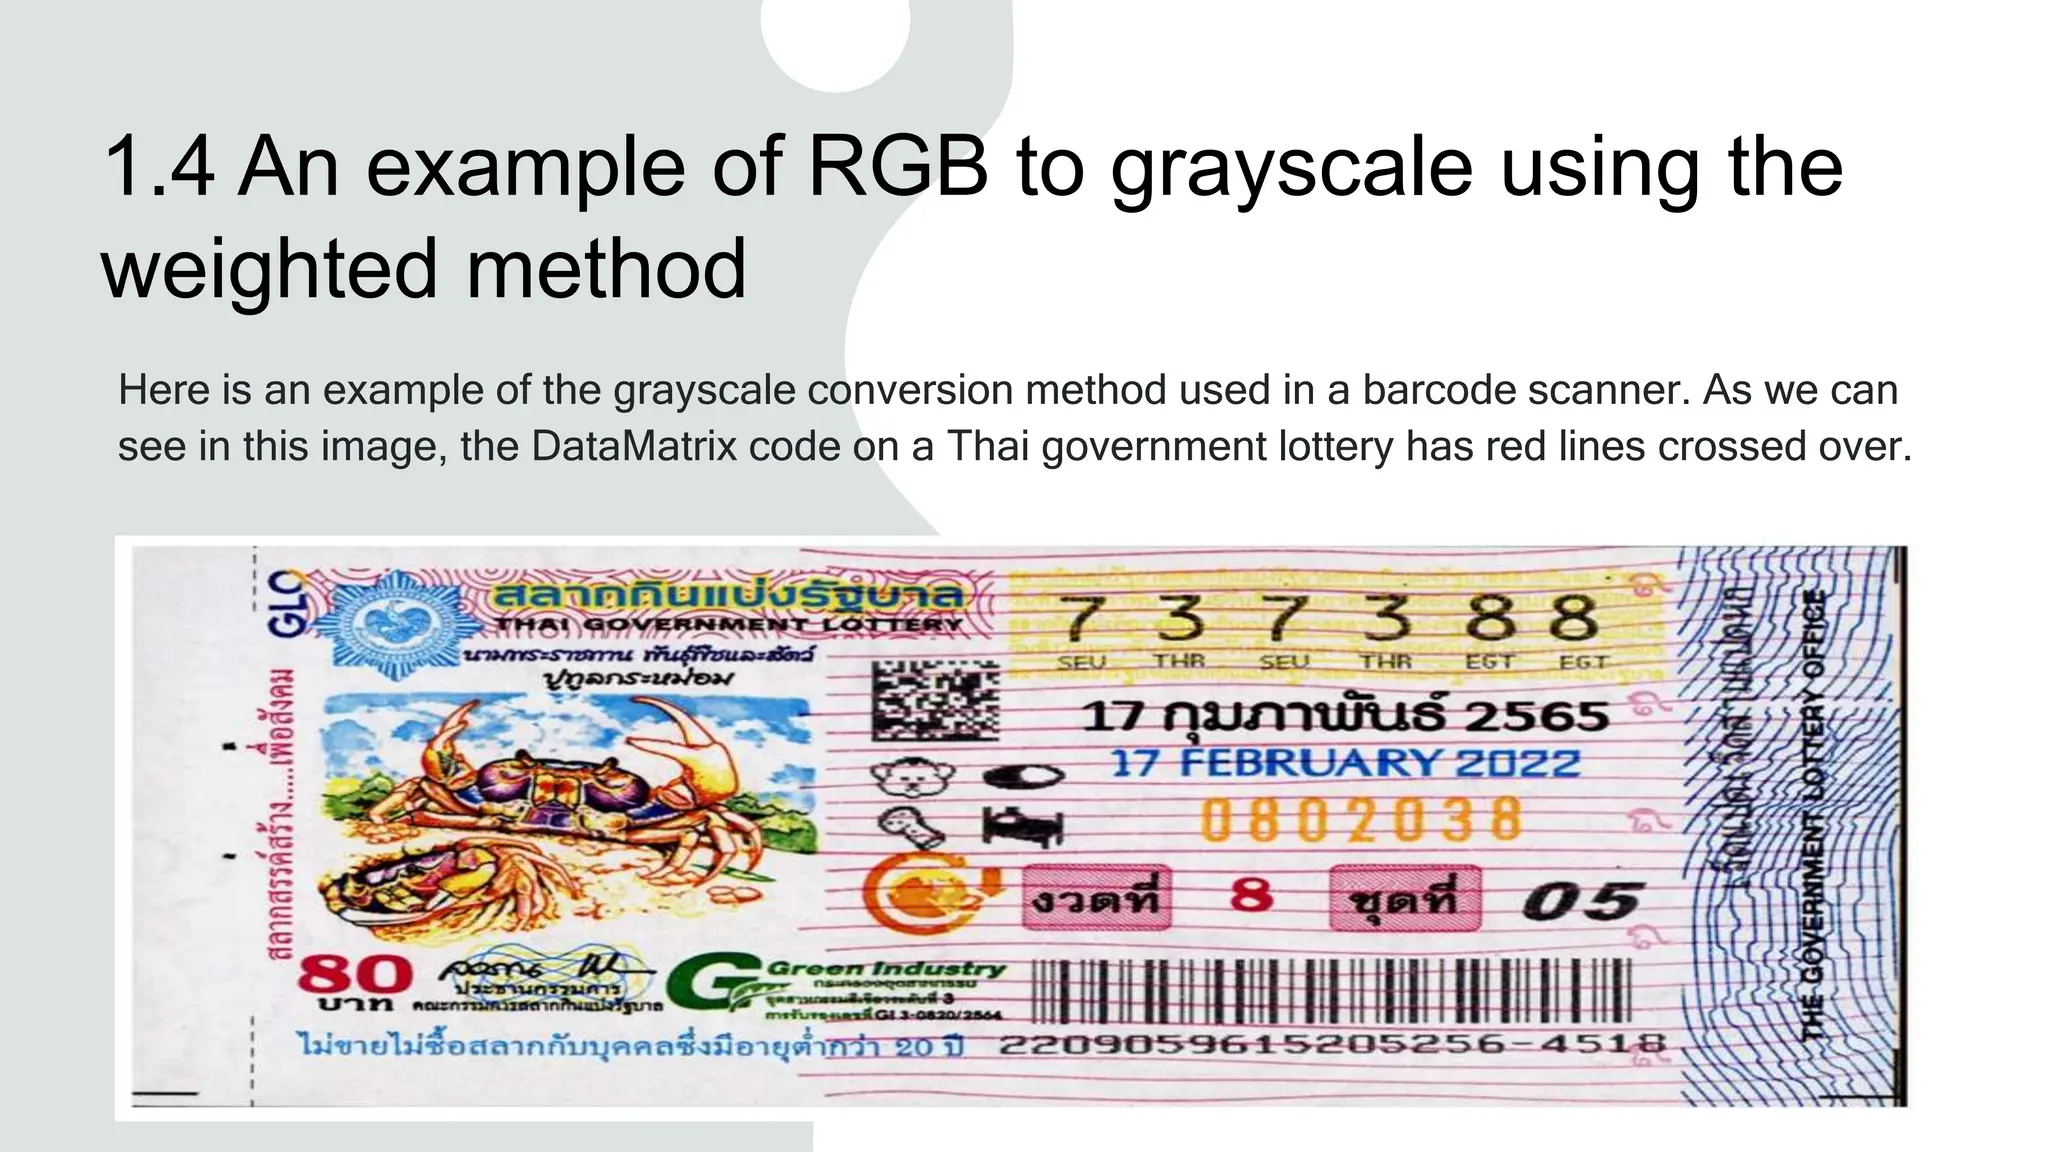
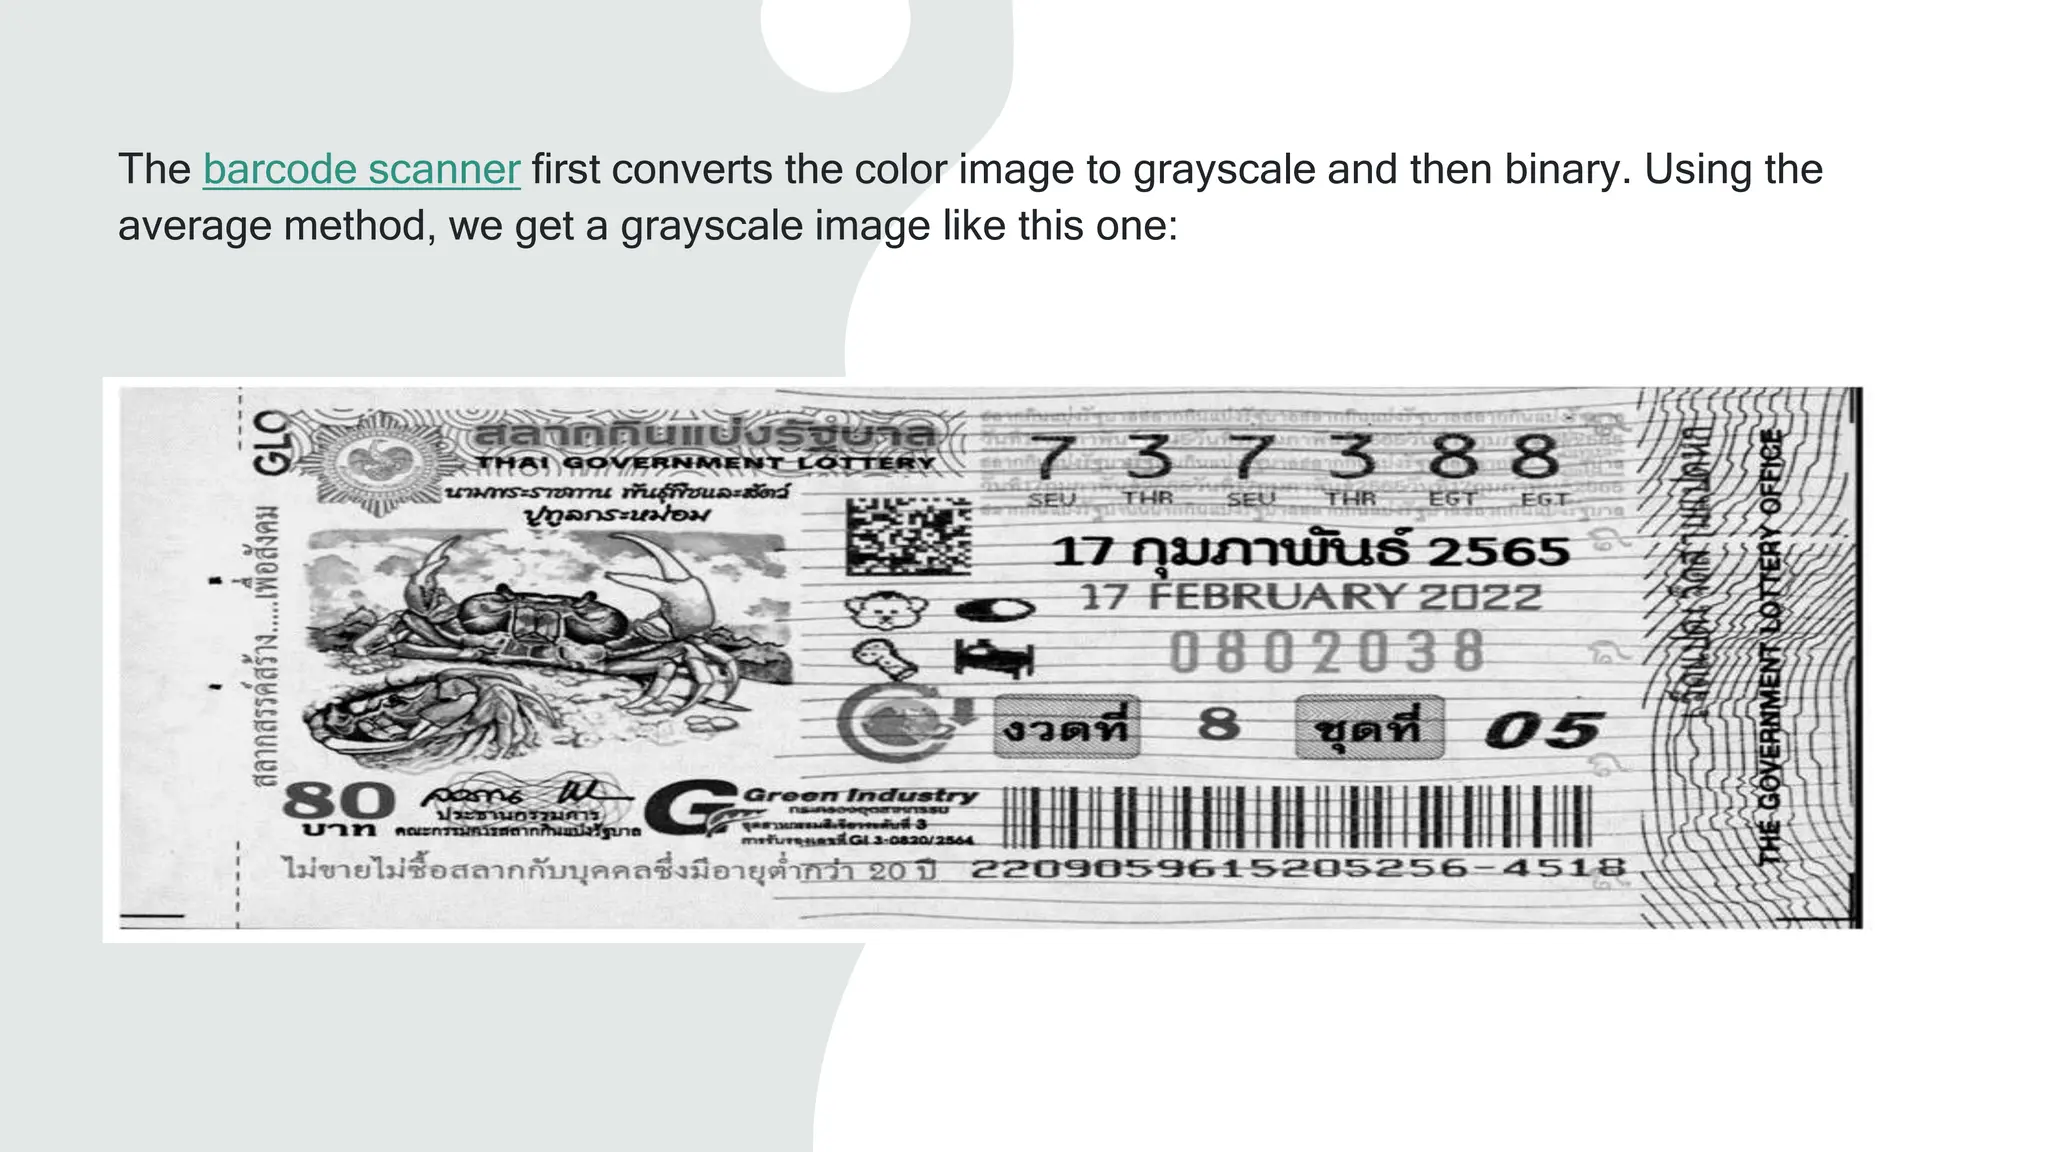
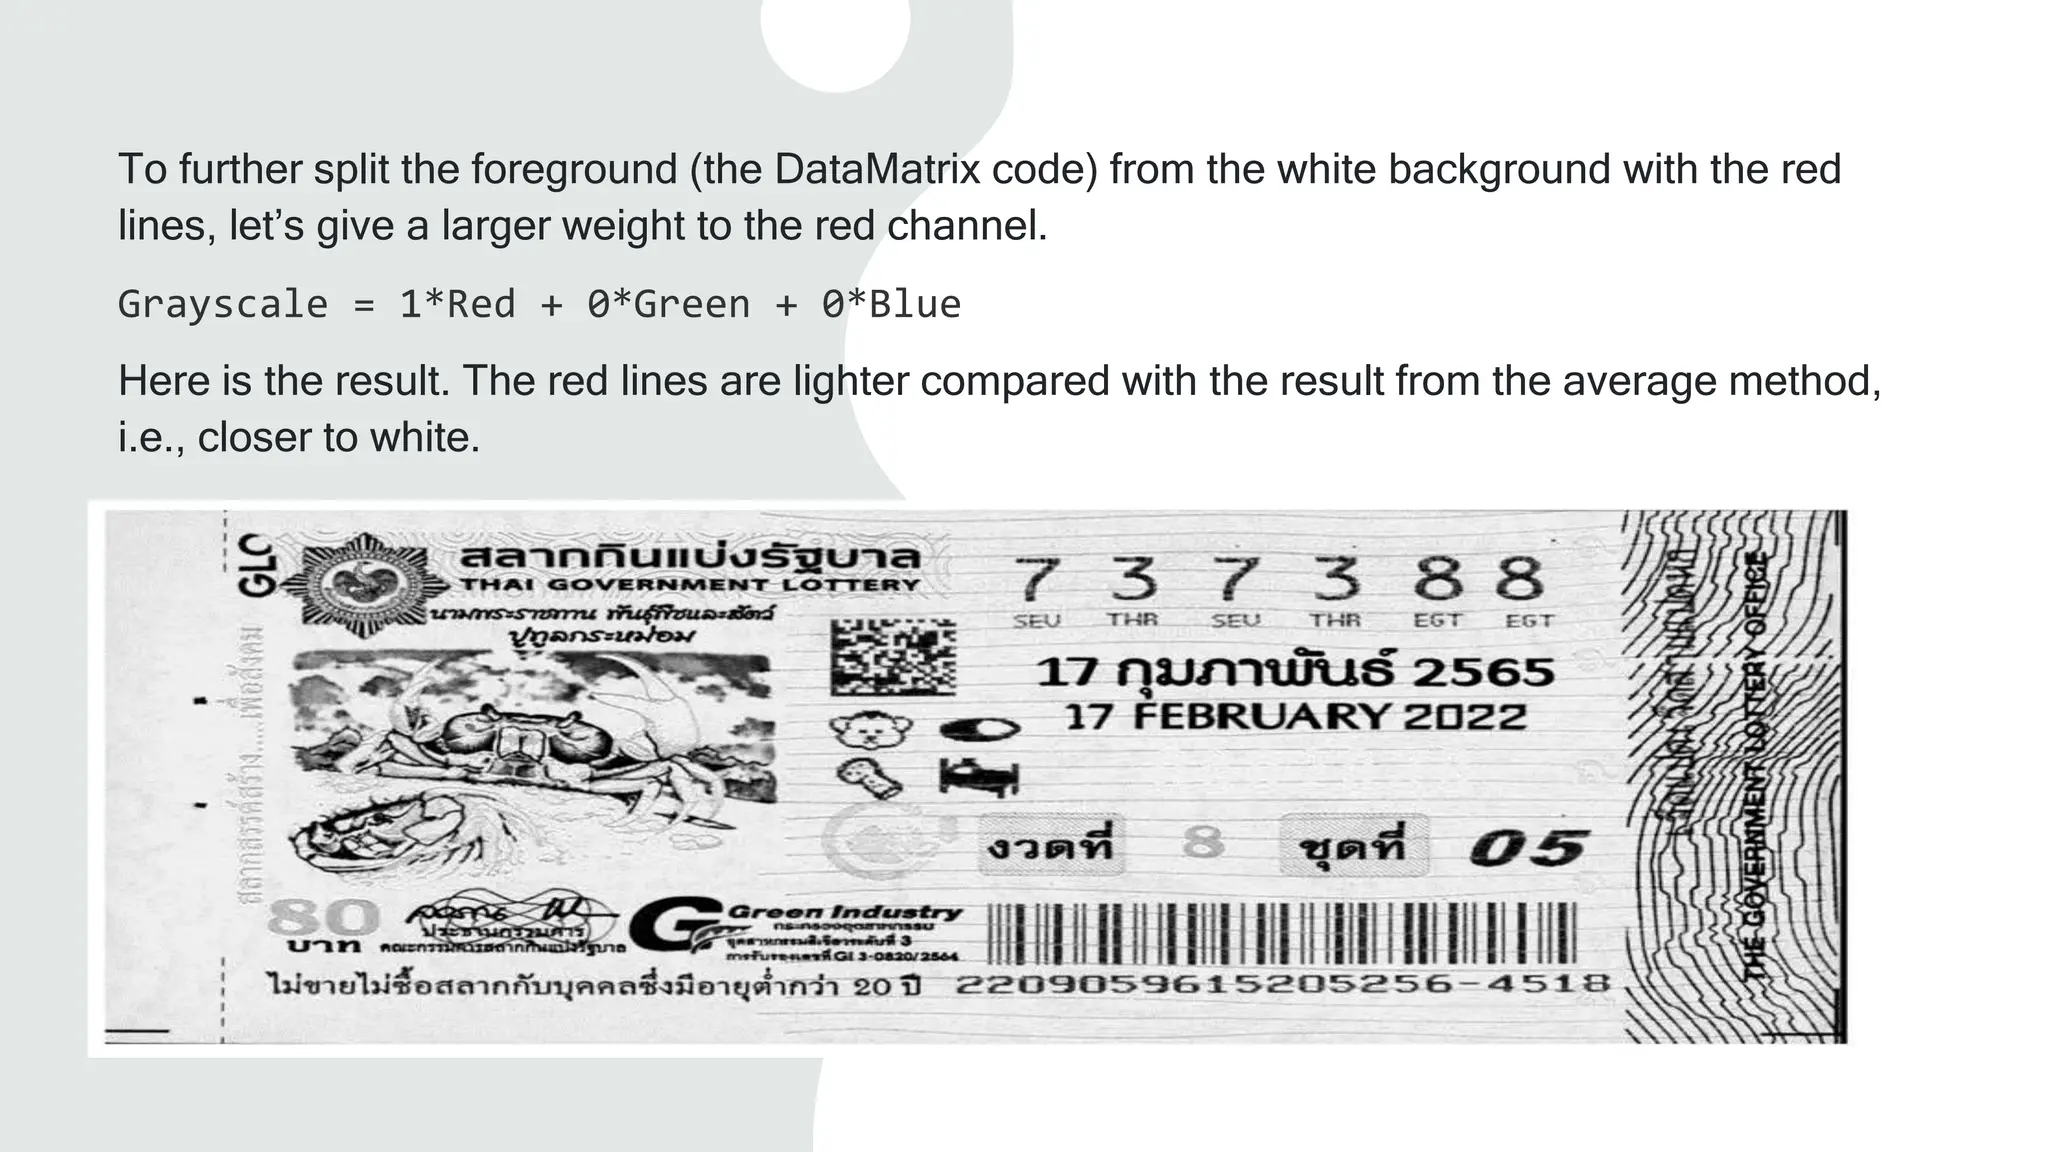
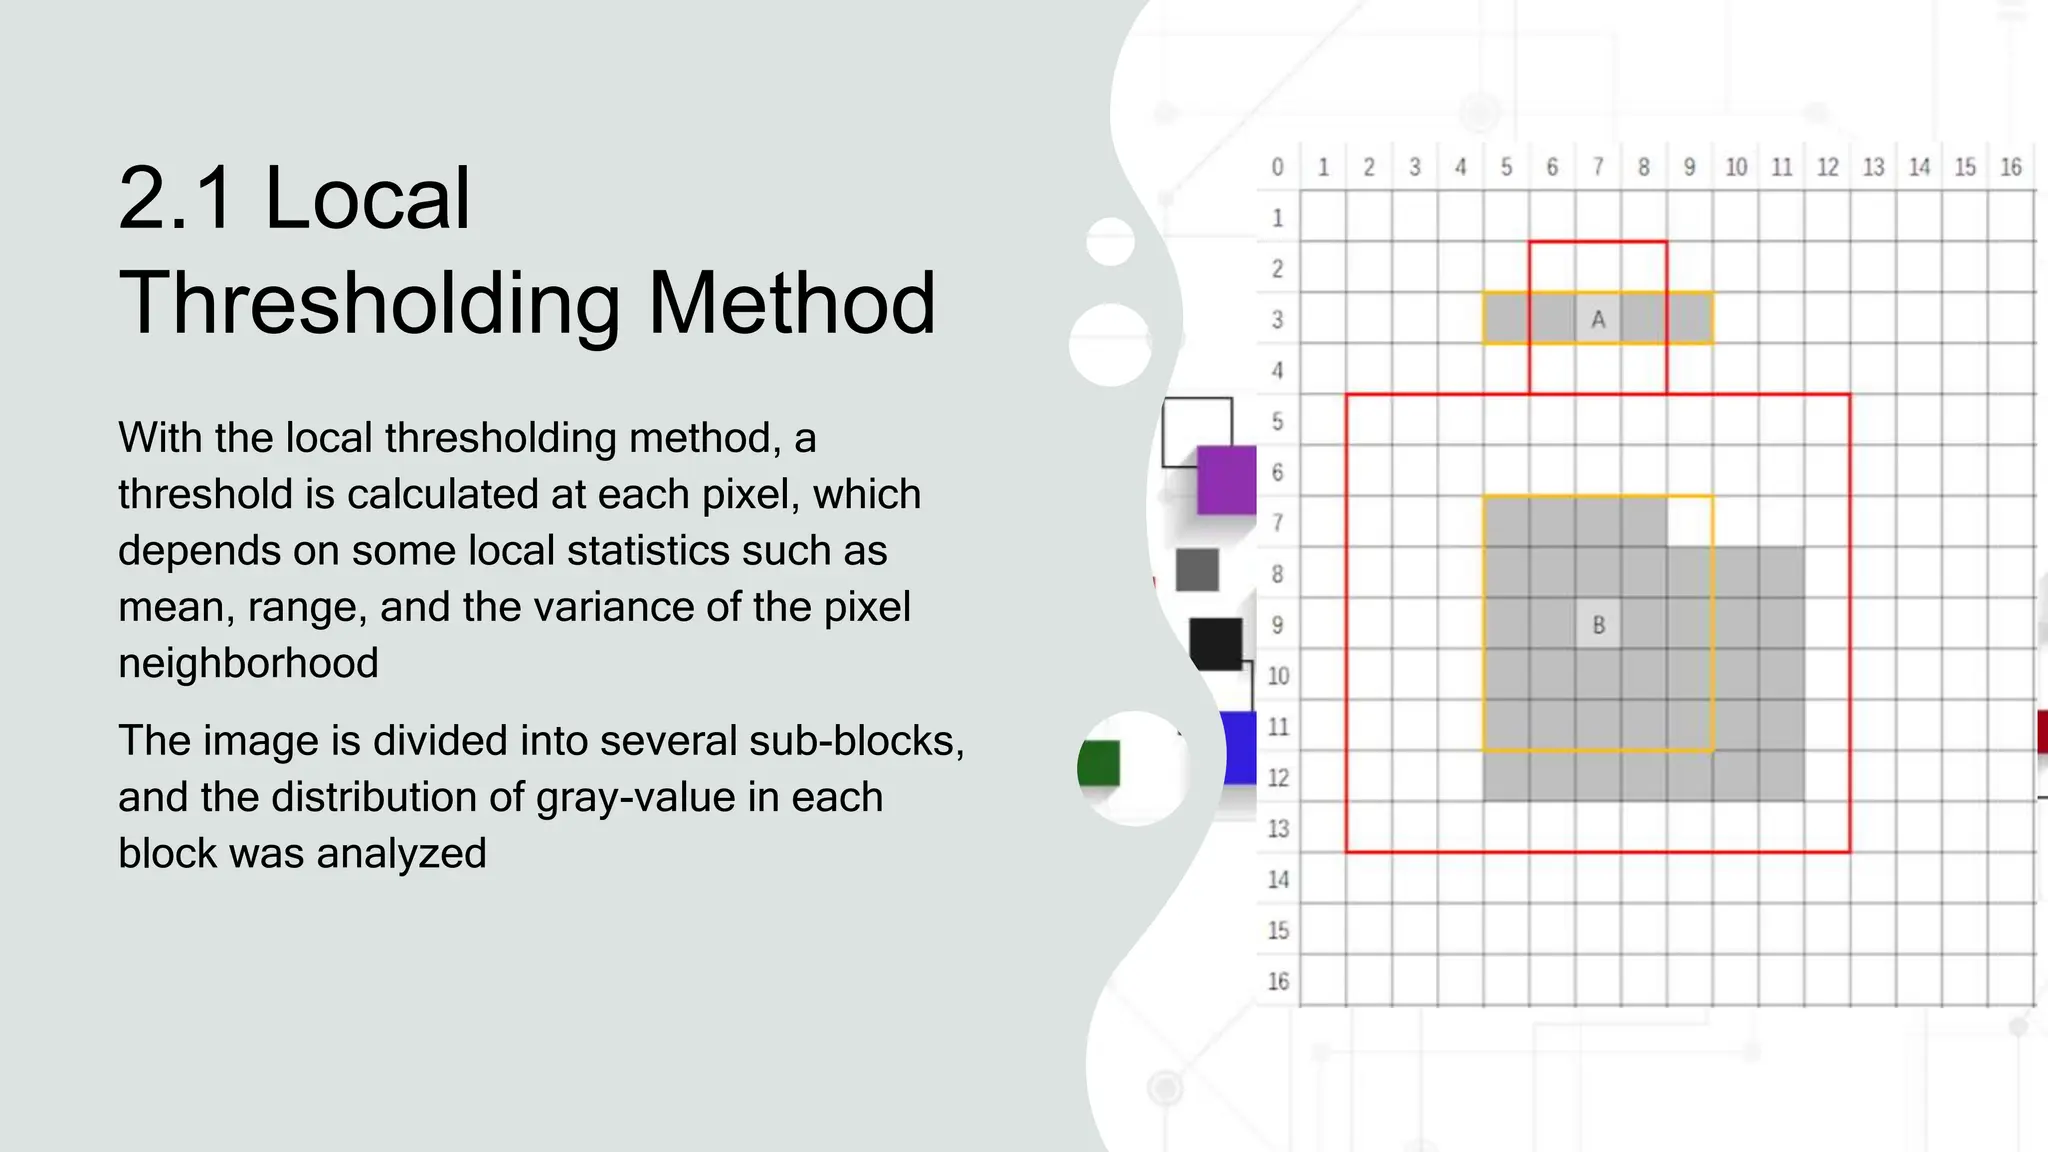
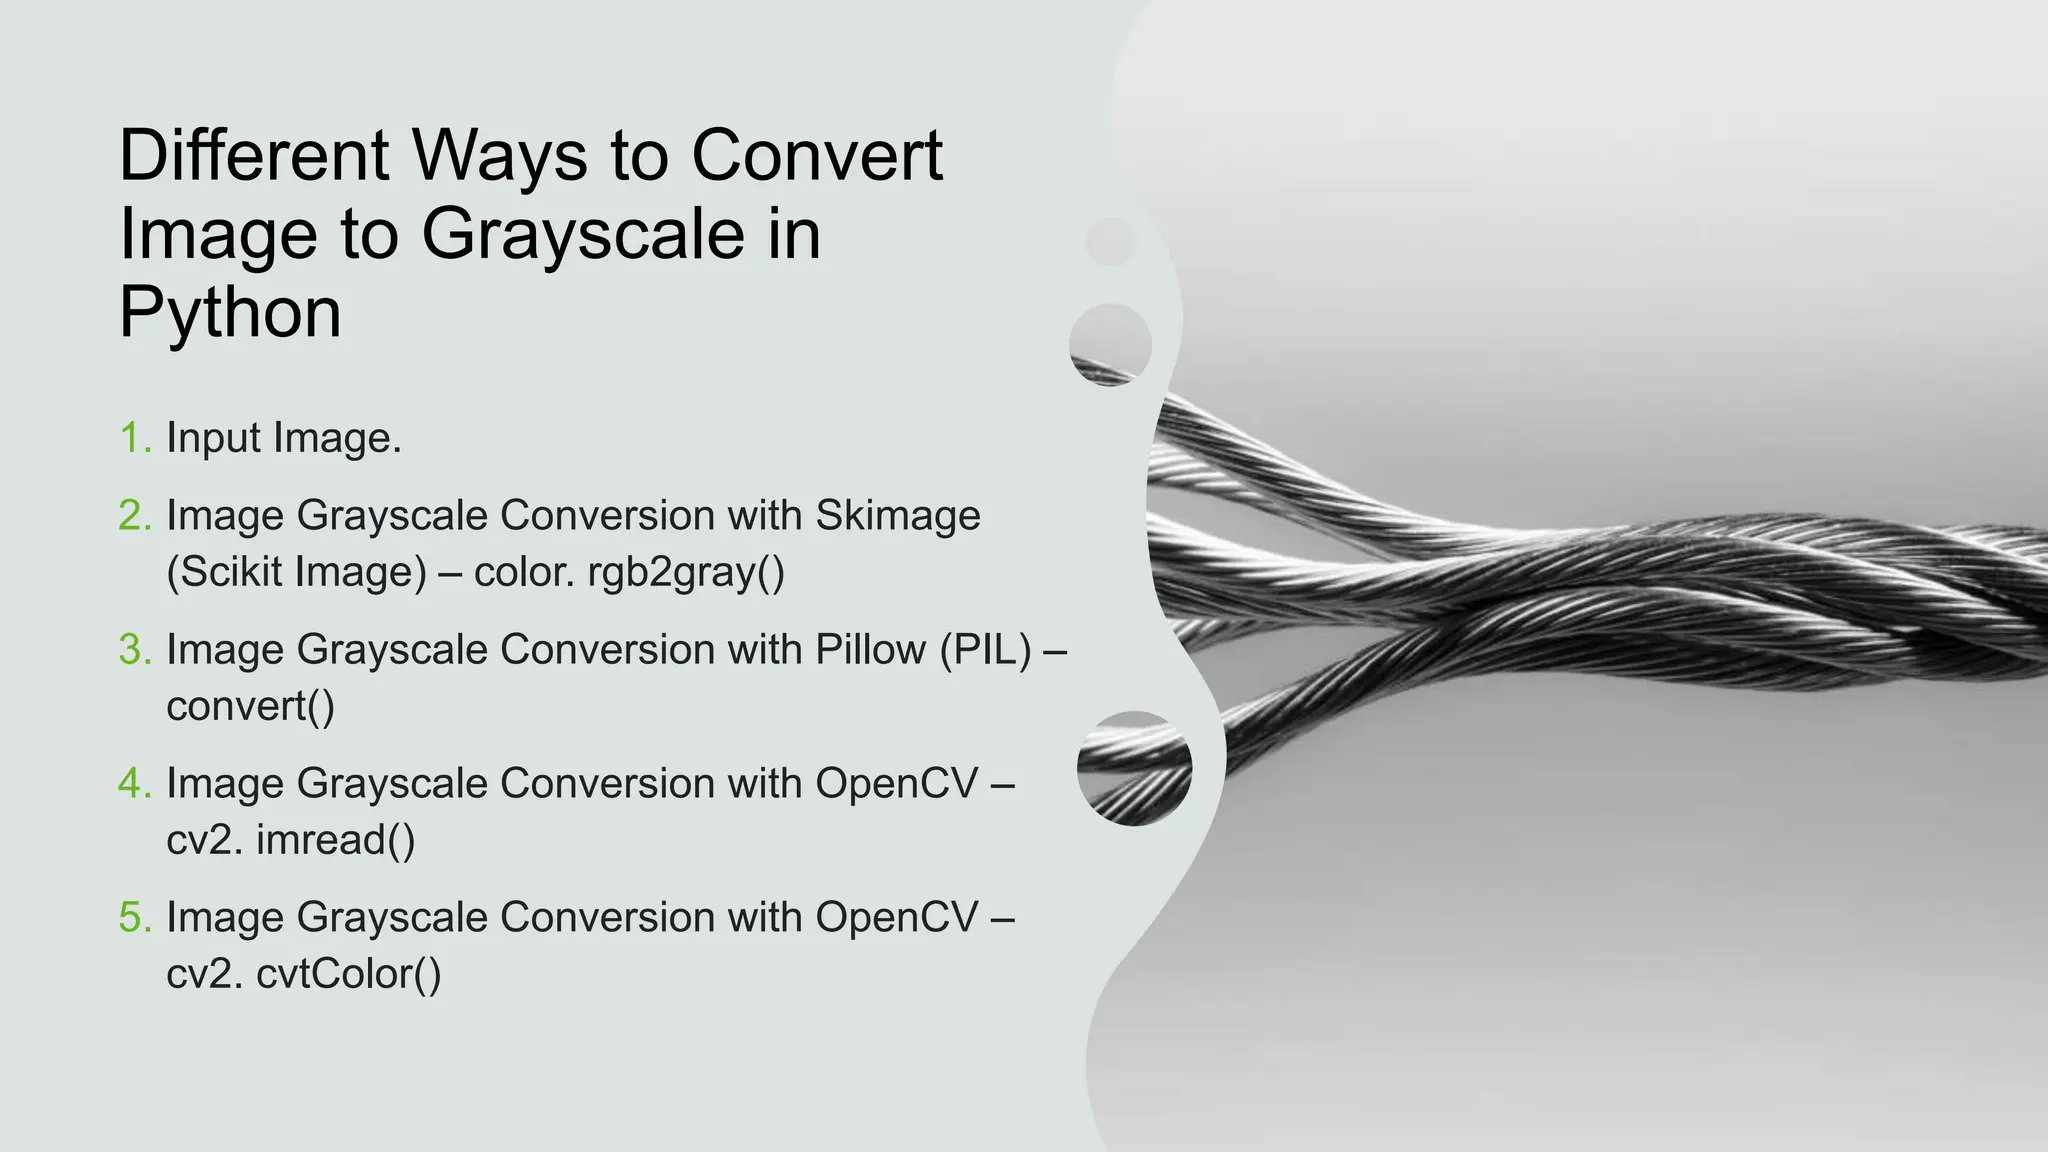
- Methods for converting between color models and spaces, as well as converting color images to grayscale. This includes weighted vs average methods and maintaining brightness information.


![Source code used for testing
import cv2 RGB_image = cv2.imread("thai-government-lottery.png")
blue = RGB_image[:,:,0]
green = RGB_image[:,:,1]
red = RGB_image[:,:,2]
Average_Gray = blue/3+green/3+red/3
Weighted_Gray = (0 * blue) + (0* green) + (1 * red)](https://image.slidesharecdn.com/lec-9colorspace-model-231225175738-2a2356e5/75/Lecnoninecolorspacemodelindigitalimageprocess-30-2048.jpg)
![In [1]:
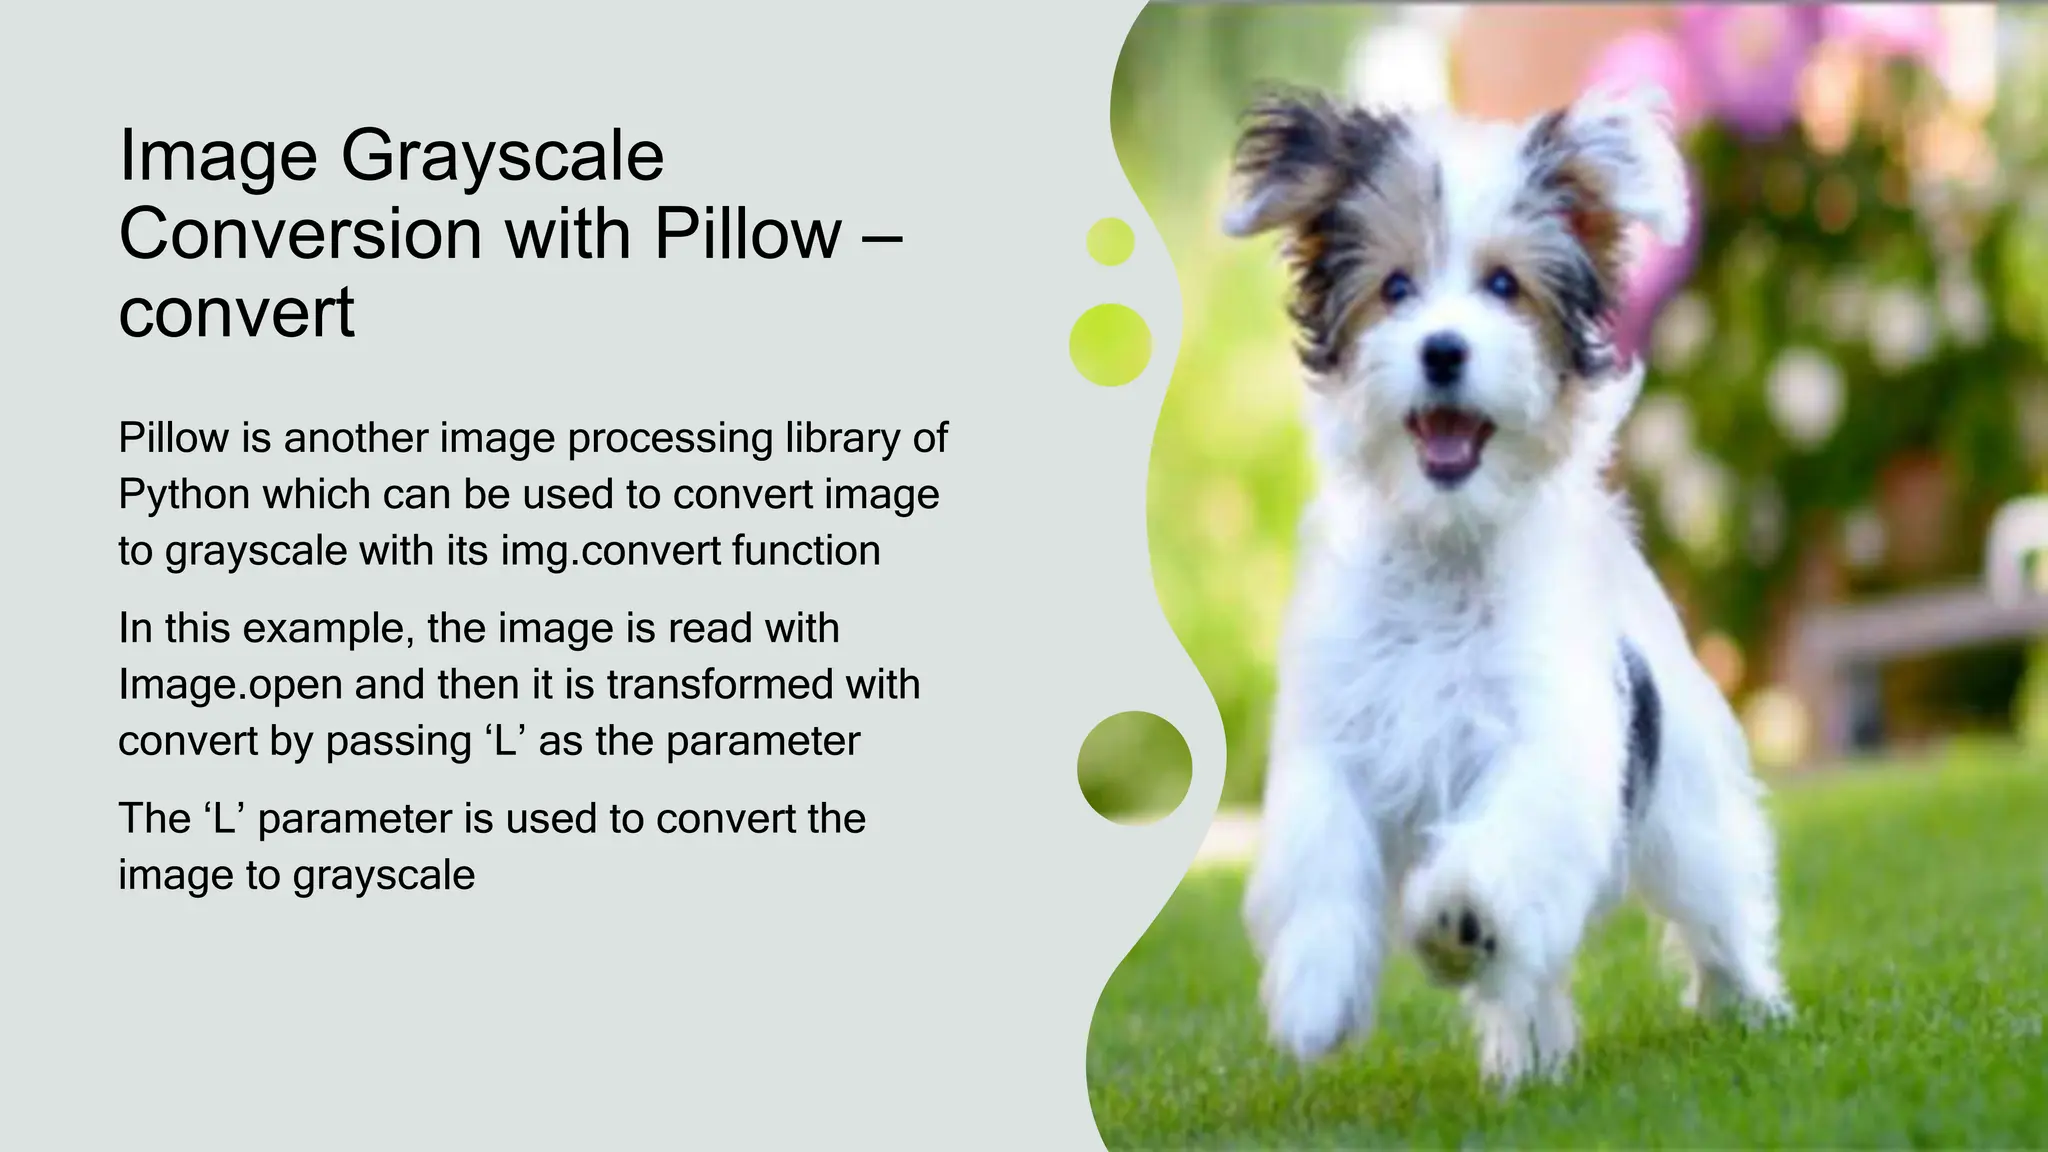
from PIL import Image
img = Image.open('dog.jpg')
imgGray = img.convert('L')
imgGray.show()
Out[1]:
window_name='Grayscale Conversion OpenCV'
cv2.namedWindow(window_name,
cv2.WINDOW_NORMAL)
cv2.imshow(window_name,img_gray)
cv2.waitKey(0)
cv2.destroyAllWindows()](https://image.slidesharecdn.com/lec-9colorspace-model-231225175738-2a2356e5/75/Lecnoninecolorspacemodelindigitalimageprocess-36-2048.jpg)


![[DSC Europe 25] Danica Soc - The Science Behind Marketing: Experimentation me...](https://cdn.slidesharecdn.com/ss_thumbnails/c0nofsggs9gw5ucmallr-3-251216103155-56bd64d1-thumbnail.jpg?width=640&height=640&fit=bounds)


![[DSC Europe 25] Tatevik Maytesyan - How to actually use AI in marketing: gett...](https://cdn.slidesharecdn.com/ss_thumbnails/tjo626lsqdgfntbgl2mw-4-251216103155-e36cd239-thumbnail.jpg?width=640&height=640&fit=bounds)

![[DSC Europe 25] Miodrag Pesovic & Vladislav Radonjic - Federated Data Archite...](https://cdn.slidesharecdn.com/ss_thumbnails/gsbe3y5it5uhndi4e08e-1-251212103249-f1008e0c-thumbnail.jpg?width=640&height=640&fit=bounds)

![[DSC Europe 25] Dunja Adzic Jovanovic - AI and Cybersecurity: Defending Data ...](https://cdn.slidesharecdn.com/ss_thumbnails/o1zylpbhrtwnixxq2xj8-7-251211083048-185086f6-thumbnail.jpg?width=640&height=640&fit=bounds)
![[DSC Europe 25] Behzad Hosseini - AI Agents in the Wild: Deploying Models tha...](https://cdn.slidesharecdn.com/ss_thumbnails/3qtejajvsjqrzwfept2c-10-251212103250-7f2b1068-thumbnail.jpg?width=640&height=640&fit=bounds)

![[DSC Europe 25] Jovan Bogicevic - Legacy to AI-Driven Defense: Transforming D...](https://cdn.slidesharecdn.com/ss_thumbnails/rsarluadt563hntyfc8q-3-251211083849-3e7bc4c0-thumbnail.jpg?width=640&height=640&fit=bounds)
![[DSC Europe 25] Debmalya Biswas - Agentification: the art of transforming man...](https://cdn.slidesharecdn.com/ss_thumbnails/r5azlggvtqiaiiusrqdr-4-251212103249-5a12c89b-thumbnail.jpg?width=640&height=640&fit=bounds)
![[DSC Europe 25] Bassam Maharmeh - Artificial Intelligence: Opportunities and ...](https://cdn.slidesharecdn.com/ss_thumbnails/thhfmr2fqpawzj7hsjpg-5-251211083048-2c23204f-thumbnail.jpg?width=640&height=640&fit=bounds)
