This document contains an answer key for a math worksheet on quadratic functions. It includes:
1) Graphing quadratic equations and finding vertices, zeros, and y-intercepts.
2) Solving quadratic equations by factoring.
3) Identifying true statements about the discriminant and solutions of quadratic equations.
4) Solving quadratic equations using the quadratic formula.
5) Writing the equation for a situation where a hockey player's salary is a quadratic function of his goals.
6) Analyzing the graph of a quadratic equation.
7) Writing the equation for a situation where the sum and product of two numbers is given.
8) Setting up and
The document contains an answer key for a mathematics assignment on quadratic functions. It includes:
1) Graphing quadratic equations and identifying vertex, zeros, and y-intercept.
2) Solving quadratic equations by factoring.
3) Identifying true statements about quadratic functions.
4) Solving quadratic equations using the quadratic formula.
5) Setting up and solving an optimization word problem involving quadratic sales based on number of items sold.
6) Answering true/false questions based on a graph of a quadratic function.
7) Writing the quadratic equation for an age relationship problem.
8) Setting up the Pythagorean theorem to solve for side lengths of
This document contains an answer key for a quiz on quadratic functions. It includes:
1) Graphing quadratic equations and identifying vertex, zeros, axis of symmetry, and y-intercept.
2) Solving quadratic equations by factoring.
3) Identifying true statements about the discriminant and solutions of a quadratic equation.
4) Solving quadratic equations using the quadratic formula and identifying the discriminant and solutions.
5) Writing the equation for a situation involving profit from selling bracelets with discounts.
6) Writing the equation for a situation involving the sum of squares of consecutive even numbers.
7) Analyzing the graph of a quadratic equation to identify the vertex,
This document provides the final mark scheme for Edexcel's Core Mathematics C1 exam from January 2012. It lists the questions, schemes for awarding marks, and total marks for each question. The six mark questions cover topics like algebra, inequalities, coordinate geometry, and calculus. The longer questions involve multi-step problems applying these concepts, including sketching curves, finding equations of tangents and normals, and solving word problems involving formulas.
This document contains 14 math problems involving calculating the area under curves using definite integrals. The problems include finding the area under functions such as x2, √x, sec2x, and siny from given bounds. The areas are calculated and expressed as fractions or simplified numeric values.
1. This document contains examples of finding antiderivatives (indefinite integrals) of various functions.
2. The examples demonstrate using basic integration rules like power rule, reverse derivative rule, trigonometric integral formulas to find antiderivatives.
3. Additional examples show using initial conditions to determine an unknown constant term when an antiderivative is given in terms of an arbitrary constant.
This document discusses concepts and examples related to derivatives and critical points. It provides:
1) Examples of functions with critical points identified by setting the derivative equal to zero and finding the x-values that satisfy this. Maximum and minimum values are identified.
2) Practice problems for students to find the critical points, maximum/minimum values, and evaluate functions at critical points.
3) Additional examples illustrate situations where the derivative is undefined or does not equal zero at critical points.
This document contains notes and formulae on additional mathematics for Form 4. It covers topics such as functions, quadratic equations, quadratic functions, indices and logarithms, coordinate geometry, statistics, circular measure, differentiation, solutions of triangles, and index numbers. The key points covered include the definition of functions, the formula for the sum and product of roots of a quadratic equation, the axis of symmetry and nature of roots of quadratic functions, and common differentiation rules.
1. The document provides 13 mathematics questions covering topics such as: simplifying expressions, solving quadratic equations, working with cylinders and areas, and proving identities. Students must show their working and attempt all questions.
2. The questions involve skills like factorizing, using the quadratic formula, eliminating variables, finding minimum points on graphs, and proving statements about odd numbers. Working is required for full marks.
3. Students must complete the questions for homework and bring their work to the next mathematics lesson.
1. The document provides examples and explanations of key concepts in geometry including Cartesian coordinates, distance between points, types of triangles, area of triangles and polygons, division of line segments, slope and inclination of lines, and angle between two lines.
2. One example shows that the points (-2, 0), (2, 3) and (5, -1) are the vertices of a right triangle by applying the Pythagorean theorem.
3. Another example finds the area of the triangle with vertices (5, 4), (-2, 1) and (2, -3) to be 20 square units using the area formula.
The document discusses quadratic functions and models. It defines quadratic functions as functions of the form f(x) = ax^2 + bx + c. It provides examples of expressing quadratic functions in standard form and using standard form to sketch graphs and find minimum/maximum values. The document also provides examples of modeling real-world situations using quadratic functions to find things like maximum area or revenue.
This document provides instructions for graphing linear equations. It begins with examples of solving linear equations algebraically. Students are then introduced to key properties of linear equations: they contain two variables and graph as straight lines. The document demonstrates graphing various linear equations by plotting their solution sets as points and connecting them with a straight line. It concludes by asking students to reflect on similarities and differences between the graphed linear equations.
This document provides notes and formulae on additional mathematics for Form 5. It covers topics such as progressions, integration, vectors, trigonometric functions, and probability. For progressions, it defines arithmetic and geometric progressions and gives the formulas for calculating the nth term and sum of terms. For integration, it provides rules and formulas for integrating polynomials, trigonometric functions, and expressions with ax+b. It also defines vectors and their operations including vector addition and subtraction. Other sections cover trigonometric functions, their definitions, relationships and graphs, as well as probability topics such as calculating probabilities of events and distributions like the binomial.
This document provides a marking scheme for an Additional Mathematics paper 2 trial examination from 2010. It consists of 7 questions, each with multiple parts. For each question, it lists the number of marks awarded for various steps in the solutions, such as setting up the correct formula, performing calculations accurately, obtaining the right solution, plotting points correctly, and using appropriate mathematical reasoning. The highest number of marks for a single question is 8 marks. The marking scheme evaluates multiple aspects of students' work and reasoning for 7 multi-step mathematics problems.
Exponential and logarithm functions are important in both theory and practice. They examine the graphs of exponential functions f(x)=ax where a>0 and logarithm functions f(x)=loga(x) where a>0. It is important to practice these functions so their properties become intuitive. Key properties include exponential functions where a>1 increase rapidly for positive x and 0<a<1 increase for decreasing negative x, and both pass through (0,1). The natural logarithm function f(x)=ln(x) is particularly important.
The document provides steps for graphing the cubic function f(x) = 2x^3 - 3x^2 - 12x. Step 1 analyzes the monotonicity of the function by examining the sign chart of its derivative f'(x). Step 2 analyzes concavity by examining the sign chart of the second derivative f''(x). Step 3 combines these analyses into a single sign chart summarizing the function's properties over its domain. The goal is to completely graph the function, indicating zeros, asymptotes, critical points, maxima/minima, and inflection points.
1. The document provides examples and explanations of concepts in solid geometry including the three dimensional coordinate system, distance formula in three space, and equations for planes, spheres, cylinders, quadric surfaces, and their graphs.
2. Key solid geometry concepts covered include plotting points in three dimensions, finding distances between points and distances from a point to a plane, midpoint formulas, and standard and general equations for planes, spheres, cylinders, ellipsoids, hyperboloids, and paraboloids.
3. Examples are given for graphing equations of a plane, sphere, circular cylinder, parabolic cylinder, and their relation to the standard equations.
This document provides instructions for graphing linear equations. It begins with a "Do Now" activity to find and correct mistakes in a sample function table and graph. It then shows examples of graphing different linear equations by plotting points from their function tables on coordinate grids. The document concludes with a prompt to explain to an absent student how to determine from a graph if a mistake was made in a problem.
1) The document is a teacher's notebook that provides instruction on the concept of slope. It includes examples of finding the slope between points on graphs, as well as graphs for the equations y=4x and y=-3x.
2) Students are asked to fill in tables of values and graph lines based on given equations in order to understand how changing the coefficient in the equation affects the slope of the line.
3) The key differences between the graphs of y=4x and y=-3x are explained - the equations have opposite signs for the coefficient, resulting in graphs with opposite slopes.
The document discusses equations of straight lines. It covers determining the gradient and equation of a straight line, as well as representing a line in various forms such as y=mx+c, Ax + By + C = 0, and identifying lines from two points. Key concepts covered include finding the gradient from two points, the relationship between perpendicular lines, and deriving the equation of a line given values for the gradient and a point.
1. The document discusses the concept of tangent lines and slope. It provides 5 examples of calculating the slope of a function at different points to derive the equation of the tangent line.
2. The slopes are calculated by taking the limit as h approaches 0 of the change in y over the change in x.
3. The slopes found were 2, 0, -1/2, 4, and 1/2, leading to tangent lines of y=2x-3, y=-2, y=-x/2+1, y=4x+2, and y=x/2+1 respectively.
This document provides instructions for a 45 minute MATLAB test with 6 questions worth a total of 25 marks. It instructs students to start MATLAB, load the test data, and provides some MATLAB commands that may be useful. It also notes that answers can be exact or numerical to 4 significant figures or decimal places.
5 marks scheme for add maths paper 2 trial spmzabidah awang
1. The document contains the mark scheme and solutions for an Additional Mathematics exam paper with 10 questions.
2. Question 1 involves solving a pair of simultaneous equations to find the values of x and y. Question 2 involves finding the maximum value and graph of a quadratic function.
3. Question 3 examines areas of shapes in a geometric progression. The final area is found to be 17066 cm^2.
4. Subsequent questions cover topics such as function graphs, probability distributions, logarithmic graphs, trigonometry, and simultaneous equations.
5. The last few questions deal with topics like probability, normal distribution, and kinematic equations. Overall the document provides a comprehensive breakdown of the marking scheme
The document contains notes from January 17, 2012 about solving various math word problems:
1) A word problem about a son's age that can be solved two different ways.
2) A word problem about two unknown numbers with relationships between their sums, parts and wholes.
3) A word problem about students cleaning a garbage-filled lot, working for different periods of time in different group sizes.
The document contains calculations to determine the height of geometric shapes given other measurements. For a prism with a volume of 60 cm3, width of 3 cm, and length of 4 cm, the height is calculated as 5 cm. For a cylinder with an area of 175.84 cm2 and radius of 4 cm, the height is calculated as 8 cm.
This document is an untitled notebook from December 15, 2011 that contains time stamps ranging from 10:51 AM to 11:48 AM, with various intervals of time between each entry. There are a total of 3 pages documented.
The document appears to be notes from a meeting or work session on December 13, 2011. It contains time-stamped entries documenting discussions, ideas, and tasks throughout the morning. The contents involve brainstorming and planning, as various concepts and action items are recorded across multiple pages.
1. The document contains the answer key to a math test on quadratic functions.
2. It includes graphing quadratic equations, solving by factoring, identifying properties, using the quadratic formula, modeling real world situations, and applying the Pythagorean theorem and properties of parabolas.
3. Several questions involve finding the vertex, x-intercepts, maximum/minimum values, and distance or drop measures for quadratic equations describing real world motions or sales situations.
This document contains:
1) A key for a quadratic functions test with graphing and solving problems.
2) The test asks students to graph and solve quadratic equations, identify true statements about discriminants and solutions, and solve word problems involving quadratic models.
3) The key provides the full worked out solutions and answers to all problems on the test.
The document contains 23 math problems involving equations, inequalities, geometry concepts like angles and lengths of lines, limits, and other algebraic expressions. The problems cover a wide range of math topics including functions, polynomials, systems of equations, trigonometry, and calculus.
The document discusses graphing quadratic functions of the form f(x) = ax^2 + bx + c. The key points are:
1) The graph of any quadratic function is a parabola.
2) To graph f(x) = a(x - h)^2 + k, find the vertex (h, k), x-intercepts by setting f(x) = 0, y-intercept, and plot points to form the parabola shape.
3) The vertex of f(x) = ax^2 + bx + c is (-b/2a, f(-b/2a)), which is the minimum if a > 0 and maximum if a
The document contains a midterm exam for an ODE class with 6 problems worth 10 points each. Problem 1 asks to find the general solution of a 7th order linear ODE using the method of undetermined coefficients. Problem 2 asks to solve a 2nd order linear ODE using either variation of parameters or undetermined coefficients. Problem 3 asks to solve a nonlinear 2nd order ODE using a substitution. Problem 4 asks to find the equation of motion for a mass attached to a spring with an external force applied. Problem 5 asks to solve an eigenvalue problem for a CE equation. Problem 6 asks to use variation of parameters to solve a 2nd order nonhomogeneous ODE.
This document provides 24 two-step equations to solve. The solutions are provided in curly brackets next to each equation. The equations involve addition, subtraction, multiplication, division, and operations with variables.
The document discusses using functions to find output values from input values. It provides examples of functions in the form of y=fx(x) and has students complete function tables and plot points for various functions. It discusses how the Rube Goldberg cartoon from the beginning uses an input, output, and rule to demonstrate a function.
This document announces the release of Version 5 educational software containing over 15,000 presentation slides, 1,000 example/student questions, 100 worksheets, 1,200 interactive exercises, and 5,000 mental math questions across two CDs. It provides a 7-minute demo of 20 sample slides and directs users to register for a free account to access additional full presentations.
This document provides 20 algebra problems involving simplifying expressions, solving equations, graphing lines, writing equations in slope-intercept form, determining if lines are parallel or perpendicular, and operations with scientific notation. Students are instructed to show all work.
1. The document discusses functions of several variables and partial differentiation.
2. It provides examples of functions with different domains and ranges, such as f(x,y) = x^2 + y^2 which has a domain of all real numbers and a range of non-negative real numbers.
3. It also examines how changing variables in functions impacts the output, like how increasing humidity by 20% at 80 degrees Fahrenheit increases the heat index by about 3 units.
The document contains examples of functions of several variables and their domains and ranges. It provides equations for various functions and graphs their surfaces over different domains. Some key examples include functions defined by equations like x2 + y2 = 1, 2, 3 and functions where increasing one variable by a fixed amount increases the output by a fixed amount.
1) Simultaneous equations involve two variables in two equations that are solved simultaneously to find the values of the variables.
2) To solve simultaneous equations, one first expresses one variable in terms of the other by changing the subject of one linear equation, then substitutes this into the other equation to obtain a quadratic equation.
3) This quadratic equation is then solved using factorisation or the quadratic formula to find the values of the variables that satisfy both original equations.
This document provides an ASSURE model for a math lesson on graphing and interpolating quadratic equations for a high school Algebra 2 class. The lesson objectives are for students to correctly substitute points on a graph into a quadratic function 80% of the time and graph quadratic equations on a graphing calculator choosing an appropriate window 80% of the time. The lesson involves representing quadratic equations as graphs and equations, identifying key features of parabolas, using three points to find the equation of a graph, and practicing with different point sets.
1. This document contains notes and formulas for additional mathematics form 4. It covers topics such as quadratic equations, functions, indices and logarithms, coordinate geometry, and statistics.
2. Quadratic equations are discussed, including finding the roots of a quadratic equation and writing the equation from its roots. Quadratic functions are also covered, specifically the relationship between the sign of b^2 - 4ac and the nature of the roots.
3. Other topics include indices and logarithm laws, coordinate geometry concepts like distance and midpoints, statistics topics such as measures of central tendency (mean, median, mode), and measures of dispersion like standard deviation and interquartile range.
The document provides information and examples on linear laws and linear relationships. It discusses:
- Drawing lines of best fit by inspection of data points.
- Writing equations for lines of best fit in the form of y = mx + c.
- Determining values of variables from lines of best fit and equations.
- Reducing non-linear relationships to linear form by rearranging variables.
- Finding values of constants in non-linear relationships by plotting graphs of best fit lines and determining the gradient and y-intercept.
Worked examples are provided to illustrate key concepts like identifying dependent and independent variables, determining the gradient and y-intercept, and using these to solve for constants in non-
Calculo y geometria analitica (larson hostetler-edwards) 8th ed - solutions m...ELMIR IVAN OZUNA LOPEZ
This document contains the solutions to odd-numbered exercises from Chapter P of a calculus textbook. It provides answers and work for 43 problems involving graphing functions, finding intercepts, determining symmetries, and other skills related to functions and their graphs. The problems progress from simple linear functions to more complex expressions involving square roots, cubes, and other operations.
1. The document contains examples solving systems of linear equations and linear inequalities arising from word problems about mixtures, costs, graphs of lines, and similar contexts.
2. Similar figures and corresponding parts of congruent triangles are used to solve for missing lengths and angle measures.
3. Place value and binary and hexadecimal number systems are explained.
1) The volume of the solid region bounded by z = 9 - x^2 - y in the first octant is found using iterated integration.
2) The volume of the region bounded by z = x^2 + y^2, x^2 + y^2 = 25, and the xy-plane is found using polar coordinates.
3) The double integral of sin(x^2) over the region from 0 to 9 in x and y from 0 to x is evaluated.
1. Basic algebra involves variables, algebraic expressions, and equations. Variables represent unknown values.
2. Algebraic expressions contain variables, numbers, and operators. They can be simplified by combining like terms or using properties of exponents.
3. Equations set two algebraic expressions equal to each other and can be solved algebraically to find the value of variables. There are methods for solving different types of equations like linear, fractional, and simultaneous equations.
1. This document contains 11 multi-part math problems involving systems of equations and inequalities. The problems cover topics such as solving systems graphically, algebraically, and determining if ordered pairs are solutions. They also involve word problems about ages, expenses, and splitting amounts into parts.
2. Key steps addressed include setting up tables of values, identifying line types, finding the solution set intersection, using substitution or elimination methods, stating yes or no for ordered pairs, and drawing graphs of solution sets for systems of inequalities.
3. The problems progress from simpler systems to more complex ones involving multiple equations or inequalities, requiring skills like algebraic manipulation, graphical analysis, and translating word problems into mathematical systems.
1. The solution to the system of equations y=2x and x/5 is (0,0).
2. The solutions to the systems of equations x+y=5 and 3x+2y-14=0 are (3,2) and the solutions to x=3 and y=6.5 are (3,6.5).
3. The system of equations representing spending $164 on books costing $15 each or $17 each can be expressed as a system of first degree equations in two variables.
1) The document discusses solving systems of equations and inequalities. It contains 13 problems involving setting up, graphing and solving systems of linear and nonlinear equations and inequalities.
2) The problems cover a range of techniques for solving systems, including substitution, elimination, graphing, and applying constraints to identify variable values that satisfy simultaneous relationships.
3) The document provides practice with setting up and solving different types of systems, as well as interpreting solutions in the context of word problems about rates, prices, ages and coin values.
The document contains 14 problems involving systems of equations and inequalities. Problem 1 asks for the solution of a system of equations as an ordered pair. Problem 2 asks to determine the solution set of another system of equations. Problem 3 asks to express a word problem as a system of two equations.
This document contains 11 problems involving quadratic functions and equations. The problems cover graphing quadratic functions, solving quadratic equations by factoring and using the quadratic formula, identifying properties of quadratic functions, modeling real-world word problems with quadratic equations, and applying the Pythagorean theorem and properties of parabolas.
This document provides 10 problems involving quadratic functions and equations: (1) graphing quadratic equations; (2) solving quadratic equations by factoring; (3) identifying true statements about quadratic equations; (4) solving quadratic equations using the quadratic formula; (5) writing an equation to model profit from bracelet sales; (6) writing an equation for the sum of squares of two consecutive even numbers; (7) analyzing a graph of a quadratic function; (8) solving for measurements of a rhombus given information about its diagonals and area; (9) solving for the number of students in a classroom given information about class time and changes in time per student; (10) solving application problems involving the height
This document contains 10 problems related to quadratic functions and equations. The problems cover topics such as: 1) graphing quadratic functions, 2) solving quadratic equations by factoring and using the quadratic formula, 3) identifying properties of quadratic functions from their graphs or equations, and 4) modeling real-world situations using quadratic equations. The goal is to demonstrate understanding of key concepts for quadratic functions and practice applying various techniques for solving quadratic equations.
This document contains 10 word problems involving quadratic functions. Each problem provides relationships between two or more numbers and asks the reader to determine the specific values of those numbers based on the given information. The problems cover a variety of quadratic equation scenarios including differences, sums, products, and consecutive numbers.
The document provides 10 examples of word problems involving quadratic equations. For each problem it defines the variables, sets up the quadratic equation, solves for the zeros, and states the answer.
This document contains 11 problems involving quadratic functions and equations. The problems cover graphing quadratic functions, solving quadratic equations by factoring and using the quadratic formula, identifying properties of quadratic functions, modeling real-world word problems with quadratic equations, and applying the Pythagorean theorem and properties of parabolas.
This document provides 10 problems involving quadratic functions and equations: (1) graphing quadratic equations; (2) solving quadratic equations by factoring; (3) identifying true statements about quadratic equations; (4) solving quadratic equations using the quadratic formula; (5) writing an equation to model profit from bracelet sales; (6) writing an equation for the sum of squares of two consecutive even numbers; (7) analyzing a graph of a quadratic function; (8) finding measurements of diagonals of a rhombus using its area; (9) determining the number of students in a classroom using time per student; (10) analyzing the height of a hot air balloon over time.
This document contains 10 problems related to quadratic functions and equations. The problems cover topics such as: 1) graphing quadratic functions, 2) solving quadratic equations by factoring and using the quadratic formula, 3) identifying properties of quadratic functions from their graphs or equations, and 4) modeling real-world situations using quadratic equations. The goal is to demonstrate understanding of key concepts for quadratic functions and practice applying various techniques for solving quadratic equations.
This document contains the answer key for a math test on quadratic functions. It includes:
1) Graphing quadratic equations and finding vertices, zeros, and y-intercepts.
2) Solving quadratic equations by factoring.
3) Using the quadratic formula to solve equations.
4) Questions about salaries as a function of goals scored, the areas of trapezoids, and the maximum height of a tennis ball thrown in the air.
Introduction of Cybersecurity with OSS at Code Europe 2024Hiroshi SHIBATA
I develop the Ruby programming language, RubyGems, and Bundler, which are package managers for Ruby. Today, I will introduce how to enhance the security of your application using open-source software (OSS) examples from Ruby and RubyGems.
The first topic is CVE (Common Vulnerabilities and Exposures). I have published CVEs many times. But what exactly is a CVE? I'll provide a basic understanding of CVEs and explain how to detect and handle vulnerabilities in OSS.
Next, let's discuss package managers. Package managers play a critical role in the OSS ecosystem. I'll explain how to manage library dependencies in your application.
I'll share insights into how the Ruby and RubyGems core team works to keep our ecosystem safe. By the end of this talk, you'll have a better understanding of how to safeguard your code.
AI 101: An Introduction to the Basics and Impact of Artificial IntelligenceIndexBug
Imagine a world where machines not only perform tasks but also learn, adapt, and make decisions. This is the promise of Artificial Intelligence (AI), a technology that's not just enhancing our lives but revolutionizing entire industries.
HCL Notes and Domino License Cost Reduction in the World of DLAUpanagenda
Webinar Recording: https://www.panagenda.com/webinars/hcl-notes-and-domino-license-cost-reduction-in-the-world-of-dlau/
The introduction of DLAU and the CCB & CCX licensing model caused quite a stir in the HCL community. As a Notes and Domino customer, you may have faced challenges with unexpected user counts and license costs. You probably have questions on how this new licensing approach works and how to benefit from it. Most importantly, you likely have budget constraints and want to save money where possible. Don’t worry, we can help with all of this!
We’ll show you how to fix common misconfigurations that cause higher-than-expected user counts, and how to identify accounts which you can deactivate to save money. There are also frequent patterns that can cause unnecessary cost, like using a person document instead of a mail-in for shared mailboxes. We’ll provide examples and solutions for those as well. And naturally we’ll explain the new licensing model.
Join HCL Ambassador Marc Thomas in this webinar with a special guest appearance from Franz Walder. It will give you the tools and know-how to stay on top of what is going on with Domino licensing. You will be able lower your cost through an optimized configuration and keep it low going forward.
These topics will be covered
- Reducing license cost by finding and fixing misconfigurations and superfluous accounts
- How do CCB and CCX licenses really work?
- Understanding the DLAU tool and how to best utilize it
- Tips for common problem areas, like team mailboxes, functional/test users, etc
- Practical examples and best practices to implement right away
Ivanti’s Patch Tuesday breakdown goes beyond patching your applications and brings you the intelligence and guidance needed to prioritize where to focus your attention first. Catch early analysis on our Ivanti blog, then join industry expert Chris Goettl for the Patch Tuesday Webinar Event. There we’ll do a deep dive into each of the bulletins and give guidance on the risks associated with the newly-identified vulnerabilities.
Have you ever been confused by the myriad of choices offered by AWS for hosting a website or an API?
Lambda, Elastic Beanstalk, Lightsail, Amplify, S3 (and more!) can each host websites + APIs. But which one should we choose?
Which one is cheapest? Which one is fastest? Which one will scale to meet our needs?
Join me in this session as we dive into each AWS hosting service to determine which one is best for your scenario and explain why!
Unlock the Future of Search with MongoDB Atlas_ Vector Search Unleashed.pdfMalak Abu Hammad
Discover how MongoDB Atlas and vector search technology can revolutionize your application's search capabilities. This comprehensive presentation covers:
* What is Vector Search?
* Importance and benefits of vector search
* Practical use cases across various industries
* Step-by-step implementation guide
* Live demos with code snippets
* Enhancing LLM capabilities with vector search
* Best practices and optimization strategies
Perfect for developers, AI enthusiasts, and tech leaders. Learn how to leverage MongoDB Atlas to deliver highly relevant, context-aware search results, transforming your data retrieval process. Stay ahead in tech innovation and maximize the potential of your applications.
#MongoDB #VectorSearch #AI #SemanticSearch #TechInnovation #DataScience #LLM #MachineLearning #SearchTechnology
GraphRAG for Life Science to increase LLM accuracyTomaz Bratanic
GraphRAG for life science domain, where you retriever information from biomedical knowledge graphs using LLMs to increase the accuracy and performance of generated answers
Programming Foundation Models with DSPy - Meetup SlidesZilliz
Prompting language models is hard, while programming language models is easy. In this talk, I will discuss the state-of-the-art framework DSPy for programming foundation models with its powerful optimizers and runtime constraint system.
5th LF Energy Power Grid Model Meet-up SlidesDanBrown980551
5th Power Grid Model Meet-up
It is with great pleasure that we extend to you an invitation to the 5th Power Grid Model Meet-up, scheduled for 6th June 2024. This event will adopt a hybrid format, allowing participants to join us either through an online Mircosoft Teams session or in person at TU/e located at Den Dolech 2, Eindhoven, Netherlands. The meet-up will be hosted by Eindhoven University of Technology (TU/e), a research university specializing in engineering science & technology.
Power Grid Model
The global energy transition is placing new and unprecedented demands on Distribution System Operators (DSOs). Alongside upgrades to grid capacity, processes such as digitization, capacity optimization, and congestion management are becoming vital for delivering reliable services.
Power Grid Model is an open source project from Linux Foundation Energy and provides a calculation engine that is increasingly essential for DSOs. It offers a standards-based foundation enabling real-time power systems analysis, simulations of electrical power grids, and sophisticated what-if analysis. In addition, it enables in-depth studies and analysis of the electrical power grid’s behavior and performance. This comprehensive model incorporates essential factors such as power generation capacity, electrical losses, voltage levels, power flows, and system stability.
Power Grid Model is currently being applied in a wide variety of use cases, including grid planning, expansion, reliability, and congestion studies. It can also help in analyzing the impact of renewable energy integration, assessing the effects of disturbances or faults, and developing strategies for grid control and optimization.
What to expect
For the upcoming meetup we are organizing, we have an exciting lineup of activities planned:
-Insightful presentations covering two practical applications of the Power Grid Model.
-An update on the latest advancements in Power Grid -Model technology during the first and second quarters of 2024.
-An interactive brainstorming session to discuss and propose new feature requests.
-An opportunity to connect with fellow Power Grid Model enthusiasts and users.
HCL Notes und Domino Lizenzkostenreduzierung in der Welt von DLAUpanagenda
Webinar Recording: https://www.panagenda.com/webinars/hcl-notes-und-domino-lizenzkostenreduzierung-in-der-welt-von-dlau/
DLAU und die Lizenzen nach dem CCB- und CCX-Modell sind für viele in der HCL-Community seit letztem Jahr ein heißes Thema. Als Notes- oder Domino-Kunde haben Sie vielleicht mit unerwartet hohen Benutzerzahlen und Lizenzgebühren zu kämpfen. Sie fragen sich vielleicht, wie diese neue Art der Lizenzierung funktioniert und welchen Nutzen sie Ihnen bringt. Vor allem wollen Sie sicherlich Ihr Budget einhalten und Kosten sparen, wo immer möglich. Das verstehen wir und wir möchten Ihnen dabei helfen!
Wir erklären Ihnen, wie Sie häufige Konfigurationsprobleme lösen können, die dazu führen können, dass mehr Benutzer gezählt werden als nötig, und wie Sie überflüssige oder ungenutzte Konten identifizieren und entfernen können, um Geld zu sparen. Es gibt auch einige Ansätze, die zu unnötigen Ausgaben führen können, z. B. wenn ein Personendokument anstelle eines Mail-Ins für geteilte Mailboxen verwendet wird. Wir zeigen Ihnen solche Fälle und deren Lösungen. Und natürlich erklären wir Ihnen das neue Lizenzmodell.
Nehmen Sie an diesem Webinar teil, bei dem HCL-Ambassador Marc Thomas und Gastredner Franz Walder Ihnen diese neue Welt näherbringen. Es vermittelt Ihnen die Tools und das Know-how, um den Überblick zu bewahren. Sie werden in der Lage sein, Ihre Kosten durch eine optimierte Domino-Konfiguration zu reduzieren und auch in Zukunft gering zu halten.
Diese Themen werden behandelt
- Reduzierung der Lizenzkosten durch Auffinden und Beheben von Fehlkonfigurationen und überflüssigen Konten
- Wie funktionieren CCB- und CCX-Lizenzen wirklich?
- Verstehen des DLAU-Tools und wie man es am besten nutzt
- Tipps für häufige Problembereiche, wie z. B. Team-Postfächer, Funktions-/Testbenutzer usw.
- Praxisbeispiele und Best Practices zum sofortigen Umsetzen
Project Management Semester Long Project - Acuityjpupo2018
Acuity is an innovative learning app designed to transform the way you engage with knowledge. Powered by AI technology, Acuity takes complex topics and distills them into concise, interactive summaries that are easy to read & understand. Whether you're exploring the depths of quantum mechanics or seeking insight into historical events, Acuity provides the key information you need without the burden of lengthy texts.
Taking AI to the Next Level in Manufacturing.pdfssuserfac0301
Read Taking AI to the Next Level in Manufacturing to gain insights on AI adoption in the manufacturing industry, such as:
1. How quickly AI is being implemented in manufacturing.
2. Which barriers stand in the way of AI adoption.
3. How data quality and governance form the backbone of AI.
4. Organizational processes and structures that may inhibit effective AI adoption.
6. Ideas and approaches to help build your organization's AI strategy.
Monitoring and Managing Anomaly Detection on OpenShift.pdfTosin Akinosho
Monitoring and Managing Anomaly Detection on OpenShift
Overview
Dive into the world of anomaly detection on edge devices with our comprehensive hands-on tutorial. This SlideShare presentation will guide you through the entire process, from data collection and model training to edge deployment and real-time monitoring. Perfect for those looking to implement robust anomaly detection systems on resource-constrained IoT/edge devices.
Key Topics Covered
1. Introduction to Anomaly Detection
- Understand the fundamentals of anomaly detection and its importance in identifying unusual behavior or failures in systems.
2. Understanding Edge (IoT)
- Learn about edge computing and IoT, and how they enable real-time data processing and decision-making at the source.
3. What is ArgoCD?
- Discover ArgoCD, a declarative, GitOps continuous delivery tool for Kubernetes, and its role in deploying applications on edge devices.
4. Deployment Using ArgoCD for Edge Devices
- Step-by-step guide on deploying anomaly detection models on edge devices using ArgoCD.
5. Introduction to Apache Kafka and S3
- Explore Apache Kafka for real-time data streaming and Amazon S3 for scalable storage solutions.
6. Viewing Kafka Messages in the Data Lake
- Learn how to view and analyze Kafka messages stored in a data lake for better insights.
7. What is Prometheus?
- Get to know Prometheus, an open-source monitoring and alerting toolkit, and its application in monitoring edge devices.
8. Monitoring Application Metrics with Prometheus
- Detailed instructions on setting up Prometheus to monitor the performance and health of your anomaly detection system.
9. What is Camel K?
- Introduction to Camel K, a lightweight integration framework built on Apache Camel, designed for Kubernetes.
10. Configuring Camel K Integrations for Data Pipelines
- Learn how to configure Camel K for seamless data pipeline integrations in your anomaly detection workflow.
11. What is a Jupyter Notebook?
- Overview of Jupyter Notebooks, an open-source web application for creating and sharing documents with live code, equations, visualizations, and narrative text.
12. Jupyter Notebooks with Code Examples
- Hands-on examples and code snippets in Jupyter Notebooks to help you implement and test anomaly detection models.
Presentation of the OECD Artificial Intelligence Review of Germany
Mth 4108-1 a (ans)
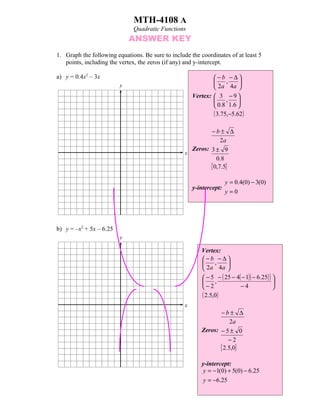
1. MTH-4108 A
Quadratic Functions
ANSWER KEY
1. Graph the following equations. Be sure to include the coordinates of at least 5
points, including the vertex, the zeros (if any) and y-intercept.
a) y = 0.4x2 – 3x −b −∆
,
y 2a 4 a
Vertex: 3 − 9
,
0.8 1.6
( 3.75,−5.62)
−b± ∆
2a
Zeros: 3 ± 9
x
0.8
{ 0,7.5}
y = 0.4(0) − 3(0)
y-intercept:
y=0
b) y = –x2 + 5x – 6.25
y
Vertex:
−b −∆
,
2a 4a
− 5 − ( 25 − 4( − 1)( − 6.25) )
,
−2 −4
( 2.5,0)
x
−b± ∆
2a
Zeros: − 5 ± 0
−2
{ 2.5,0}
y-intercept:
y = −1(0) + 5(0) − 6.25
y = −6.25
2. c) y = 2x2 + 4x + 3 Vertex:
y −b −∆
,
2a 4a
− 4 − (16 − 4( 2)( 3) )
,
4 8
( − 1,1)
−b± ∆
2a
x Zeros: − 4 ± − 8
4
{ ∅}
y-intercept:
y = 2(0) + 4(0) + 3
y =3
/30
2. Solve the following equations by factoring:
a) 25x2 – 1 = 0 ( 5x − 1) ⇒ 5 x = 1 ⇒ x = 5
1
( 5x + 1) ⇒ 5 x = −1 ⇒ x = − 1 5
2 x 2 + 8 x − 5 x − 20 = 0
b) 2x2 + 3x – 20 = 0 2 x( x + 4 ) − 5( x + 4)
( 2 x − 5) ⇒ 2 x = 5 ⇒ x = 5 2 /5
( x + 4 ) ⇒ x = −4
3. CIRCLE the true statement(s) below:
a) If ∆ = 0 for a quadratic equation, it means that there are 2 solutions with
one solution equal to 0.
b) If the discriminant is less than 0, it means that there are no real solutions
for this equation.
c) If an equation has two zeros which are equal to each other it means that ∆ = 0
d) If an equation has one negative solution, it is impossible that the other
solution is positive if ∆ > 0.
e) If the discriminant is equal to zero then the equation has no solution.
/5
3. 4. Solve the following equations using the quadratic formula. Clearly indicate the
value of ∆ and round your answers to the nearest thousandth when necessary.
a) 0.5x2 + 4x – 5 = 0 −b± ∆
2a
Zeros: − 4 ± (16 − 4( 0.5)( − 5) )
1
{ − 9.099,1.099}
b) -x2 – x – 11.25 = 0 −b± ∆
3
2a
Zeros: 1 ± (1 − 4(− 13 )( − 11.25) )
−2
3
{ ∅}
/10
5. A professional hockey player scores 30 goals in one season and earns $1 800 000,
for an average salary of $60 000 per goal. His contract states that for each
additional goal, his average salary will increase by $100. The table below
illustrates his salary as a function of how many goals he scores.
No. of goals Number of Average salary per goal Total salary
scored after 30 total goals
0 30 $60 000 $1 800 000
1 30 + 1 = 31 60 000 + (100× 1) = $60 100 $1 863 100
2 30 + 2 = 32 60 000 + (100× 2) = $60 200 $1 926 400
x 30 + x 60 000 + (100× x) (30 + x)(60000 + 100x)
Write the equation in the form ax2 + bx + c which illustrates this situation.
( 30 + x )( 60000 + 100 x )
1800000 + 3000 x + 60000 x + 100 x 2
y = 100 x 2 + 63000 x + 1800000
/10
4. 6. Answer the following questions using the graph below:
0.5x2 – x – 4 = y
y
x
Vertex:
a) What are the coordinates of the vertex?
− b − ∆ 1 − (1 − 4( 0.5)( − 4 ) )
, ⇒ , ⇒ (1,−4.5)
2a 4a 1 2
b) What is the equation of the axis of symmetry?
x=1
c) Is there a maximum or a minimum?
Minimum of -4.5
d) What are the zeros?
−b± ∆ 1± 9
Zeros: ⇒ ⇒ { − 2,4}
2a 1
e) What is the y-intercept?
y-intercept: y = 0.5(0) − (0) − 4 ⇒ y = −4
/5
7. Without calculating, write the equation in the form ax2 + bx + c which illustrates
the following situation:
The sum of two numbers is 100 and their product is 2 356.
Let x = 1st number
Let 100 – x = 2nd number
x(100 − x ) = 2356
100 x − x 2 = 2356
x 2 − 100 x + 2356 = 0
/5
5. 8. The small base of a trapezoid measures double the height. The large base
measures 3 metres more than the small base and the area of the trapezoid is equal
to 123.75 metres squared. What are the measurements of the small base, large
base and height of this trapezoid?
Let x = height
Let 2x = small base
Let 2x + 3 = large base
x[ 2 x + ( 2 x + 3) ]
= 123.75 −b± ∆
2
2a
x[ 4 x + 3]
= 123.75 − 3 ± 9 − 4( 4 )( − 247.5)
2
Zeros: 8
4 x 2 + 3 x 123.75
= − 3 ± 3969
2 1
4 x + 3 x = 247.5
2 8
{ − 8.25,7.5}
4 x 2 + 3 x − 247.5 = 0
/5
9. A sports store sells a certain number of bicycles at the regular price and receives
$17 500 profit. The following week the bikes go on sale for $150 less each
bicycle, and the store sells 15 more bicycles for the same total profit as the
previous week. What is the regular price of one bicycle?
Let x = price of one bicycle
17500 17500
+ 15 = −b± ∆
x x − 150
17500 + 15 x 17500 2a
=
x x − 150 150 ± 22500 − 4(1)( − 175000 )
17500 x − 2625000 + 15 x 2 − 2250 x = 17500 x Zeros: 2
150 ± 850
15 x 2 − 2250 x − 2625000 = 0
2
{ − 350,500}
x 2 − 150 x − 175000 = 0
/10
6. 10. We throw a tennis ball off the school roof. The equation of the height (y) of the
ball in metres is: y = 10 + 8.75t – 5t2, where t represents the time in minutes.
a) What is the maximum height obtained by the ball?
Vertex:
− b − ∆ − 8.75 − ( 76.5625 − 4( − 5)(10 ) )
, ⇒ , ⇒ ( 0.875,13.8)
2a 4a − 10 − 20
b) After how many minutes is the maximum height obtained?
Vertex:
− b − ∆ − 8.75 − ( 76.5625 − 4( − 5)(10 ) )
, ⇒ , ⇒ ( 0.875,13.8)
2a 4a − 10 − 20
c) If the school is 7m high, after how many minutes does the ball land?
7 = −5t 2 + 8.75t + 10
y-coordinate:
0 = −5t 2 + 8.75t + 3
−b± ∆ − 8.75 ± 8.752 − 4( − 5)( 3) − 8.75 ± 136.5625
⇒ ⇒
Zeros: 2a − 10 − 10
{ − 0.294,2.044}
Round your answers to the nearest hundredth.
/15