This document contains an answer key for a quiz on quadratic functions. It includes:
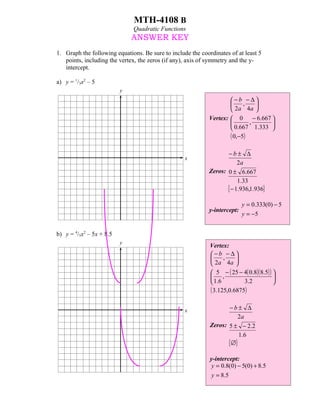
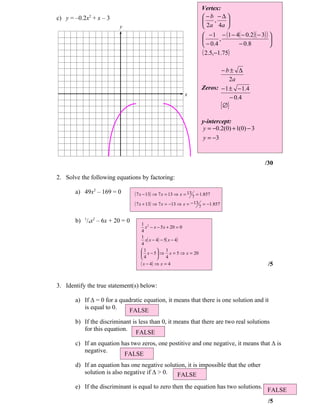
1) Graphing quadratic equations and identifying vertex, zeros, axis of symmetry, and y-intercept.
2) Solving quadratic equations by factoring.
3) Identifying true statements about the discriminant and solutions of a quadratic equation.
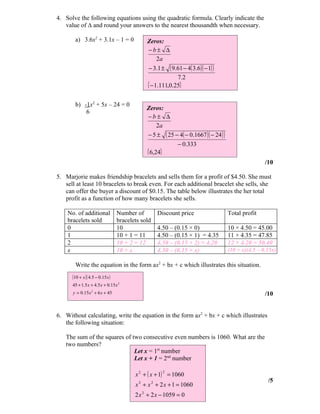
4) Solving quadratic equations using the quadratic formula and identifying the discriminant and solutions.
5) Writing the equation for a situation involving profit from selling bracelets with discounts.
6) Writing the equation for a situation involving the sum of squares of consecutive even numbers.
7) Analyzing the graph of a quadratic equation to identify the vertex,
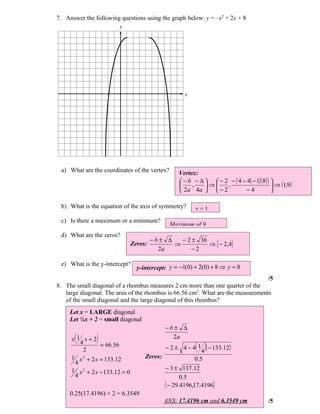
The document contains an answer key for a mathematics assignment on quadratic functions. It includes:
1) Graphing quadratic equations and identifying vertex, zeros, and y-intercept.
2) Solving quadratic equations by factoring.
3) Identifying true statements about quadratic functions.
4) Solving quadratic equations using the quadratic formula.
5) Setting up and solving an optimization word problem involving quadratic sales based on number of items sold.
6) Answering true/false questions based on a graph of a quadratic function.
7) Writing the quadratic equation for an age relationship problem.
8) Setting up the Pythagorean theorem to solve for side lengths of
This document contains the answer key for a math test on quadratic functions. It includes:
1) Graphing quadratic equations and finding vertices, zeros, and y-intercepts.
2) Solving quadratic equations by factoring.
3) Using the quadratic formula to solve equations.
4) Questions about salaries as a function of goals scored, the areas of trapezoids, and the maximum height of a tennis ball thrown in the air.
This document provides the final mark scheme for Edexcel's Core Mathematics C1 exam from January 2012. It lists the questions, schemes for awarding marks, and total marks for each question. The six mark questions cover topics like algebra, inequalities, coordinate geometry, and calculus. The longer questions involve multi-step problems applying these concepts, including sketching curves, finding equations of tangents and normals, and solving word problems involving formulas.
This document announces the release of Version 5 educational software containing over 15,000 presentation slides, 1,000 example/student questions, 100 worksheets, 1,200 interactive exercises, and 5,000 mental math questions across two CDs. It provides a 7-minute demo of 20 sample slides and directs users to register for a free account to access additional full presentations.
This document discusses concepts and examples related to derivatives and critical points. It provides:
1) Examples of functions with critical points identified by setting the derivative equal to zero and finding the x-values that satisfy this. Maximum and minimum values are identified.
2) Practice problems for students to find the critical points, maximum/minimum values, and evaluate functions at critical points.
3) Additional examples illustrate situations where the derivative is undefined or does not equal zero at critical points.
This document contains 14 math problems involving calculating the area under curves using definite integrals. The problems include finding the area under functions such as x2, √x, sec2x, and siny from given bounds. The areas are calculated and expressed as fractions or simplified numeric values.
The document contains examples of functions of several variables and their domains and ranges. It provides equations for various functions and graphs their surfaces over different domains. Some key examples include functions defined by equations like x2 + y2 = 1, 2, 3 and functions where increasing one variable by a fixed amount increases the output by a fixed amount.
1. The document provides examples and explanations of concepts in solid geometry including the three dimensional coordinate system, distance formula in three space, and equations for planes, spheres, cylinders, quadric surfaces, and their graphs.
2. Key solid geometry concepts covered include plotting points in three dimensions, finding distances between points and distances from a point to a plane, midpoint formulas, and standard and general equations for planes, spheres, cylinders, ellipsoids, hyperboloids, and paraboloids.
3. Examples are given for graphing equations of a plane, sphere, circular cylinder, parabolic cylinder, and their relation to the standard equations.
Calculo y geometria analitica (larson hostetler-edwards) 8th ed - solutions m...ELMIR IVAN OZUNA LOPEZ
This document contains the solutions to odd-numbered exercises from Chapter P of a calculus textbook. It provides answers and work for 43 problems involving graphing functions, finding intercepts, determining symmetries, and other skills related to functions and their graphs. The problems progress from simple linear functions to more complex expressions involving square roots, cubes, and other operations.
1. The document provides examples and explanations of key concepts in geometry including Cartesian coordinates, distance between points, types of triangles, area of triangles and polygons, division of line segments, slope and inclination of lines, and angle between two lines.
2. One example shows that the points (-2, 0), (2, 3) and (5, -1) are the vertices of a right triangle by applying the Pythagorean theorem.
3. Another example finds the area of the triangle with vertices (5, 4), (-2, 1) and (2, -3) to be 20 square units using the area formula.
5 marks scheme for add maths paper 2 trial spmzabidah awang
1. The document contains the mark scheme and solutions for an Additional Mathematics exam paper with 10 questions.
2. Question 1 involves solving a pair of simultaneous equations to find the values of x and y. Question 2 involves finding the maximum value and graph of a quadratic function.
3. Question 3 examines areas of shapes in a geometric progression. The final area is found to be 17066 cm^2.
4. Subsequent questions cover topics such as function graphs, probability distributions, logarithmic graphs, trigonometry, and simultaneous equations.
5. The last few questions deal with topics like probability, normal distribution, and kinematic equations. Overall the document provides a comprehensive breakdown of the marking scheme
The document contains information about k-means clustering:
(1) It describes the basic k-means clustering algorithm which assigns data points to k clusters by minimizing the within-cluster sum of squares.
(2) It provides details on how k-means clustering is implemented, including randomly initializing cluster centers, assigning points to the closest center, and recalculating centers as the mean of each cluster.
(3) It notes some of the challenges with k-means clustering, including that it does not work well for non-convex clusters and can get stuck in local optima depending on random initialization.
The document contains data from a k-means clustering algorithm with 5 clusters. It shows the cluster assignments of 50 data points to the 5 clusters over 10 iterations. The data points are numbered 0-49 on the x-axis and assigned to clusters 0-4 on the y-axis. The cluster assignments change over the 10 iterations as the k-means algorithm converges.
This document contains a large collection of mathematical expressions, equations, and sets. Some key points:
- It includes expressions like n(A), n(B), n[(A-B)(B-A)], and n(A × B) with various values.
- There are several equations set equal to values, such as x2 - 3x < 0, -2 < log < -1, and equations containing sums, integrals, and logarithms.
- Sets are defined containing various elements like numbers, vectors, and functions.
This document summarizes key concepts in unconstrained optimization of functions with two variables, including:
1) Critical points are found by taking the partial derivatives and setting them equal to zero, generalizing the first derivative test for single-variable functions.
2) The Hessian matrix generalizes the second derivative, with its entries being the partial derivatives evaluated at a critical point.
3) The second derivative test classifies critical points as local maxima, minima or saddle points based on the signs of the Hessian matrix's eigenvalues.
4) Taylor polynomial approximations in two variables involve partial derivatives up to second order, analogous to single-variable Taylor series.
5) An example classifies the critical points
1. This document contains examples of finding antiderivatives (indefinite integrals) of various functions.
2. The examples demonstrate using basic integration rules like power rule, reverse derivative rule, trigonometric integral formulas to find antiderivatives.
3. Additional examples show using initial conditions to determine an unknown constant term when an antiderivative is given in terms of an arbitrary constant.
The document provides steps for graphing the cubic function f(x) = 2x^3 - 3x^2 - 12x. Step 1 analyzes the monotonicity of the function by examining the sign chart of its derivative f'(x). Step 2 analyzes concavity by examining the sign chart of the second derivative f''(x). Step 3 combines these analyses into a single sign chart summarizing the function's properties over its domain. The goal is to completely graph the function, indicating zeros, asymptotes, critical points, maxima/minima, and inflection points.
This document provides a marking scheme for an Additional Mathematics paper 2 trial examination from 2010. It consists of 7 questions, each with multiple parts. For each question, it lists the number of marks awarded for various steps in the solutions, such as setting up the correct formula, performing calculations accurately, obtaining the right solution, plotting points correctly, and using appropriate mathematical reasoning. The highest number of marks for a single question is 8 marks. The marking scheme evaluates multiple aspects of students' work and reasoning for 7 multi-step mathematics problems.
This document provides instructions for a 45 minute MATLAB test with 6 questions worth a total of 25 marks. It instructs students to start MATLAB, load the test data, and provides some MATLAB commands that may be useful. It also notes that answers can be exact or numerical to 4 significant figures or decimal places.
This document contains:
1) An announcement about an assigned problem set due November 28th and office hours.
2) A summary of the regression theorem for finding local maxima, minima, and saddle points of functions with two variables.
3) An example of classifying critical points of a function.
4) A discussion of finding the line of best fit to a set of data points by minimizing the sum of squared errors between the data points and fitted line.
The document presents a linear regression analysis of sodium sulfite concentration (%w) and iron concentration (ppm) in waste water samples collected over 23 days. Key findings include:
1) A linear regression model was fit relating sodium sulfite to iron.
2) Statistical tests showed the relationship between the two variables was statistically significant.
3) Residual analysis confirmed assumptions of linearity, normality and constant variance were met.
This document contains 20 multiple integral exercises with solutions. Some of the exercises involve calculating double integrals over specified regions, while others involve setting up approximations of double integrals using Riemann sums. Exercise 19 involves sketching solid regions in 3D space and Exercise 20 involves sketching surfaces defined by z=f(x,y).
1) The document is a teacher's notebook that provides instruction on the concept of slope. It includes examples of finding the slope between points on graphs, as well as graphs for the equations y=4x and y=-3x.
2) Students are asked to fill in tables of values and graph lines based on given equations in order to understand how changing the coefficient in the equation affects the slope of the line.
3) The key differences between the graphs of y=4x and y=-3x are explained - the equations have opposite signs for the coefficient, resulting in graphs with opposite slopes.
This document contains 10 problems related to quadratic functions and equations. The problems cover topics such as: 1) graphing quadratic functions, 2) solving quadratic equations by factoring and using the quadratic formula, 3) identifying properties of quadratic functions from their graphs or equations, and 4) modeling real-world situations using quadratic equations. The goal is to demonstrate understanding of key concepts for quadratic functions and practice applying various techniques for solving quadratic equations.
The document appears to be notes from an unnamed notebook on January 20, 2012. It contains brief time-stamped entries recording activities between 10:56 AM and 11:35 AM, including entries at 10:56 AM, 10:57 AM, 11:02 AM, 11:07 AM, 11:08 AM, 11:12 AM, 11:15 AM, 11:20 AM, 11:22 AM, 11:23 AM, 11:28 AM, and 11:35 AM.
1. The document contains the answer key to a math test on quadratic functions.
2. It includes graphing quadratic equations, solving by factoring, identifying properties, using the quadratic formula, modeling real world situations, and applying the Pythagorean theorem and properties of parabolas.
3. Several questions involve finding the vertex, x-intercepts, maximum/minimum values, and distance or drop measures for quadratic equations describing real world motions or sales situations.
This document contains an answer key for a math worksheet on quadratic functions. It includes:
1) Graphing quadratic equations and finding vertices, zeros, and y-intercepts.
2) Solving quadratic equations by factoring.
3) Identifying true statements about the discriminant and solutions of quadratic equations.
4) Solving quadratic equations using the quadratic formula.
5) Writing the equation for a situation where a hockey player's salary is a quadratic function of his goals.
6) Analyzing the graph of a quadratic equation.
7) Writing the equation for a situation where the sum and product of two numbers is given.
8) Setting up and
1. The document discusses functions of several variables and partial differentiation.
2. It provides examples of functions with different domains and ranges, such as f(x,y) = x^2 + y^2 which has a domain of all real numbers and a range of non-negative real numbers.
3. It also examines how changing variables in functions impacts the output, like how increasing humidity by 20% at 80 degrees Fahrenheit increases the heat index by about 3 units.
The document contains 23 math problems involving equations, inequalities, geometry concepts like angles and lengths of lines, limits, and other algebraic expressions. The problems cover a wide range of math topics including functions, polynomials, systems of equations, trigonometry, and calculus.
1. The document discusses concepts related to derivatives including tangent lines, secant lines, and average velocity. It provides examples of calculating the slope of various functions at given points.
2. Formulas are given for calculating the instantaneous rate of change and average rate of change for functions related to distance, velocity, and other variables with respect to time.
3. Examples are worked through for finding the instantaneous rates of change for various functions at given points to determine when the rates are positive, negative, or zero.
1. The document discusses concepts related to derivatives including tangent lines, secant lines, and average velocity. It provides examples of calculating the slope of tangent lines.
2. Formulas are given for calculating the derivative using limits, and examples are worked out for various functions including polynomials, square roots, and trigonometric functions.
3. Applications discussed include calculating instantaneous rates of change, velocity, acceleration, and related rates.
1. The document contains examples solving systems of linear equations and linear inequalities arising from word problems about mixtures, costs, graphs of lines, and similar contexts.
2. Similar figures and corresponding parts of congruent triangles are used to solve for missing lengths and angle measures.
3. Place value and binary and hexadecimal number systems are explained.
Cosmin Crucean: Perturbative QED on de Sitter Universe.SEENET-MTP
The document summarizes key aspects of quantum field theory on de Sitter spacetime, including solutions to the Dirac, scalar, electromagnetic, and other field equations. It presents:
1) Fundamental solutions for the Dirac equation and orthonormalization relations for Dirac spinor modes.
2) Solutions to the Klein-Gordon equation for a scalar field and corresponding orthonormalization relations.
3) Quantization of electromagnetic vector potentials in the Coulomb gauge and orthonormalization relations for photon modes.
1. Basic algebra involves variables, algebraic expressions, and equations. Variables represent unknown values.
2. Algebraic expressions contain variables, numbers, and operators. They can be simplified by combining like terms or using properties of exponents.
3. Equations set two algebraic expressions equal to each other and can be solved algebraically to find the value of variables. There are methods for solving different types of equations like linear, fractional, and simultaneous equations.
1. The document discusses the concept of tangent lines and slope. It provides 5 examples of calculating the slope of a function at different points to derive the equation of the tangent line.
2. The slopes are calculated by taking the limit as h approaches 0 of the change in y over the change in x.
3. The slopes found were 2, 0, -1/2, 4, and 1/2, leading to tangent lines of y=2x-3, y=-2, y=-x/2+1, y=4x+2, and y=x/2+1 respectively.
1) The document provides examples of calculating the slope of tangent lines to functions at given points using limits.
2) Slope is used to find the equation of the tangent line.
3) Examples calculate slopes and tangent lines for a variety of functions including polynomials, exponentials, and implicit functions.
1. The document discusses the concept of tangent lines and slope. It provides 5 examples of calculating the slope of a function at different points to derive the equation of the tangent line.
2. The slopes are calculated by taking the limit as h approaches 0 of the change in y over the change in x.
3. The slopes found were 2, 0, -1/2, 4, and 1/2, leading to tangent lines of y=2x-3, y=-2, y=-x/2+1, y=4x+2, and y=x/2+1 respectively.
1) Simultaneous equations involve two variables in two equations that are solved simultaneously to find the values of the variables.
2) To solve simultaneous equations, one first expresses one variable in terms of the other by changing the subject of one linear equation, then substitutes this into the other equation to obtain a quadratic equation.
3) This quadratic equation is then solved using factorisation or the quadratic formula to find the values of the variables that satisfy both original equations.
This document discusses concepts and examples related to derivatives and critical points. It provides examples of finding critical points by setting the derivative equal to zero and evaluating the original function at those points. It also discusses identifying maximum and minimum values. Some key examples include finding critical points of functions like f(x)=2x+3 and g(x)=-2x/(1+x^2), and evaluating those functions at the critical points to determine the maximum and minimum values.
The document summarizes key concepts from a chapter on vectors and geometry in 3D space. [1] It introduces three-dimensional coordinate systems using ordered triples (x,y,z) and defines the distance formula between two points in 3D space. [2] It also defines concepts like the sphere equation and vectors, including their representation, magnitude, addition/subtraction, and dot and cross products. [3] It concludes by covering lines, planes, and their equations, as well as cylindrical coordinates.
This document contains the marking scheme for the Additional Mathematics trial SPM 2009 paper 1. It provides the full workings and marks for each question. The key points assessed include algebraic manipulation, logarithmic and trigonometric functions, vectors, and statistics such as variance. In total there are 22 questions on topics commonly found in Additional Mathematics exams.
This document provides steps to graph functions of the form y = ax^2 + bx + c. It works through an example problem, graphing y = 2x^2 - 8x + 6. The steps are to: 1) identify the coefficients a, b, and c, 2) find the vertex by calculating x from b/2a and the corresponding y-value, 3) draw the axis of symmetry at x, 4) plot other points and 5) draw the parabola through the points. It then provides guided practice problems for students to practice graphing quadratic functions using the same steps.
The document discusses using functions to find output values from input values. It provides examples of functions in the form of y=fx(x) and has students complete function tables and plot points for various functions. It discusses how the Rube Goldberg cartoon from the beginning uses an input, output, and rule to demonstrate a function.
The document describes the Jacobi iterative method for solving systems of linear equations. It begins with an initial estimate for the solution variables, inserts them into the equations to get updated estimates, and repeats this process iteratively until the estimates converge to the desired solution. As an example, it applies the method to a set of 3 equations in 3 unknowns, showing the estimates after each iteration getting progressively closer to the exact solution obtained using Gaussian elimination. A Fortran program implementing the Jacobi method is also presented.
The document contains a regression analysis of house prices using four predictor variables. It includes:
1) The regression equation estimating house prices from the predictor variables.
2) Statistical tests showing three of the four predictor variables are significant while one is not.
3) Analysis of variance tables and calculations showing the regression model is significant overall.
4) Comparison of three regression models, finding the second model is superior to the first but the third is not an improvement on the second.
5) Using the second model to estimate the price of a detached house with specific characteristics.
The second section analyzes the relationship between advertising expenditure and sales, finding a curvilinear relationship and estimating sales for
1. This document contains 11 multi-part math problems involving systems of equations and inequalities. The problems cover topics such as solving systems graphically, algebraically, and determining if ordered pairs are solutions. They also involve word problems about ages, expenses, and splitting amounts into parts.
2. Key steps addressed include setting up tables of values, identifying line types, finding the solution set intersection, using substitution or elimination methods, stating yes or no for ordered pairs, and drawing graphs of solution sets for systems of inequalities.
3. The problems progress from simpler systems to more complex ones involving multiple equations or inequalities, requiring skills like algebraic manipulation, graphical analysis, and translating word problems into mathematical systems.
1. The solution to the system of equations y=2x and x/5 is (0,0).
2. The solutions to the systems of equations x+y=5 and 3x+2y-14=0 are (3,2) and the solutions to x=3 and y=6.5 are (3,6.5).
3. The system of equations representing spending $164 on books costing $15 each or $17 each can be expressed as a system of first degree equations in two variables.
1) The document discusses solving systems of equations and inequalities. It contains 13 problems involving setting up, graphing and solving systems of linear and nonlinear equations and inequalities.
2) The problems cover a range of techniques for solving systems, including substitution, elimination, graphing, and applying constraints to identify variable values that satisfy simultaneous relationships.
3) The document provides practice with setting up and solving different types of systems, as well as interpreting solutions in the context of word problems about rates, prices, ages and coin values.
The document contains 14 problems involving systems of equations and inequalities. Problem 1 asks for the solution of a system of equations as an ordered pair. Problem 2 asks to determine the solution set of another system of equations. Problem 3 asks to express a word problem as a system of two equations.
This document contains 11 problems involving quadratic functions and equations. The problems cover graphing quadratic functions, solving quadratic equations by factoring and using the quadratic formula, identifying properties of quadratic functions, modeling real-world word problems with quadratic equations, and applying the Pythagorean theorem and properties of parabolas.
This document provides 10 problems involving quadratic functions and equations: (1) graphing quadratic equations; (2) solving quadratic equations by factoring; (3) identifying true statements about quadratic equations; (4) solving quadratic equations using the quadratic formula; (5) writing an equation to model profit from bracelet sales; (6) writing an equation for the sum of squares of two consecutive even numbers; (7) analyzing a graph of a quadratic function; (8) solving for measurements of a rhombus given information about its diagonals and area; (9) solving for the number of students in a classroom given information about class time and changes in time per student; (10) solving application problems involving the height
This document contains:
1) A key for a quadratic functions test with graphing and solving problems.
2) The test asks students to graph and solve quadratic equations, identify true statements about discriminants and solutions, and solve word problems involving quadratic models.
3) The key provides the full worked out solutions and answers to all problems on the test.
This document contains 10 word problems involving quadratic functions. Each problem provides relationships between two or more numbers and asks the reader to determine the specific values of those numbers based on the given information. The problems cover a variety of quadratic equation scenarios including differences, sums, products, and consecutive numbers.
The document provides 10 examples of word problems involving quadratic equations. For each problem it defines the variables, sets up the quadratic equation, solves for the zeros, and states the answer.
This document contains 11 problems involving quadratic functions and equations. The problems cover graphing quadratic functions, solving quadratic equations by factoring and using the quadratic formula, identifying properties of quadratic functions, modeling real-world word problems with quadratic equations, and applying the Pythagorean theorem and properties of parabolas.
This document provides 10 problems involving quadratic functions and equations: (1) graphing quadratic equations; (2) solving quadratic equations by factoring; (3) identifying true statements about quadratic equations; (4) solving quadratic equations using the quadratic formula; (5) writing an equation to model profit from bracelet sales; (6) writing an equation for the sum of squares of two consecutive even numbers; (7) analyzing a graph of a quadratic function; (8) finding measurements of diagonals of a rhombus using its area; (9) determining the number of students in a classroom using time per student; (10) analyzing the height of a hot air balloon over time.
This document contains 10 problems related to quadratic functions and equations. The problems cover topics such as: 1) graphing quadratic functions, 2) solving quadratic equations by factoring and using the quadratic formula, 3) identifying properties of quadratic functions from their graphs or equations, and 4) modeling real-world situations using quadratic equations. The goal is to demonstrate understanding of key concepts for quadratic functions and practice applying various techniques for solving quadratic equations.
Unlocking Productivity: Leveraging the Potential of Copilot in Microsoft 365, a presentation by Christoforos Vlachos, Senior Solutions Manager – Modern Workplace, Uni Systems
Goodbye Windows 11: Make Way for Nitrux Linux 3.5.0!SOFTTECHHUB
As the digital landscape continually evolves, operating systems play a critical role in shaping user experiences and productivity. The launch of Nitrux Linux 3.5.0 marks a significant milestone, offering a robust alternative to traditional systems such as Windows 11. This article delves into the essence of Nitrux Linux 3.5.0, exploring its unique features, advantages, and how it stands as a compelling choice for both casual users and tech enthusiasts.
Why You Should Replace Windows 11 with Nitrux Linux 3.5.0 for enhanced perfor...SOFTTECHHUB
The choice of an operating system plays a pivotal role in shaping our computing experience. For decades, Microsoft's Windows has dominated the market, offering a familiar and widely adopted platform for personal and professional use. However, as technological advancements continue to push the boundaries of innovation, alternative operating systems have emerged, challenging the status quo and offering users a fresh perspective on computing.
One such alternative that has garnered significant attention and acclaim is Nitrux Linux 3.5.0, a sleek, powerful, and user-friendly Linux distribution that promises to redefine the way we interact with our devices. With its focus on performance, security, and customization, Nitrux Linux presents a compelling case for those seeking to break free from the constraints of proprietary software and embrace the freedom and flexibility of open-source computing.
“An Outlook of the Ongoing and Future Relationship between Blockchain Technologies and Process-aware Information Systems.” Invited talk at the joint workshop on Blockchain for Information Systems (BC4IS) and Blockchain for Trusted Data Sharing (B4TDS), co-located with with the 36th International Conference on Advanced Information Systems Engineering (CAiSE), 3 June 2024, Limassol, Cyprus.
Programming Foundation Models with DSPy - Meetup SlidesZilliz
Prompting language models is hard, while programming language models is easy. In this talk, I will discuss the state-of-the-art framework DSPy for programming foundation models with its powerful optimizers and runtime constraint system.
Let's Integrate MuleSoft RPA, COMPOSER, APM with AWS IDP along with Slackshyamraj55
Discover the seamless integration of RPA (Robotic Process Automation), COMPOSER, and APM with AWS IDP enhanced with Slack notifications. Explore how these technologies converge to streamline workflows, optimize performance, and ensure secure access, all while leveraging the power of AWS IDP and real-time communication via Slack notifications.
Essentials of Automations: The Art of Triggers and Actions in FMESafe Software
In this second installment of our Essentials of Automations webinar series, we’ll explore the landscape of triggers and actions, guiding you through the nuances of authoring and adapting workspaces for seamless automations. Gain an understanding of the full spectrum of triggers and actions available in FME, empowering you to enhance your workspaces for efficient automation.
We’ll kick things off by showcasing the most commonly used event-based triggers, introducing you to various automation workflows like manual triggers, schedules, directory watchers, and more. Plus, see how these elements play out in real scenarios.
Whether you’re tweaking your current setup or building from the ground up, this session will arm you with the tools and insights needed to transform your FME usage into a powerhouse of productivity. Join us to discover effective strategies that simplify complex processes, enhancing your productivity and transforming your data management practices with FME. Let’s turn complexity into clarity and make your workspaces work wonders!
HCL Notes and Domino License Cost Reduction in the World of DLAUpanagenda
Webinar Recording: https://www.panagenda.com/webinars/hcl-notes-and-domino-license-cost-reduction-in-the-world-of-dlau/
The introduction of DLAU and the CCB & CCX licensing model caused quite a stir in the HCL community. As a Notes and Domino customer, you may have faced challenges with unexpected user counts and license costs. You probably have questions on how this new licensing approach works and how to benefit from it. Most importantly, you likely have budget constraints and want to save money where possible. Don’t worry, we can help with all of this!
We’ll show you how to fix common misconfigurations that cause higher-than-expected user counts, and how to identify accounts which you can deactivate to save money. There are also frequent patterns that can cause unnecessary cost, like using a person document instead of a mail-in for shared mailboxes. We’ll provide examples and solutions for those as well. And naturally we’ll explain the new licensing model.
Join HCL Ambassador Marc Thomas in this webinar with a special guest appearance from Franz Walder. It will give you the tools and know-how to stay on top of what is going on with Domino licensing. You will be able lower your cost through an optimized configuration and keep it low going forward.
These topics will be covered
- Reducing license cost by finding and fixing misconfigurations and superfluous accounts
- How do CCB and CCX licenses really work?
- Understanding the DLAU tool and how to best utilize it
- Tips for common problem areas, like team mailboxes, functional/test users, etc
- Practical examples and best practices to implement right away
Full-RAG: A modern architecture for hyper-personalizationZilliz
Mike Del Balso, CEO & Co-Founder at Tecton, presents "Full RAG," a novel approach to AI recommendation systems, aiming to push beyond the limitations of traditional models through a deep integration of contextual insights and real-time data, leveraging the Retrieval-Augmented Generation architecture. This talk will outline Full RAG's potential to significantly enhance personalization, address engineering challenges such as data management and model training, and introduce data enrichment with reranking as a key solution. Attendees will gain crucial insights into the importance of hyperpersonalization in AI, the capabilities of Full RAG for advanced personalization, and strategies for managing complex data integrations for deploying cutting-edge AI solutions.
Pushing the limits of ePRTC: 100ns holdover for 100 daysAdtran
At WSTS 2024, Alon Stern explored the topic of parametric holdover and explained how recent research findings can be implemented in real-world PNT networks to achieve 100 nanoseconds of accuracy for up to 100 days.
GraphSummit Singapore | The Future of Agility: Supercharging Digital Transfor...Neo4j
Leonard Jayamohan, Partner & Generative AI Lead, Deloitte
This keynote will reveal how Deloitte leverages Neo4j’s graph power for groundbreaking digital twin solutions, achieving a staggering 100x performance boost. Discover the essential role knowledge graphs play in successful generative AI implementations. Plus, get an exclusive look at an innovative Neo4j + Generative AI solution Deloitte is developing in-house.
Maruthi Prithivirajan, Head of ASEAN & IN Solution Architecture, Neo4j
Get an inside look at the latest Neo4j innovations that enable relationship-driven intelligence at scale. Learn more about the newest cloud integrations and product enhancements that make Neo4j an essential choice for developers building apps with interconnected data and generative AI.
UiPath Test Automation using UiPath Test Suite series, part 5DianaGray10
Welcome to UiPath Test Automation using UiPath Test Suite series part 5. In this session, we will cover CI/CD with devops.
Topics covered:
CI/CD with in UiPath
End-to-end overview of CI/CD pipeline with Azure devops
Speaker:
Lyndsey Byblow, Test Suite Sales Engineer @ UiPath, Inc.
TrustArc Webinar - 2024 Global Privacy SurveyTrustArc
How does your privacy program stack up against your peers? What challenges are privacy teams tackling and prioritizing in 2024?
In the fifth annual Global Privacy Benchmarks Survey, we asked over 1,800 global privacy professionals and business executives to share their perspectives on the current state of privacy inside and outside of their organizations. This year’s report focused on emerging areas of importance for privacy and compliance professionals, including considerations and implications of Artificial Intelligence (AI) technologies, building brand trust, and different approaches for achieving higher privacy competence scores.
See how organizational priorities and strategic approaches to data security and privacy are evolving around the globe.
This webinar will review:
- The top 10 privacy insights from the fifth annual Global Privacy Benchmarks Survey
- The top challenges for privacy leaders, practitioners, and organizations in 2024
- Key themes to consider in developing and maintaining your privacy program
Removing Uninteresting Bytes in Software FuzzingAftab Hussain
Imagine a world where software fuzzing, the process of mutating bytes in test seeds to uncover hidden and erroneous program behaviors, becomes faster and more effective. A lot depends on the initial seeds, which can significantly dictate the trajectory of a fuzzing campaign, particularly in terms of how long it takes to uncover interesting behaviour in your code. We introduce DIAR, a technique designed to speedup fuzzing campaigns by pinpointing and eliminating those uninteresting bytes in the seeds. Picture this: instead of wasting valuable resources on meaningless mutations in large, bloated seeds, DIAR removes the unnecessary bytes, streamlining the entire process.
In this work, we equipped AFL, a popular fuzzer, with DIAR and examined two critical Linux libraries -- Libxml's xmllint, a tool for parsing xml documents, and Binutil's readelf, an essential debugging and security analysis command-line tool used to display detailed information about ELF (Executable and Linkable Format). Our preliminary results show that AFL+DIAR does not only discover new paths more quickly but also achieves higher coverage overall. This work thus showcases how starting with lean and optimized seeds can lead to faster, more comprehensive fuzzing campaigns -- and DIAR helps you find such seeds.
- These are slides of the talk given at IEEE International Conference on Software Testing Verification and Validation Workshop, ICSTW 2022.
1. MTH-4108 B
Quadratic Functions
ANSWER KEY
1. Graph the following equations. Be sure to include the coordinates of at least 5
points, including the vertex, the zeros (if any), axis of symmetry and the y-
intercept.
a) y = 1/3x2 – 5
y
−b −∆
,
2a 4a
Vertex: 0 − 6.667
,
0.667 1.333
( 0,−5)
−b± ∆
x
2a
Zeros: 0 ± 6.667
1.33
{ − 1.936,1.936}
y = 0.333(0) − 5
y-intercept:
y = −5
b) y = 4/5x2 – 5x + 8.5
y
Vertex:
−b −∆
,
2a 4a
5 − ( 25 − 4( 0.8)( 8.5) )
,
1.6 3.2
( 3.125,0.6875)
x −b± ∆
2a
Zeros: 5 ± − 2.2
1.6
{ ∅}
y-intercept:
y = 0.8(0) − 5(0) + 8.5
y = 8.5
2. Vertex:
c) y = –0.2x2 + x – 3 −b −∆
,
y 2a 4a
− 1 − (1 − 4( − 0.2)( − 3) )
,
− 0.4 − 0.8
( 2.5,−1.75)
−b± ∆
2a
Zeros: − 1 ± − 1.4
x
− 0.4
{ ∅}
y-intercept:
y = −0.2(0) + 1(0) − 3
y = −3
/30
2. Solve the following equations by factoring:
a) 49x2 – 169 = 0 ( 7 x − 13) ⇒ 7 x = 13 ⇒ x = 13 7 = 1.857
( 7 x + 13) ⇒ 7 x = −13 ⇒ x = − 13 7 = −1.857
b) 1/4x2 – 6x + 20 = 0 1 2
x − x − 5 x + 20 = 0
4
1
x( x − 4) − 5( x − 4)
4
1 1
x − 5 ⇒ x = 5 ⇒ x = 20
4 4
( x − 4) ⇒ x = 4 /5
3. Identify the true statement(s) below:
a) If ∆ = 0 for a quadratic equation, it means that there is one solution and it
is equal to 0. FALSE
b) If the discriminant is less than 0, it means that there are two real solutions
for this equation.
FALSE
c) If an equation has two zeros, one postitive and one negative, it means that ∆ is
negative.
FALSE
d) If an equation has one negative solution, it is impossible that the other
solution is also negative if ∆ > 0. FALSE
e) If the discriminant is equal to zero then the equation has two solutions.
FALSE
/5
3. 4. Solve the following equations using the quadratic formula. Clearly indicate the
value of ∆ and round your answers to the nearest thousandth when necessary.
a) 3.6x2 + 3.1x – 1 = 0 Zeros:
−b± ∆
2a
− 3.1 ± ( 9.61 − 4( 3.6 )( − 1) )
7.2
{ − 1.111,0.25}
b) -1x2 + 5x – 24 = 0
Zeros:
6
−b± ∆
2a
− 5 ± ( 25 − 4( − 0.1667 )( − 24 ) )
− 0.333
{ 6,24}
/10
5. Marjorie makes friendship bracelets and sells them for a profit of $4.50. She must
sell at least 10 bracelets to break even. For each additional bracelet she sells, she
can offer the buyer a discount of $0.15. The table below illustrates the her total
profit as a function of how many bracelets she sells.
No. of additional Number of Discount price Total profit
bracelets sold bracelets sold
0 10 4.50 – (0.15 × 0) 10 × 4.50 = 45.00
1 10 + 1 = 11 4.50 – (0.15 × 1) = 4.35 11 × 4.35 = 47.85
2 10 + 2 = 12 4.50 – (0.15 × 2) = 4.20 12 × 4.20 = 50.40
x 10 + x 4.50 – (0.15 × x) (10 + x)(4.5 – 0.15x)
Write the equation in the form ax2 + bx + c which illustrates this situation.
(10 + x )( 4.5 − 0.15 x )
45 + 1.5 x + 4.5 x + 0.15 x 2
y = 0.15 x 2 + 6 x + 45 /10
6. Without calculating, write the equation in the form ax2 + bx + c which illustrates
the following situation:
The sum of the squares of two consecutive even numbers is 1060. What are the
two numbers?
Let x = 1st number
Let x + 1 = 2nd number
x 2 + ( x + 1) = 1060
2
/5
x 2 + x 2 + 2 x + 1 = 1060
2 x 2 + 2 x − 1059 = 0
4. 7. Answer the following questions using the graph below: y = –x2 + 2x + 8
y
x
a) What are the coordinates of the vertex? Vertex:
− b − ∆ − 2 − ( 4 − 4( − 1)( 8) )
, ⇒ , ⇒ (1,9 )
2a 4a − 2 −4
b) What is the equation of the axis of symmetry? x=1
c) Is there a maximum or a minimum?
Maximum of 9
d) What are the zeros?
−b± ∆ − 2 ± 36
Zeros: ⇒ ⇒ { − 2,4}
2a −2
e) What is the y-intercept?
y-intercept: y = −1(0) + 2(0) + 8 ⇒ y = 8
/5
8. The small diagonal of a rhombus measures 2 cm more than one quarter of the
large diagonal. The area of the rhombus is 66.56 cm2. What are the measurements
of the small diagonal and the large diagonal of this rhombus?
Let x = LARGE diagonal
Let ¼x + 2 = small diagonal
−b± ∆
(
x 1 x+2 ) 2a
4
2
= 66.56 −2± 4−4 1 ( 4 )( − 133.12)
1 x 2 + 2 x = 133.12 Zeros: 0.5
4
1 x 2 + 2 x − 133.12 = 0 − 3 ± 137.12
4 0.5
{ − 29.4196,17.4196}
0.25(17.4196) + 2 = 6.3549
ANS: 17.4196 cm and 6.3549 cm /5
5. 9. A school superintendent is deciding on how many students per class there should
be. The classes are 120 minutes long, with a certain number of students in each
room. If 10 students are added to the classes, the time spent per student declines
by 1 minute. How many students are in the room?
Let x = number of students in the classroom
−b± ∆
120 120
−1 = 2a
x x + 10
120 − x 120 − 10 ± 100 − 4(1)( − 1200 )
= Zeros: 2
x x + 10
120 x + 1200 − x 2 − 10 x = 120 x − 10 ± 70
2
x 2 + 10 x − 1200 = 0
{ − 40,30}
ANS: There are 30 students in the classroom.
/10
10. A hot air balloon lifts off the ground from the point (2, 0). The equation of the
height (y) of the balloon in metres is: y = –t2 + 38t – 72 where t represents the time
in minutes.
a) What is the maximum height obtained by the balloon?
Vertex:
− b − ∆ − 38 − (1444 − 4( − 1)( − 72 ) )
, ⇒ , ⇒ (19,289 )
2a 4a − 2 −4
b) After how many seconds is the maximum height obtained?
Vertex:
− b − ∆ − 38 − (1444 − 4( − 1)( − 72 ) )
, ⇒ , ⇒ (19,289 )
2a 4a − 2 −4
c) How many minutes is the balloon in the air?
−b± ∆ − 8.75 ± 1444 − 4( −1)(−72) − 38 ± 1156
⇒ ⇒
Zeros: 2a −2 −2
{ 2,36}
ANS: The balloon is in the air for 34 minutes.
Round your answers to the nearest hundredth.
/15