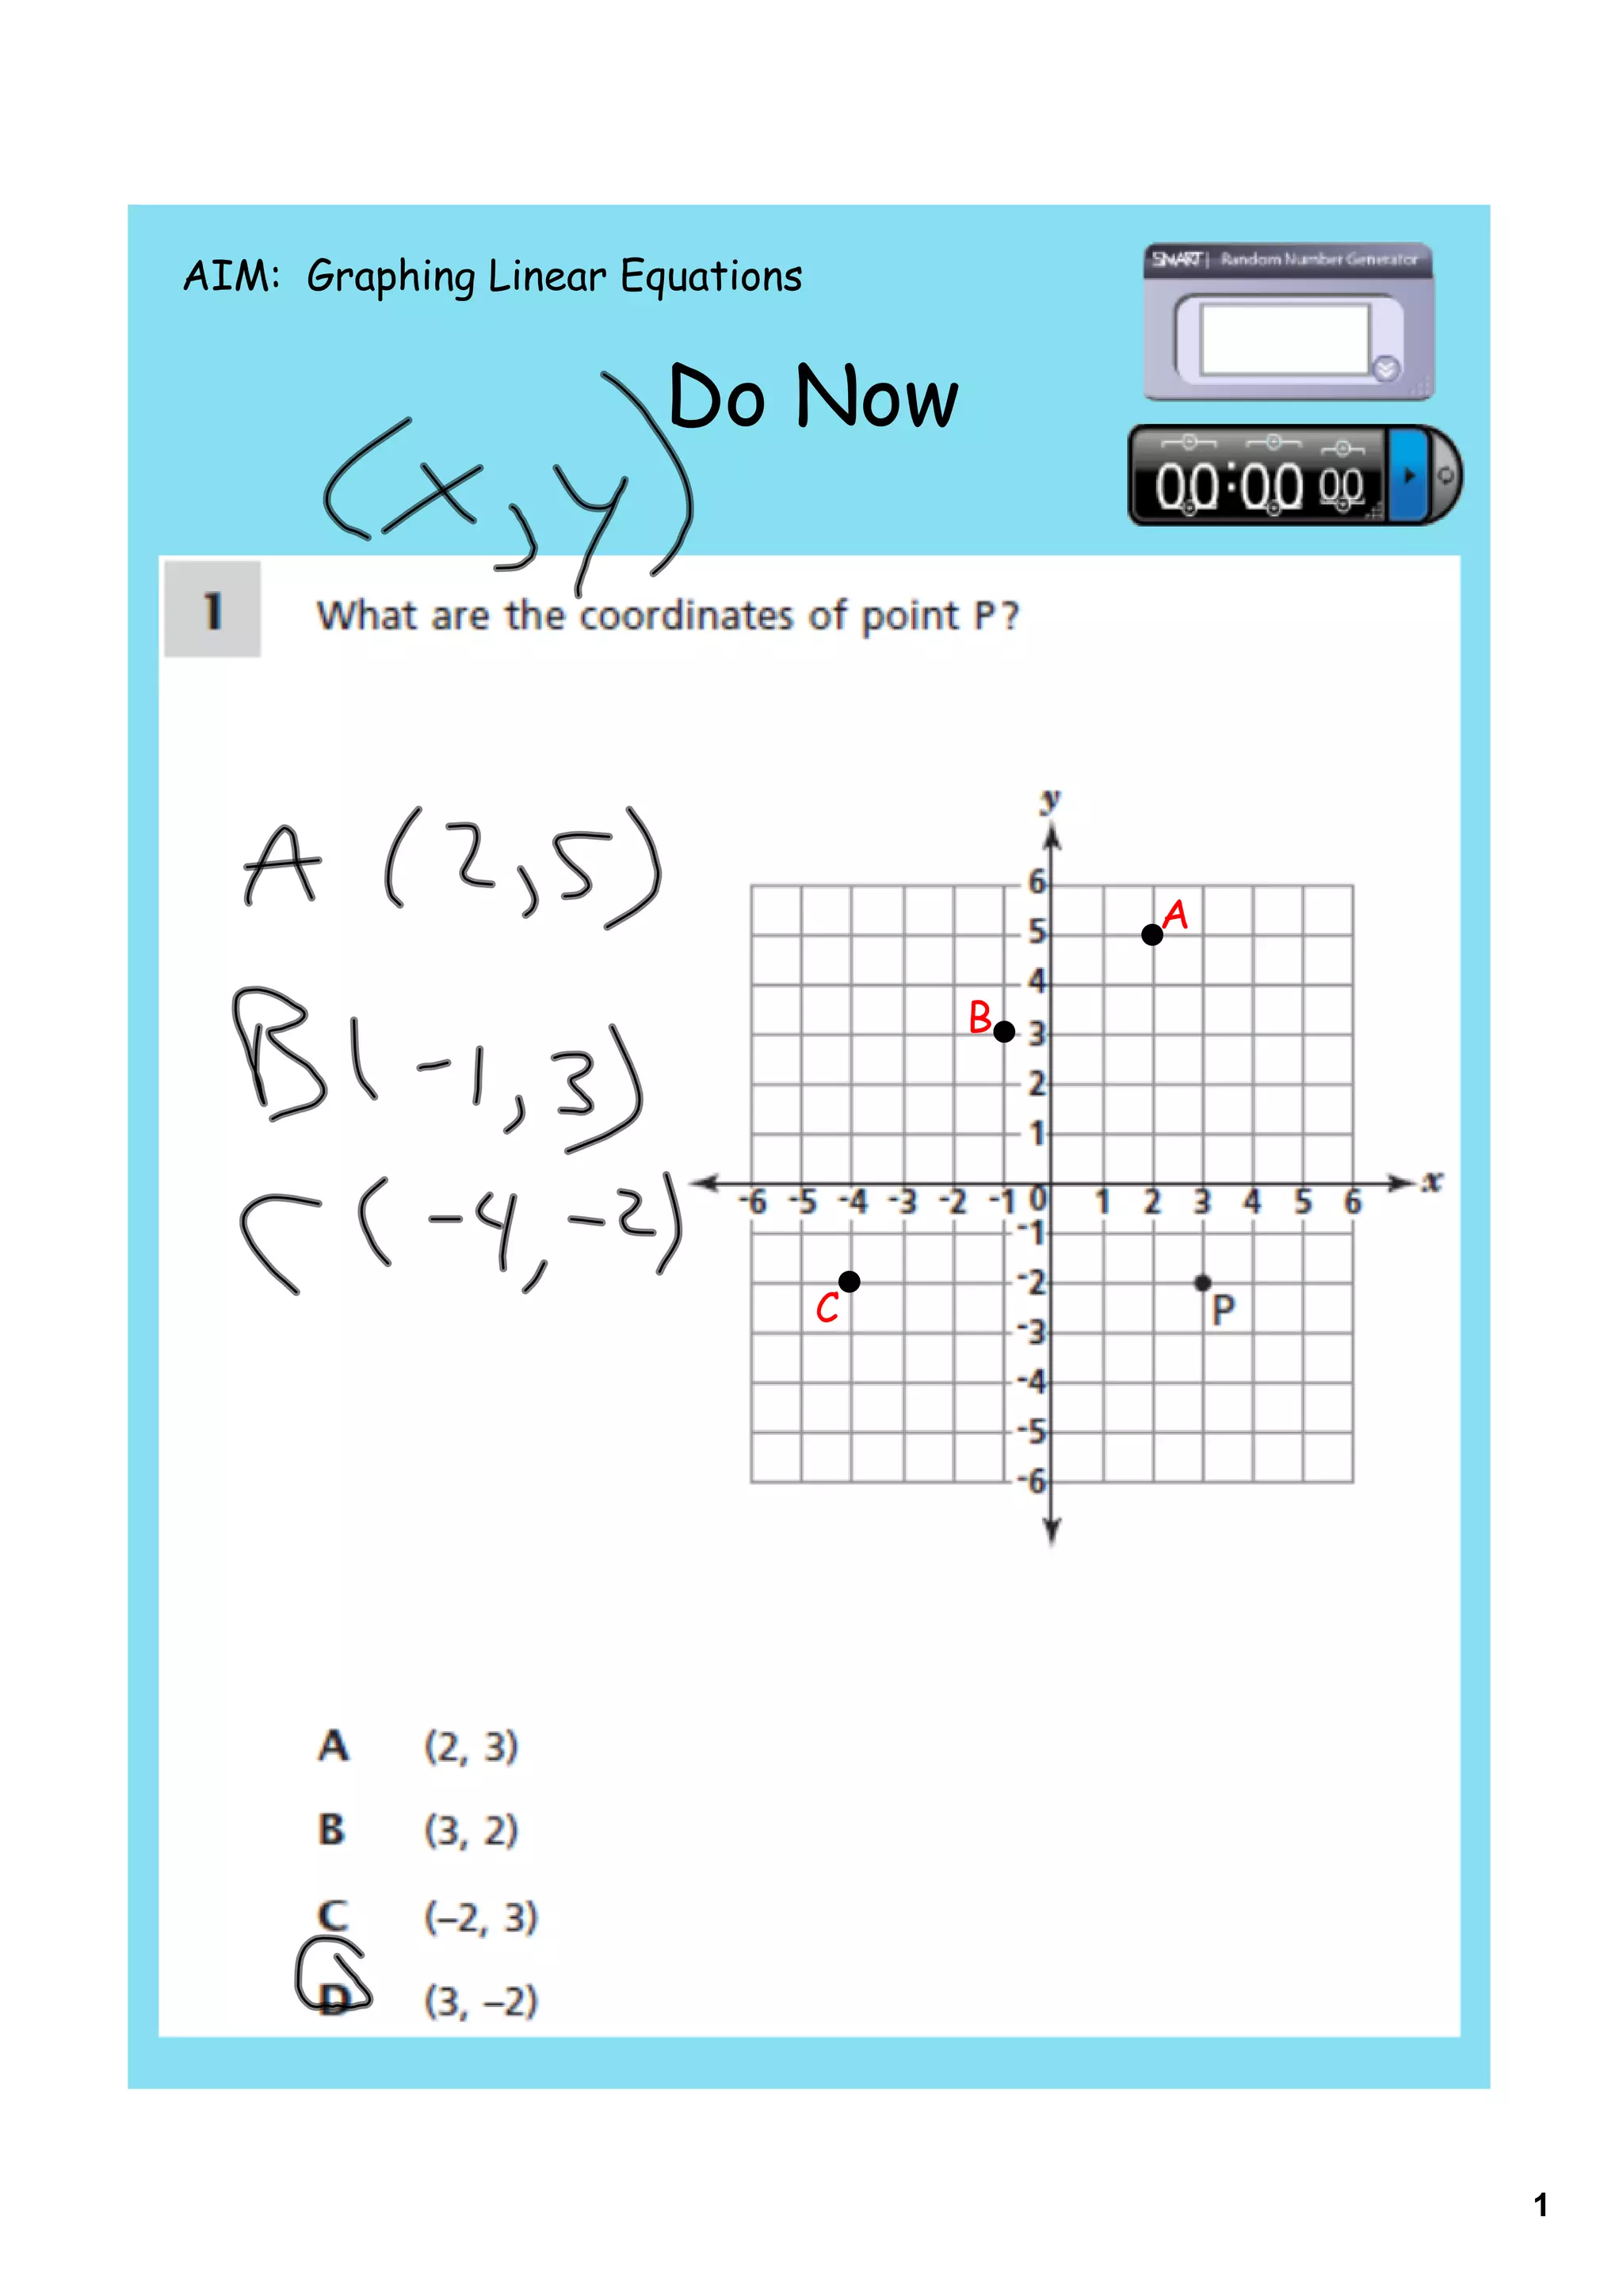
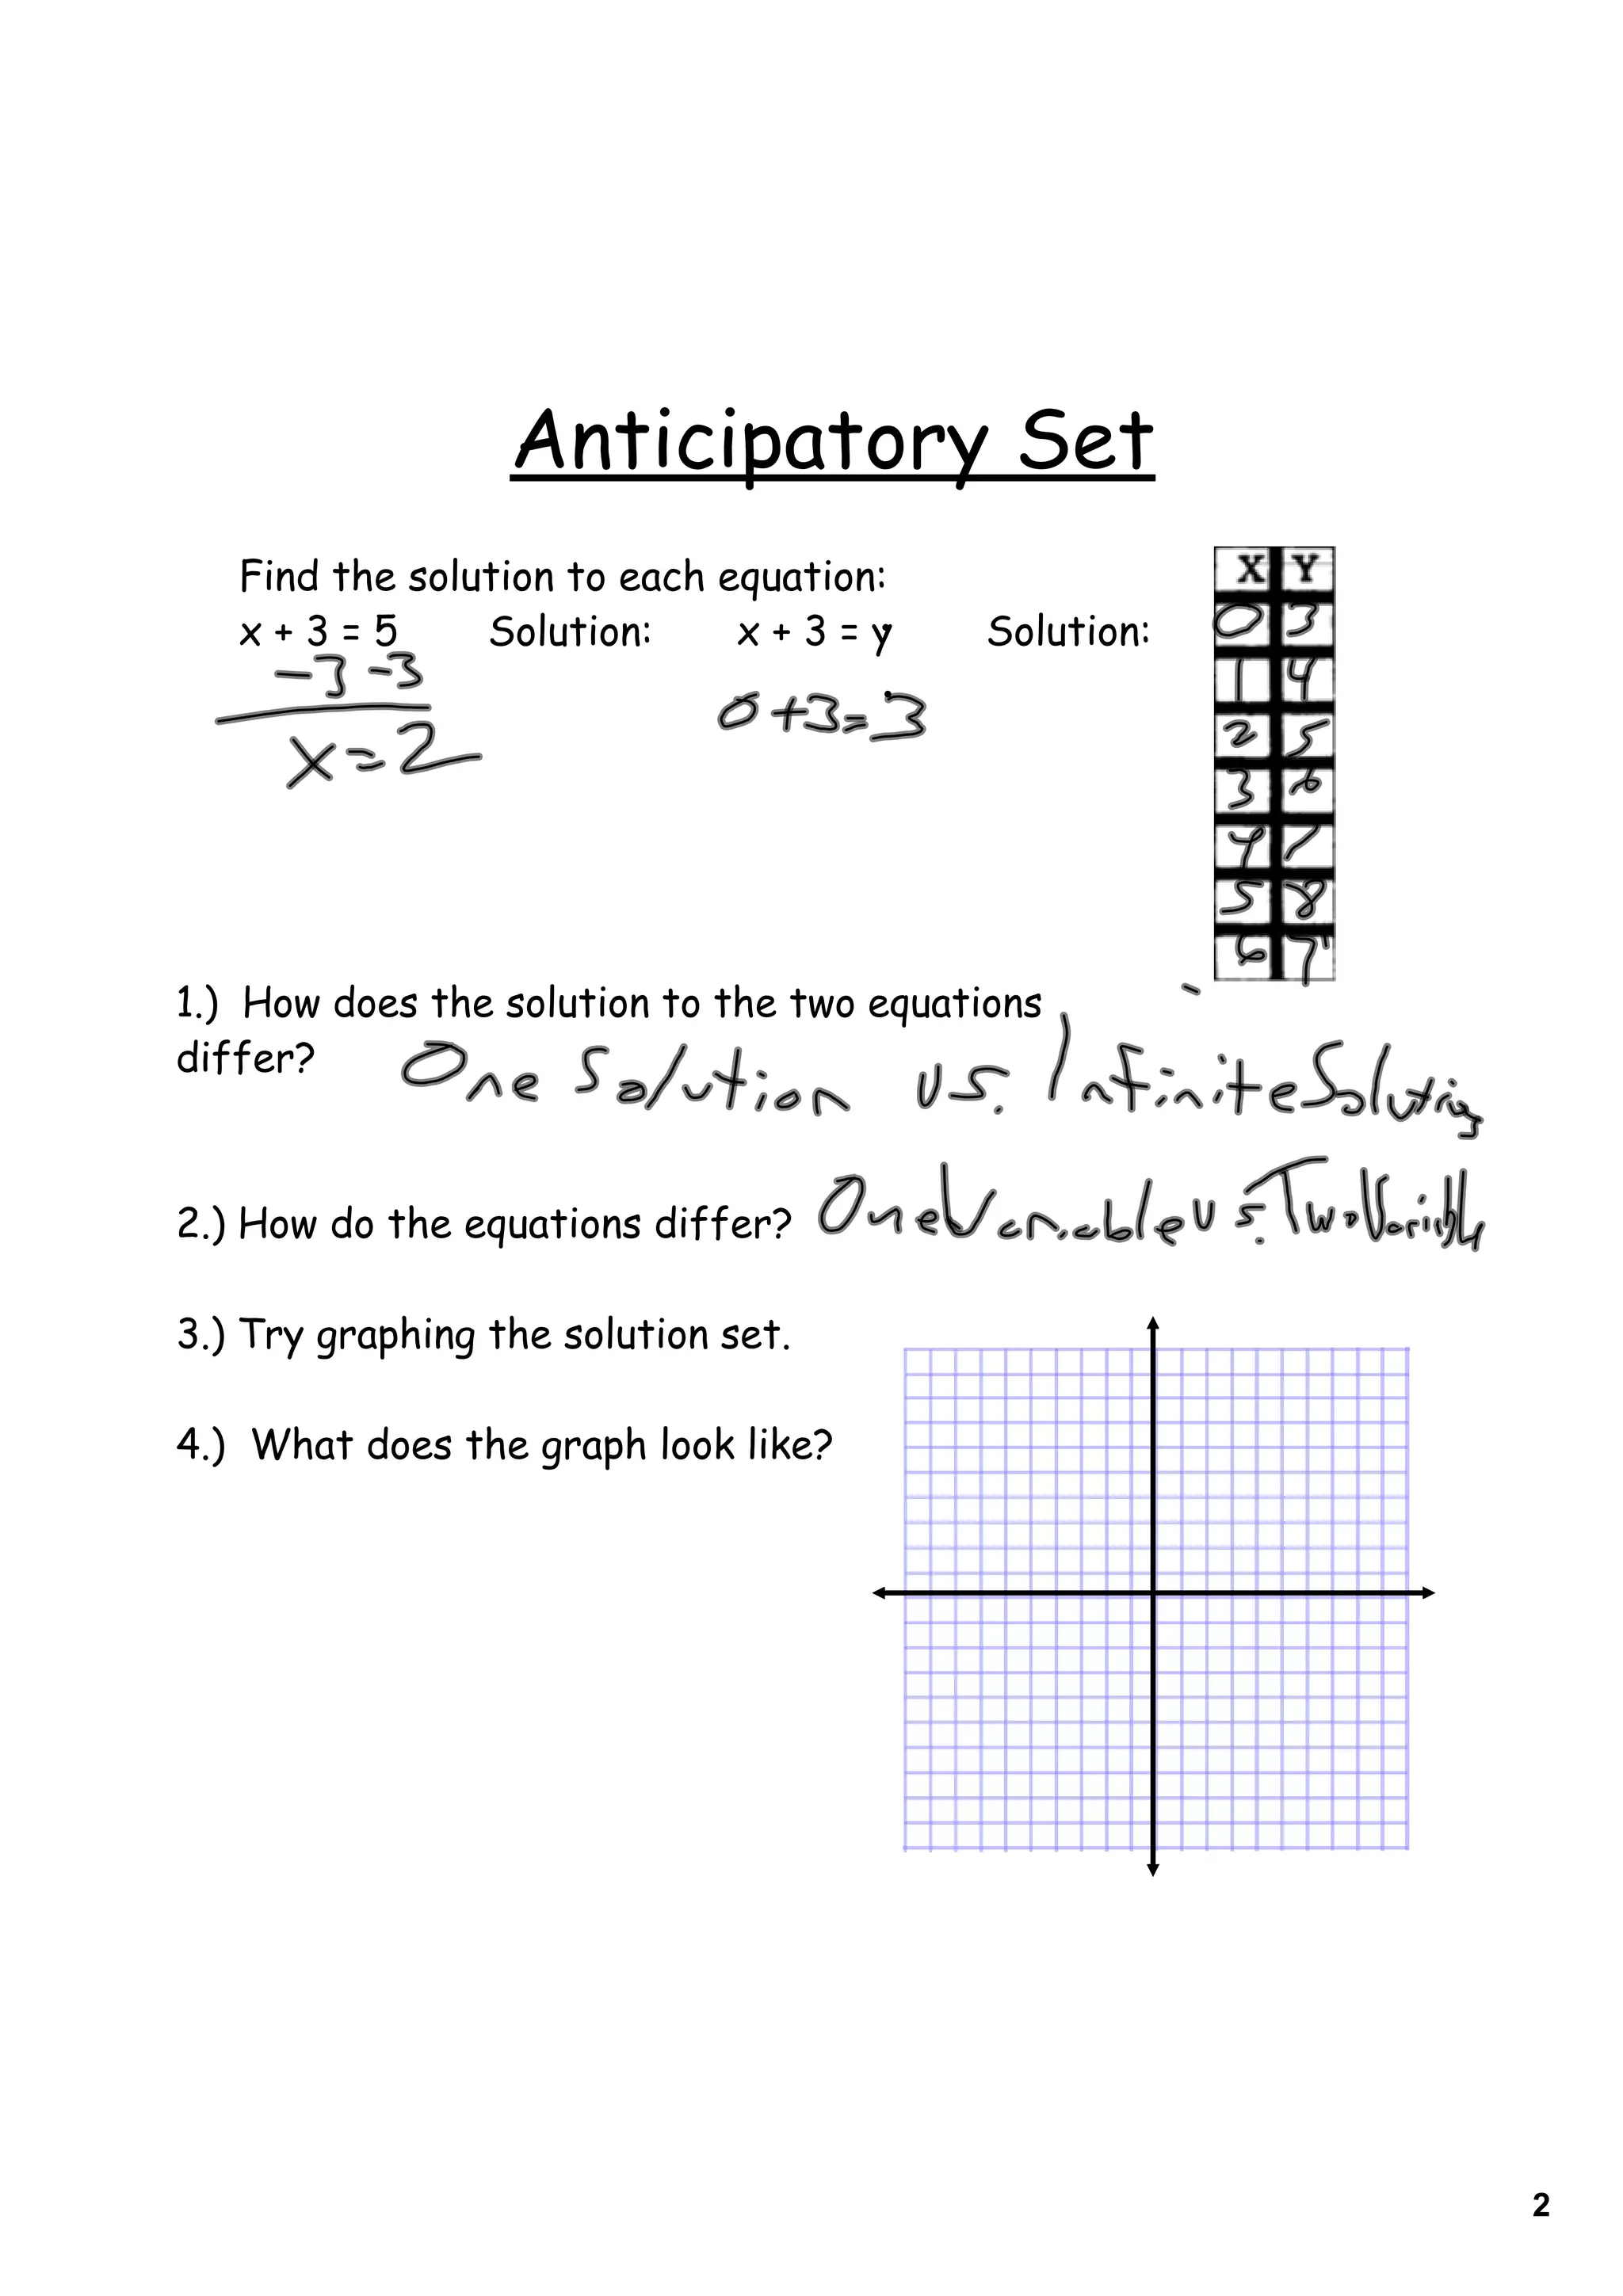
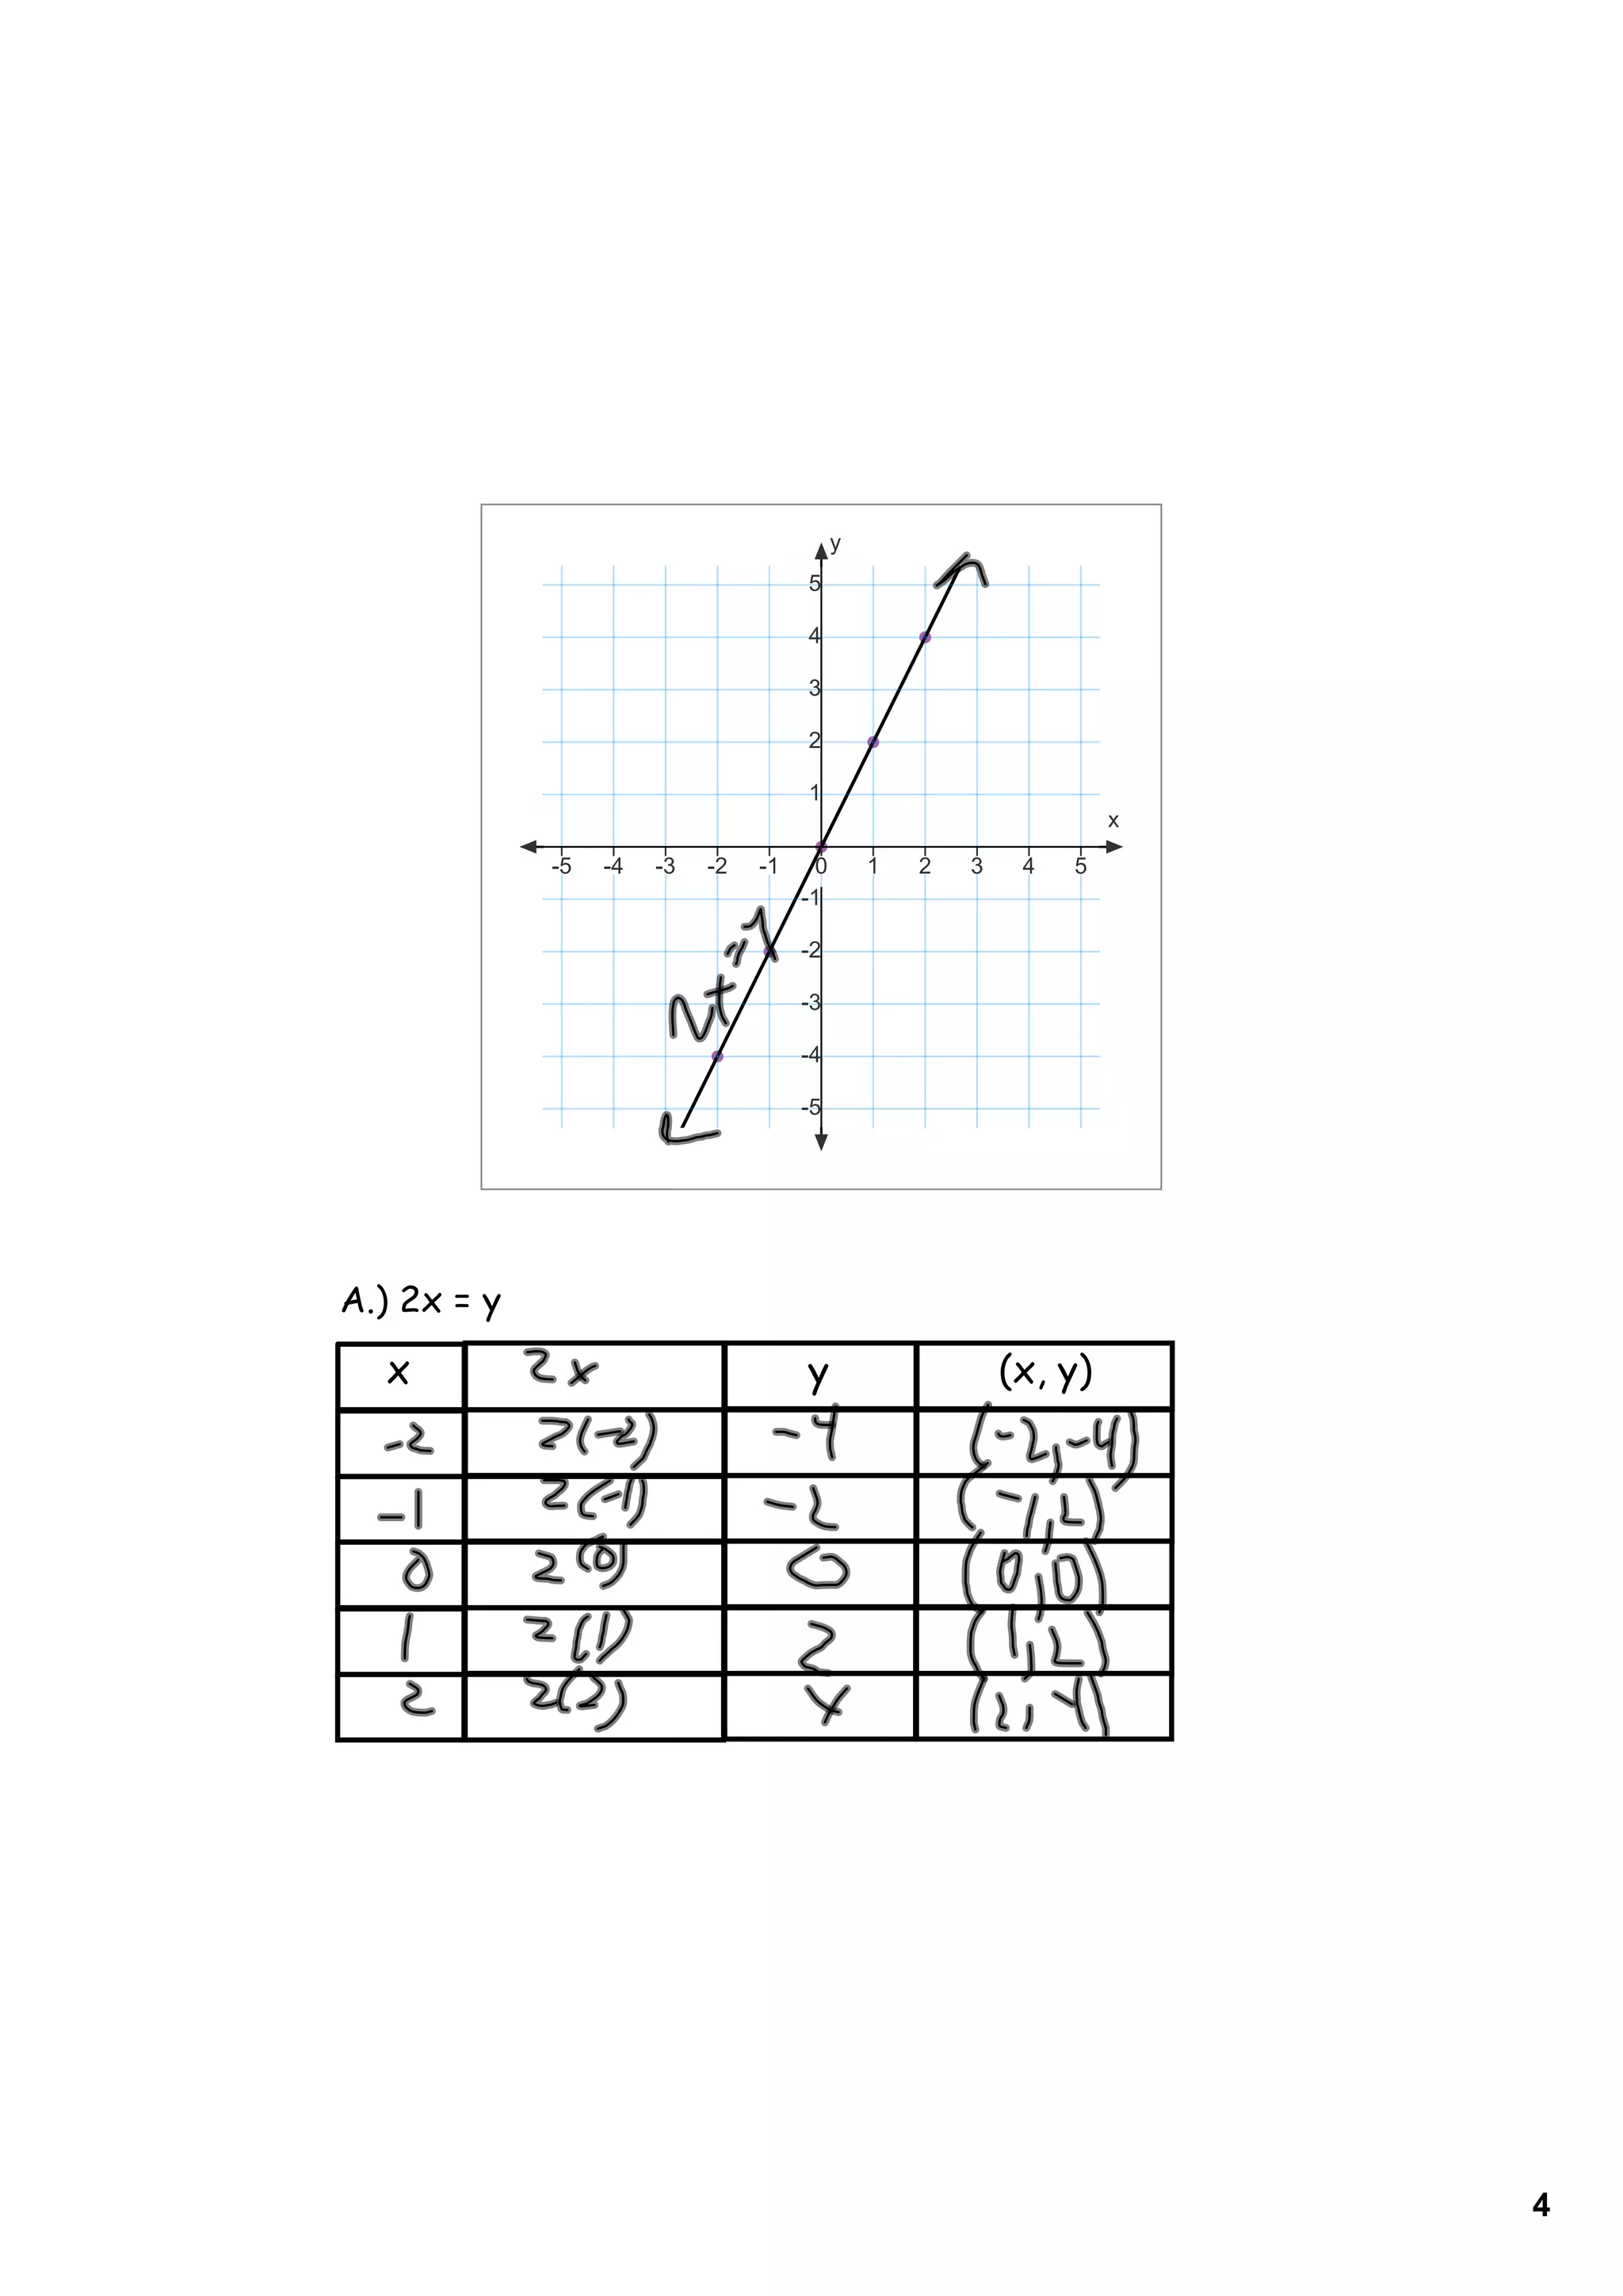
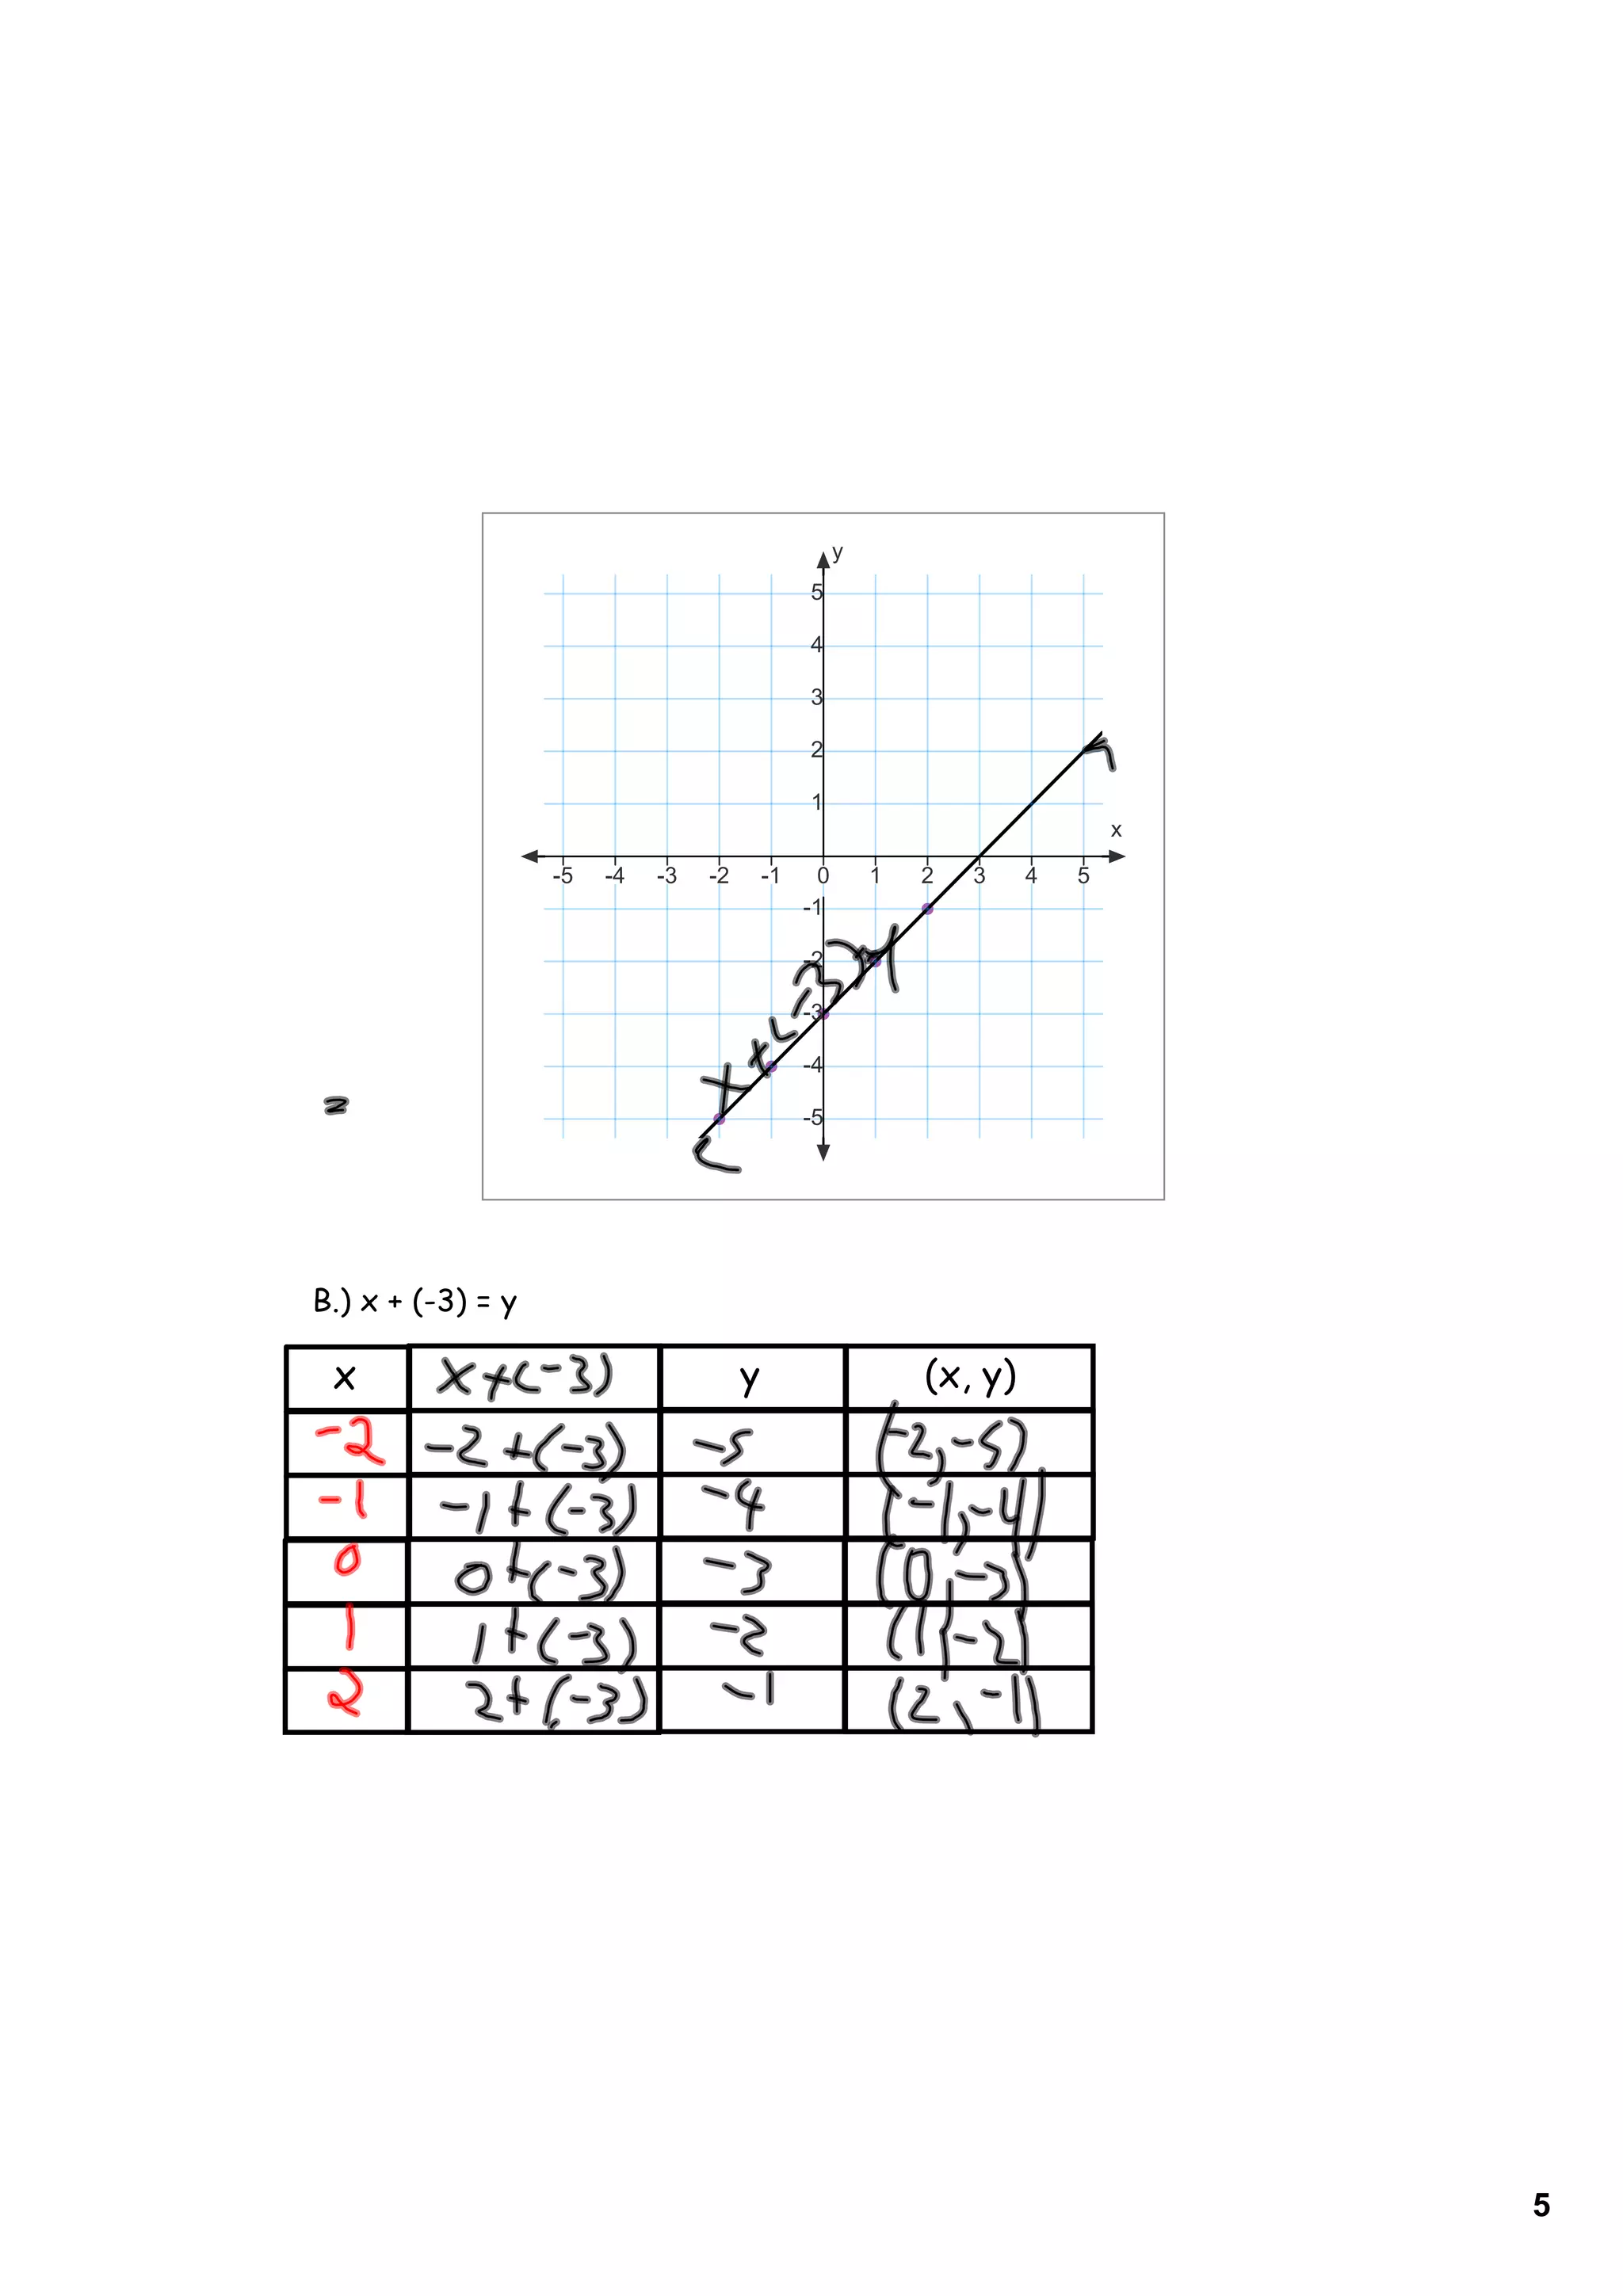
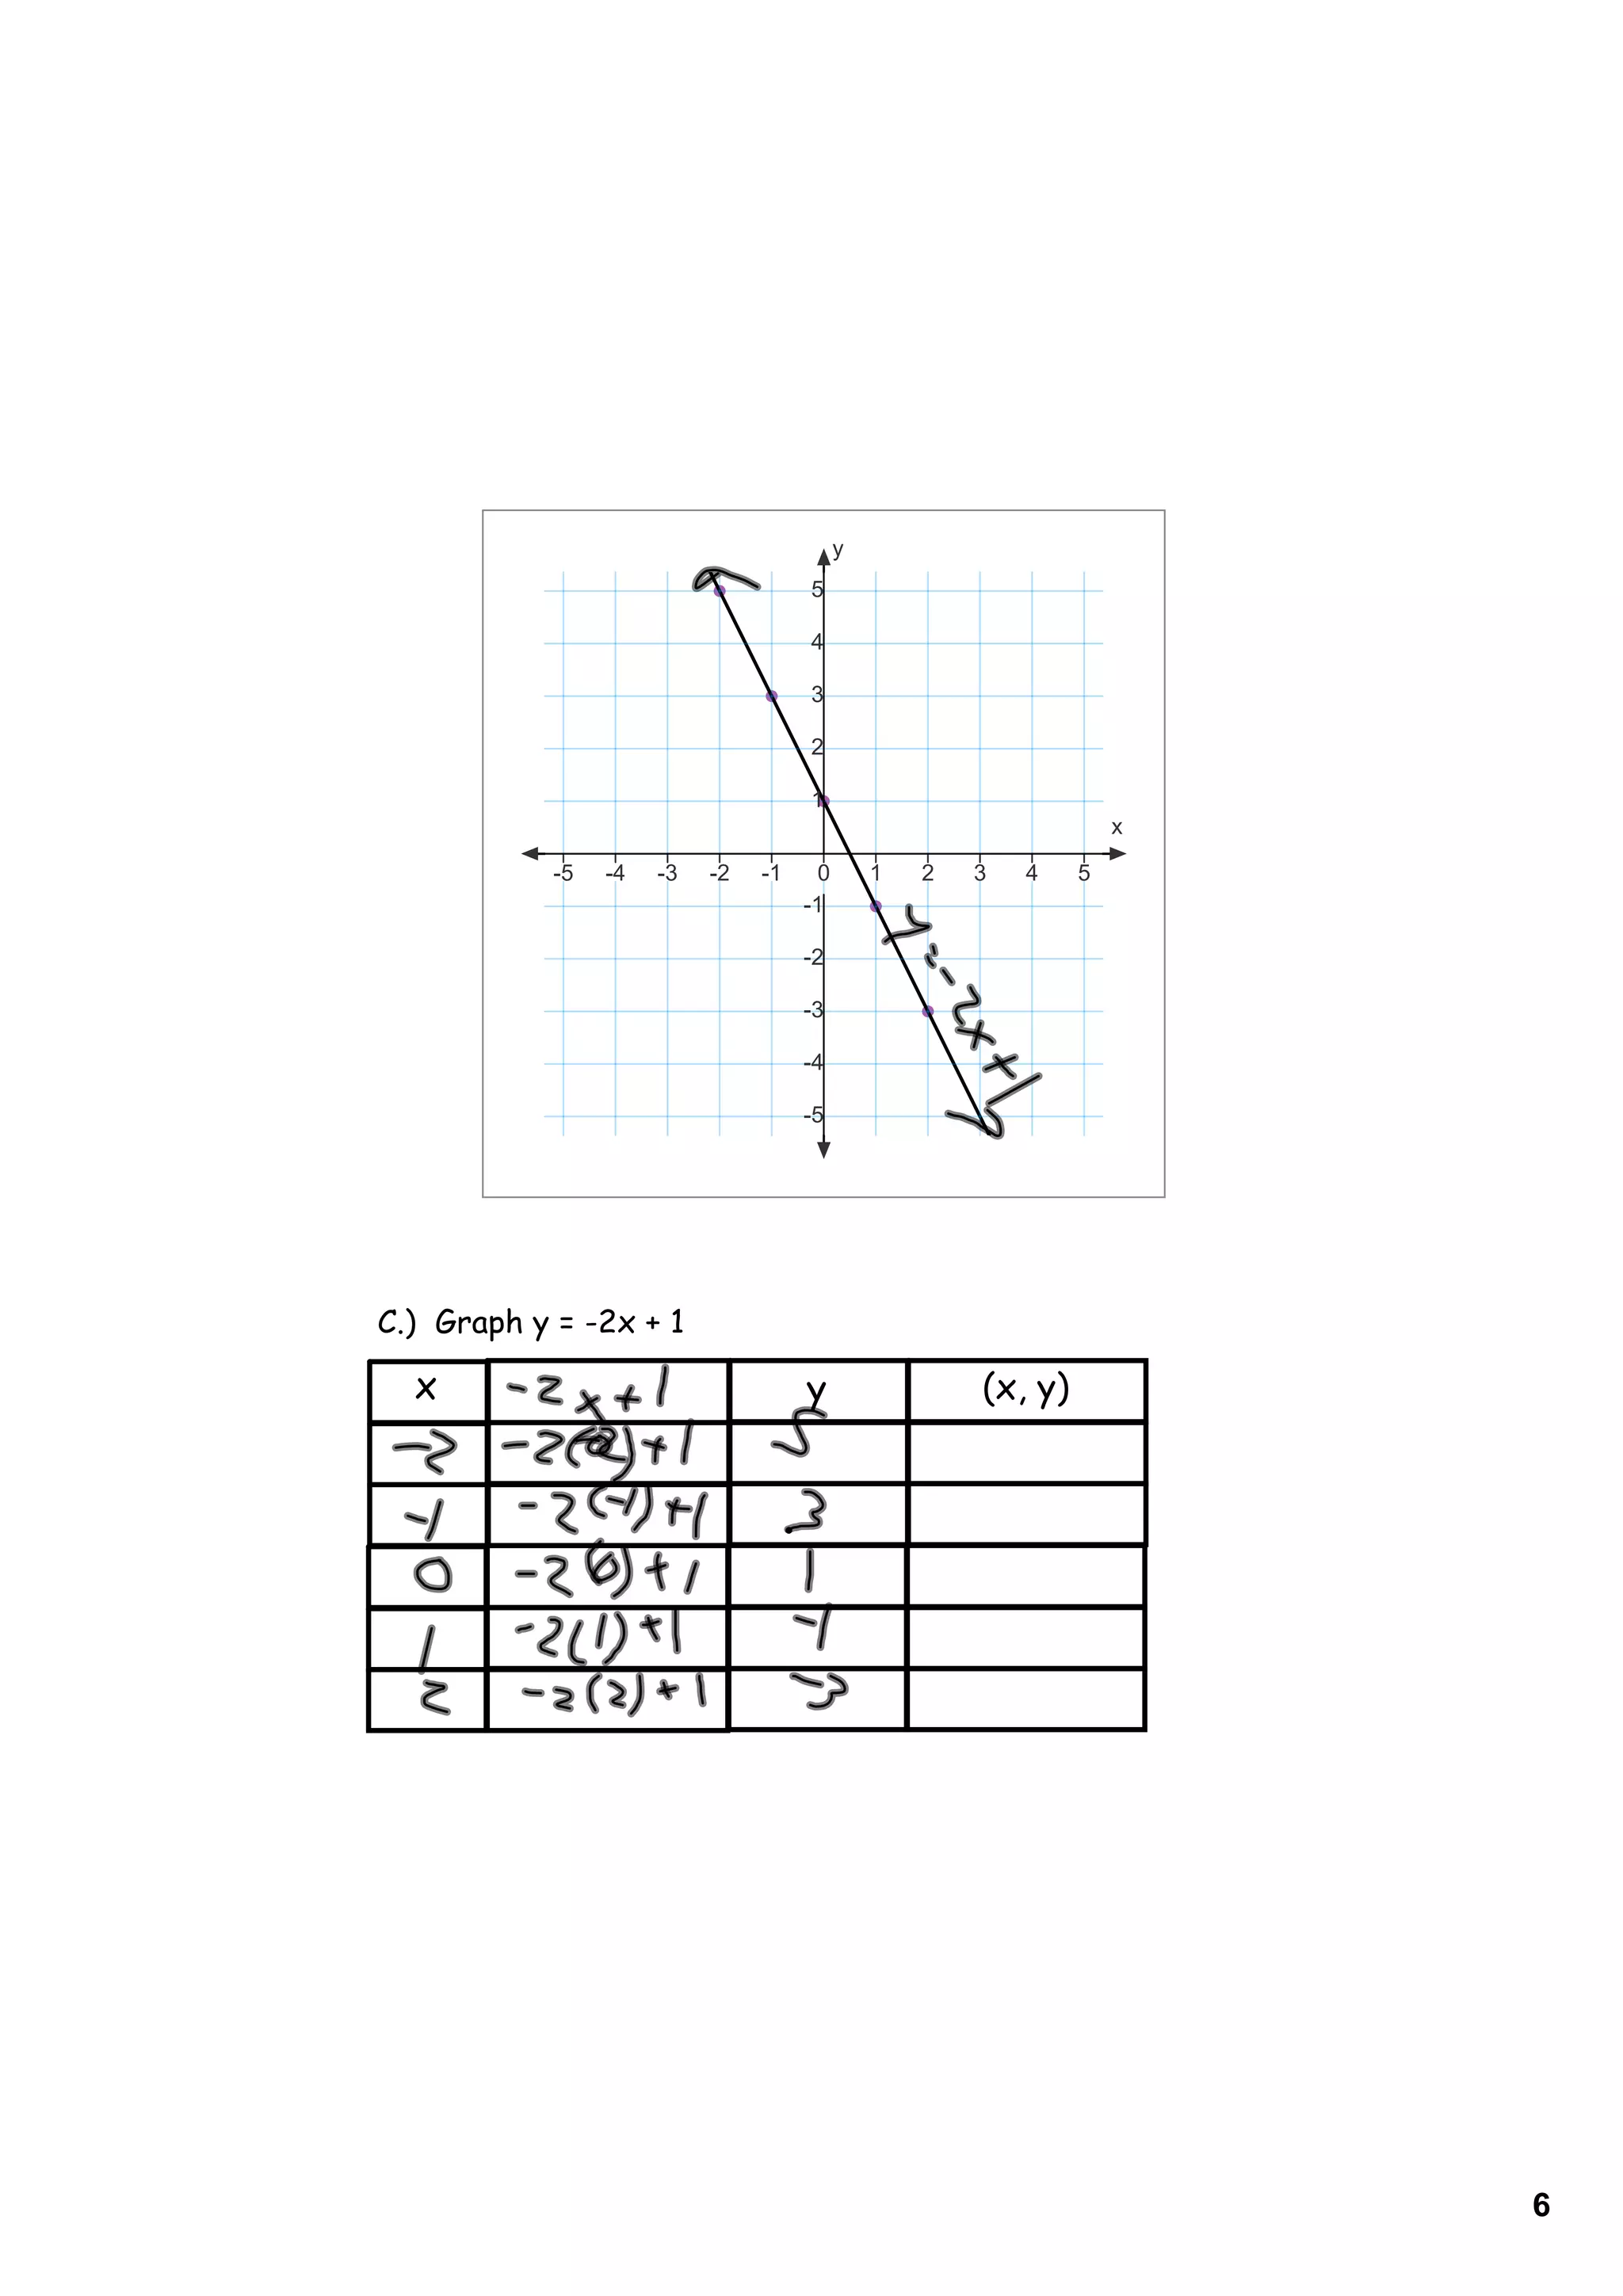
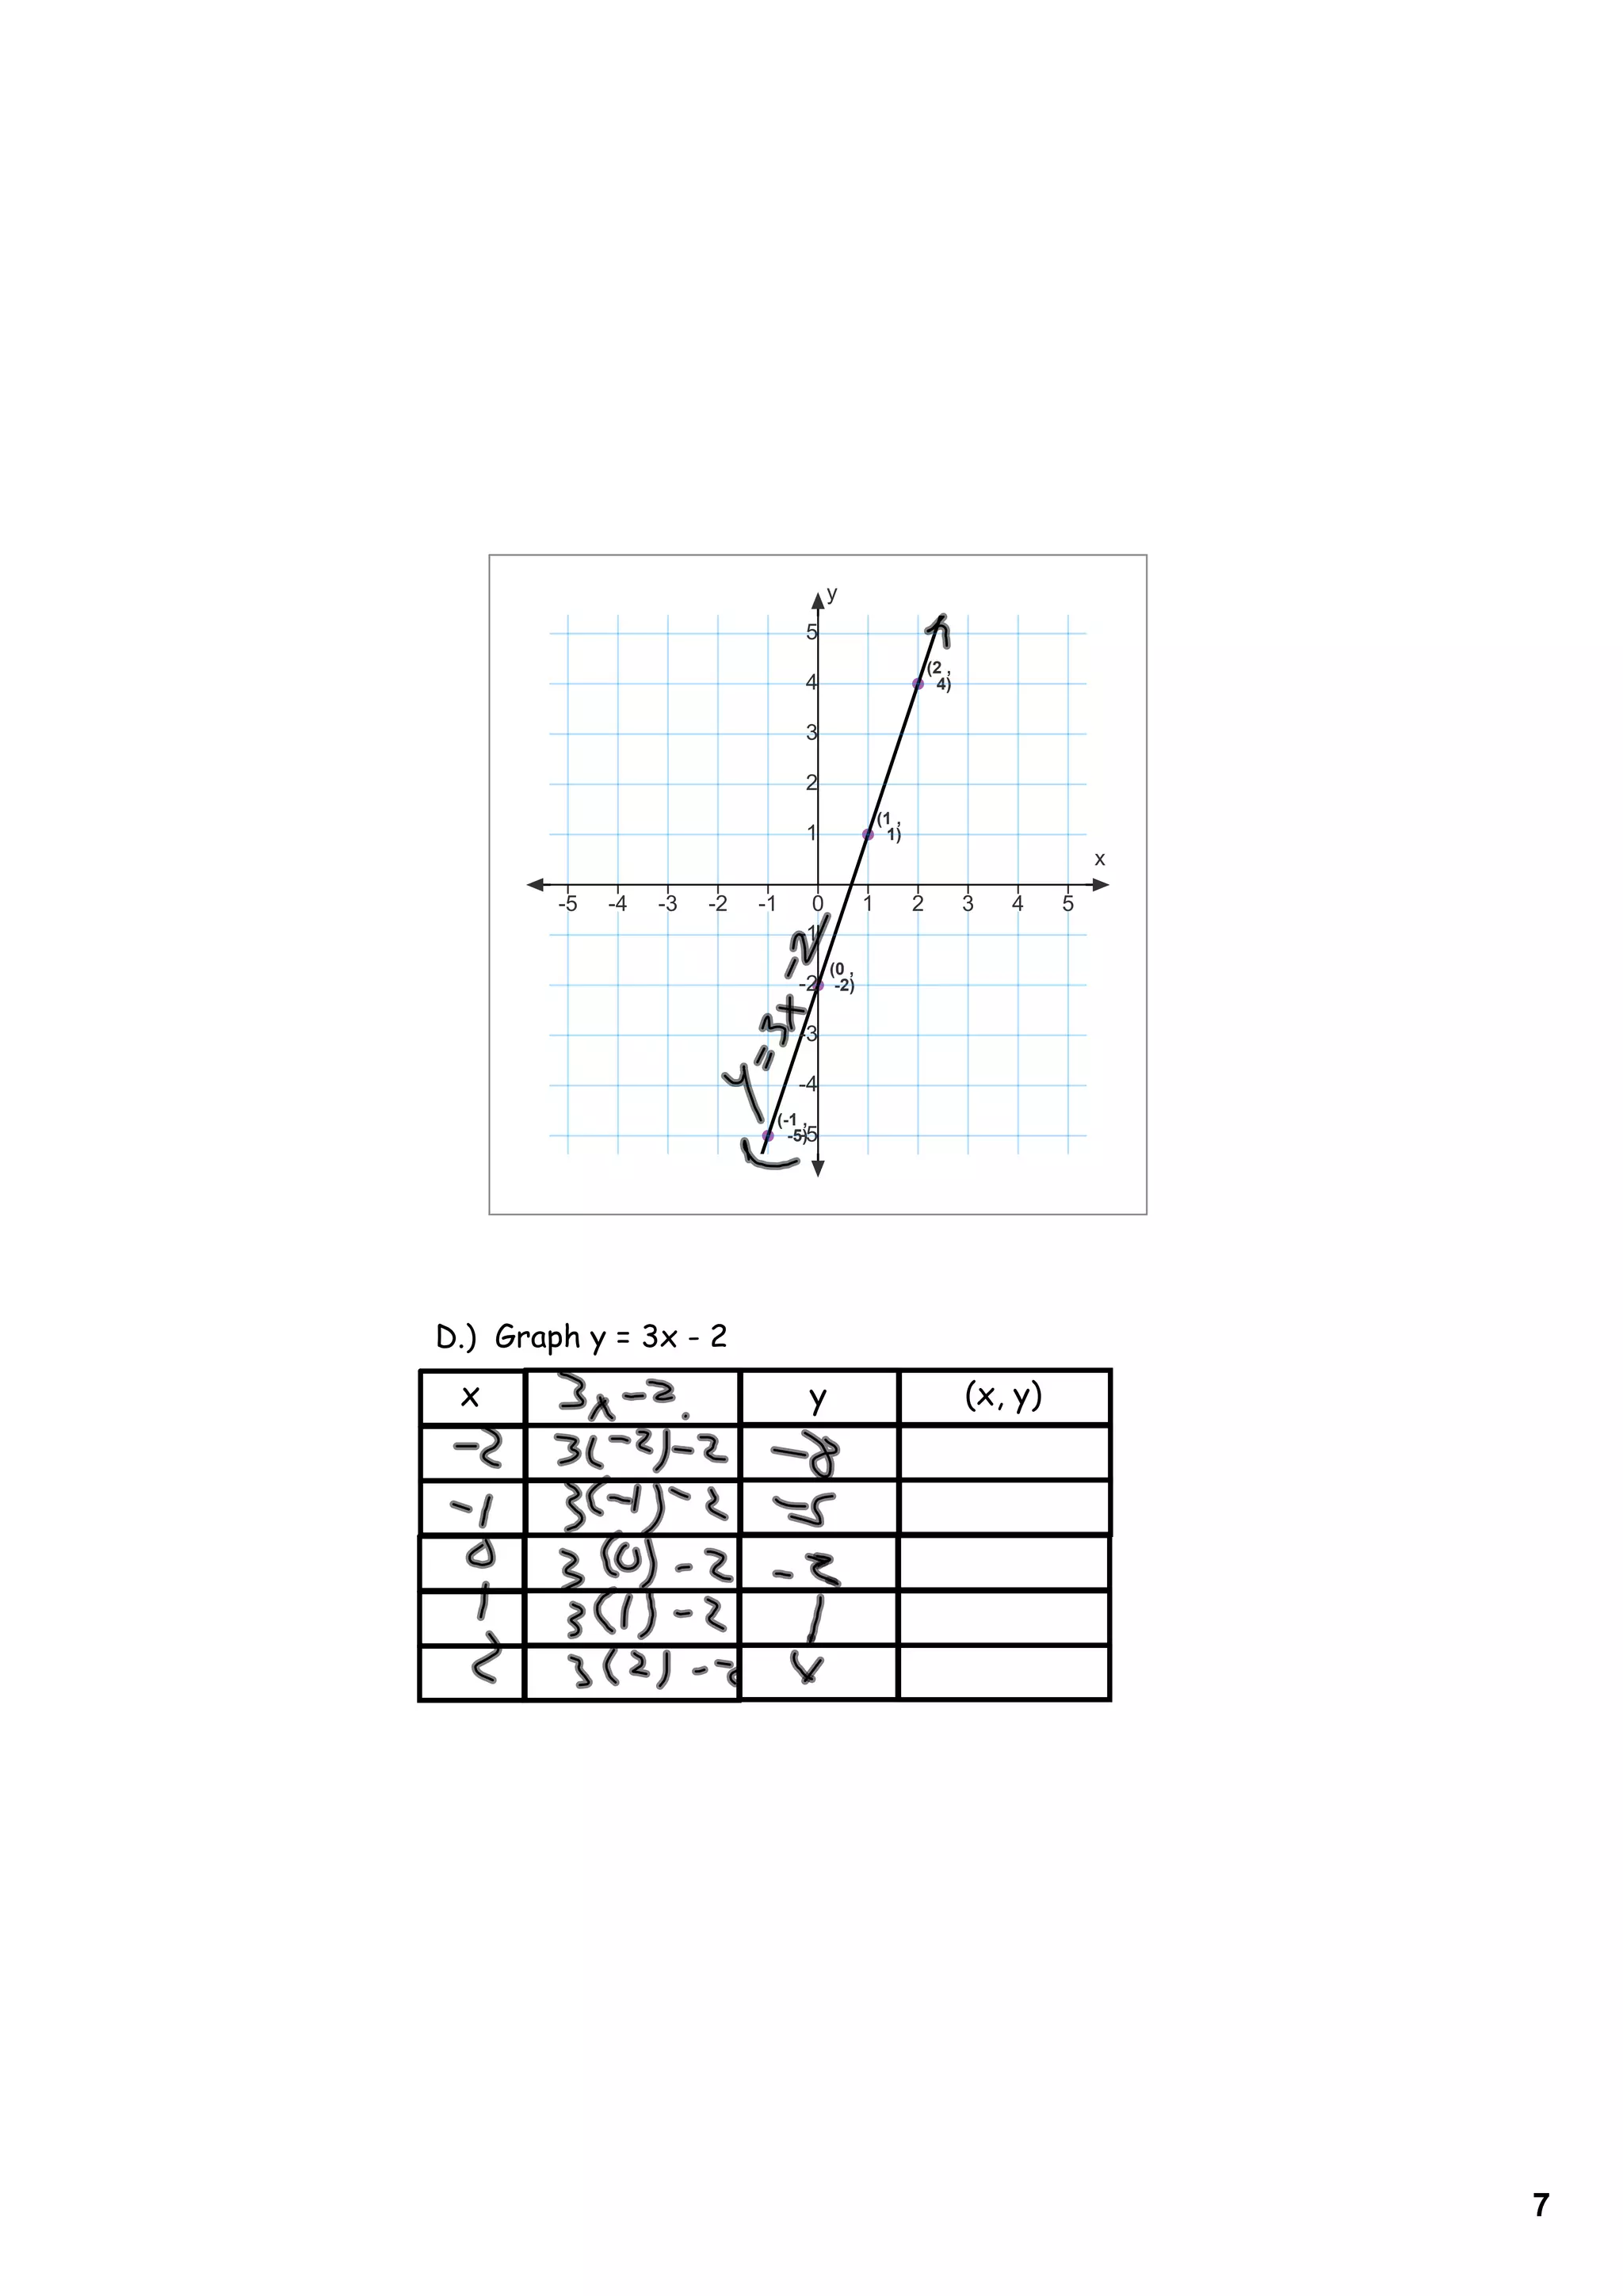
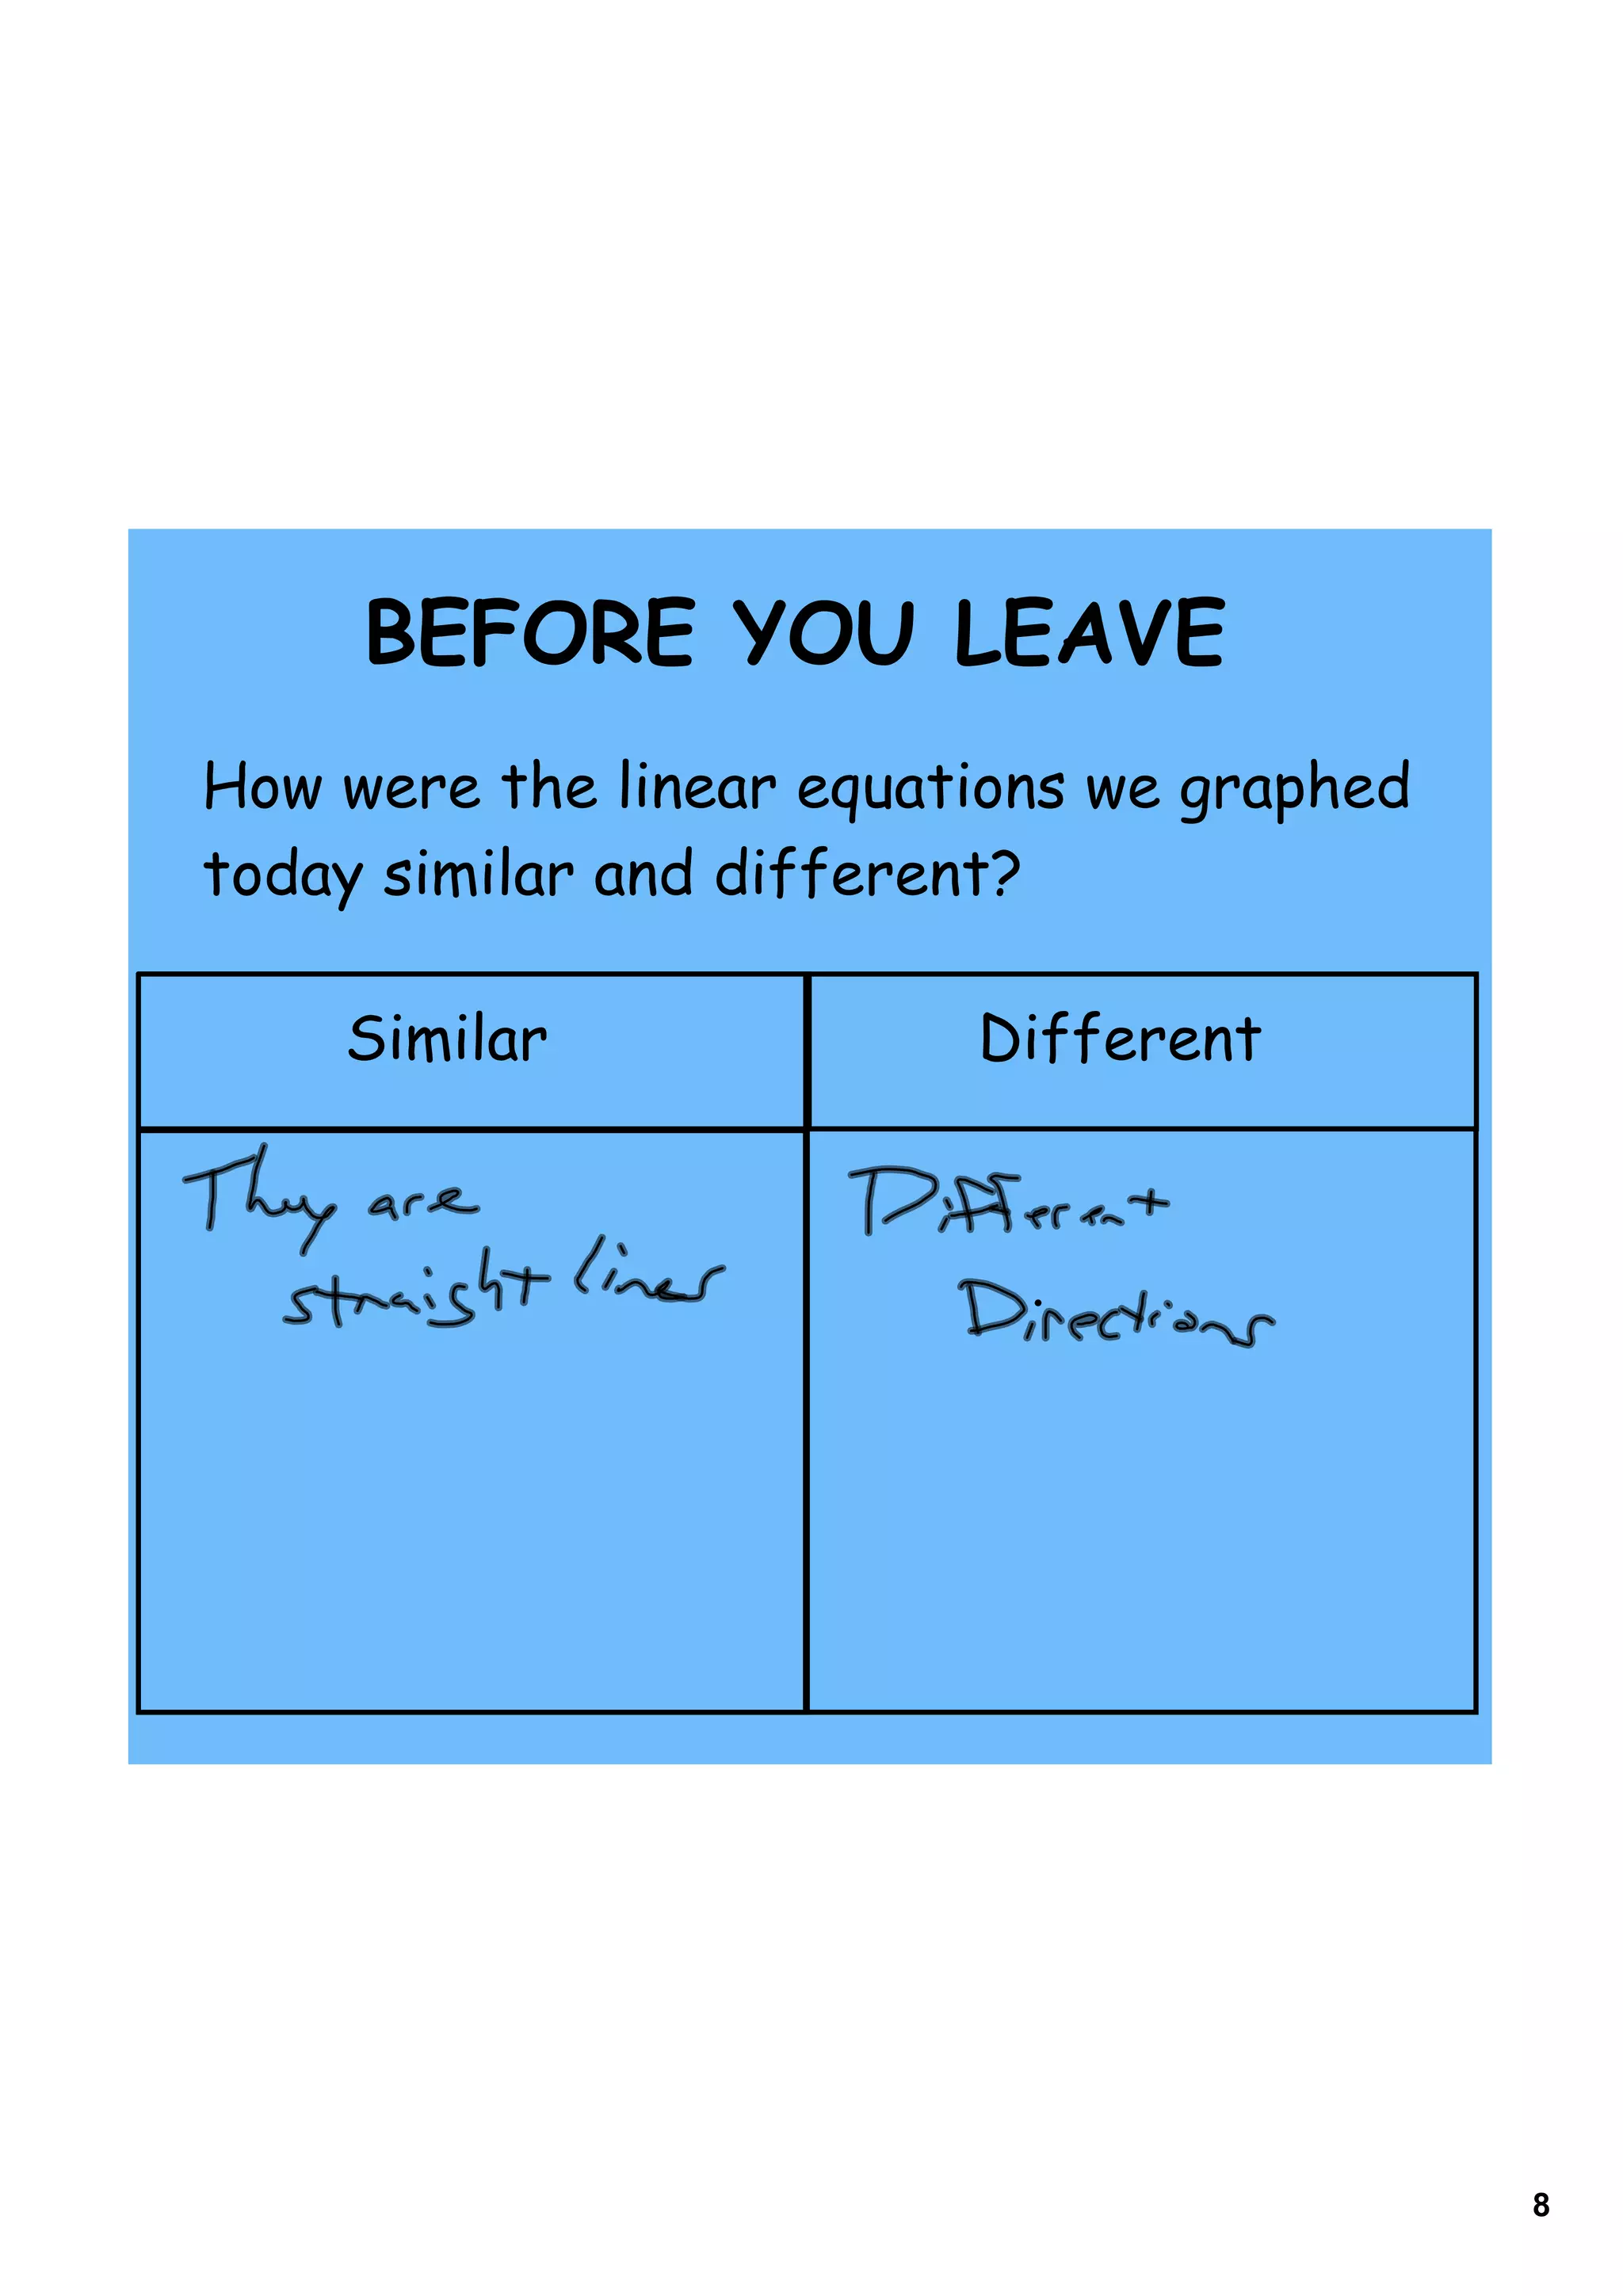
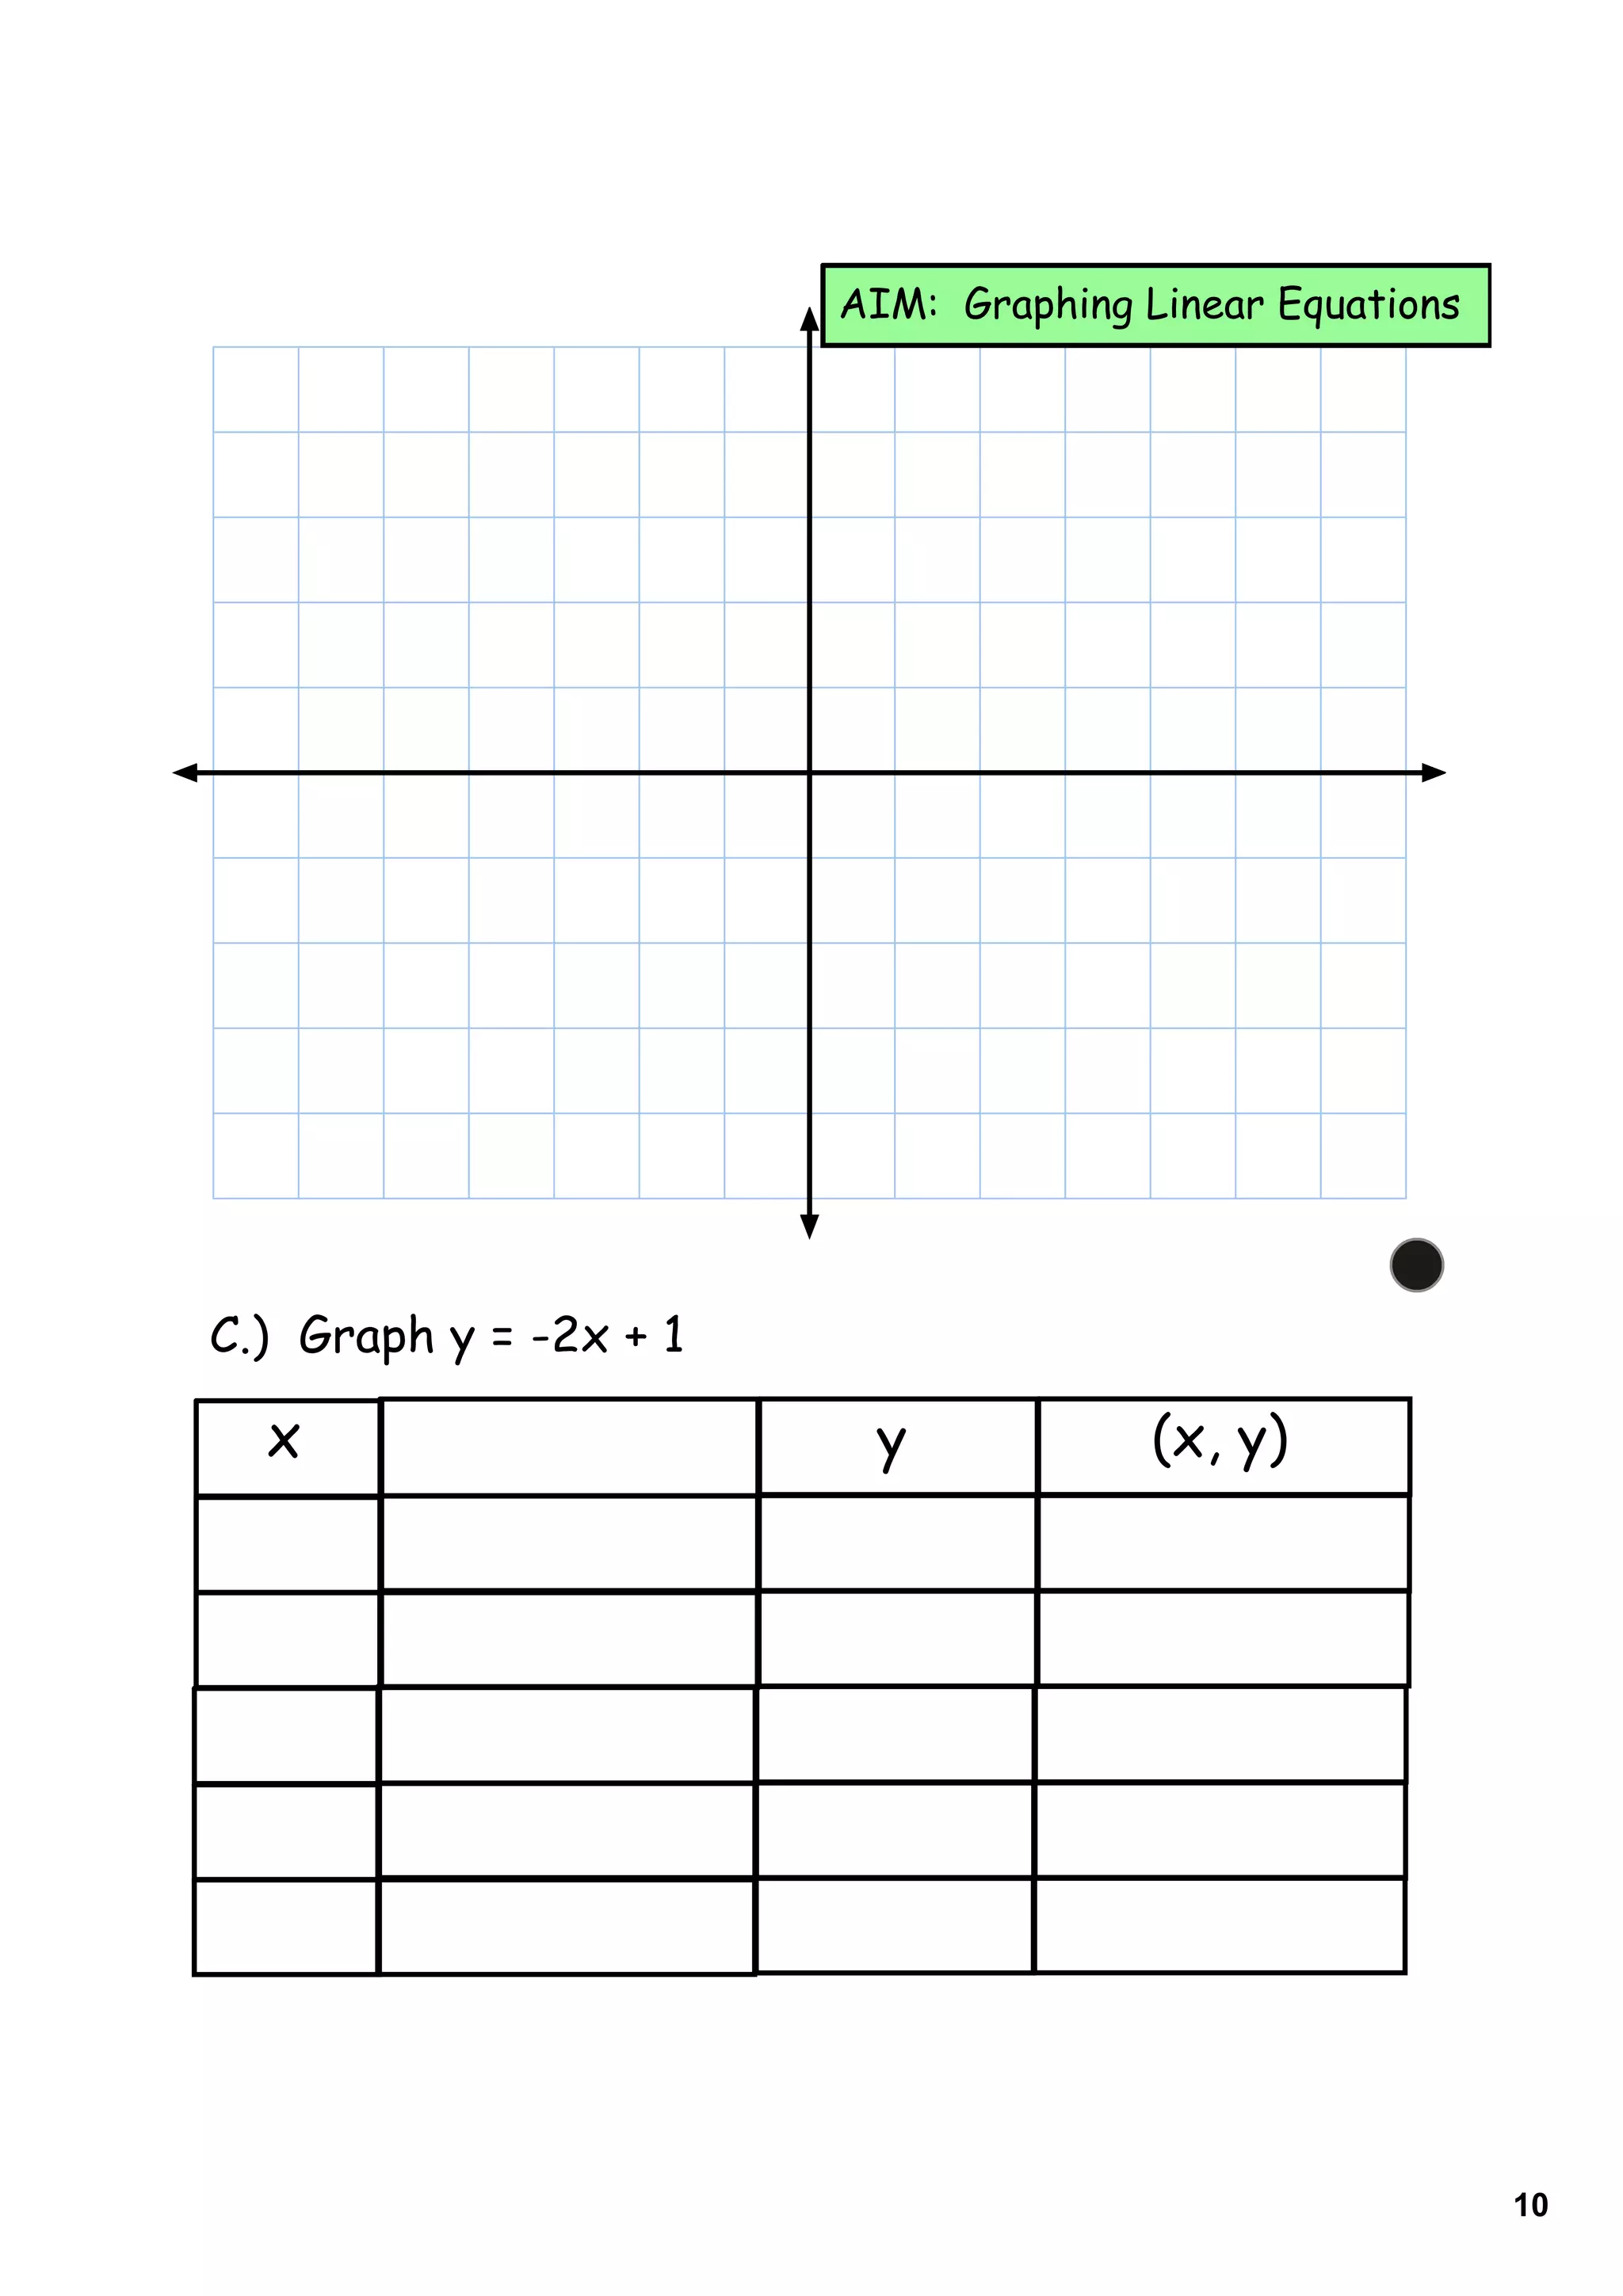
AIM: Graphing Linear Equations


                       Do Now


                                         A

                                     B


                                 C


                                             1
Anticipatory Set
   Find the solution to each equation:
   x+3=5        Solution:     x+3=y       Solution:


1.) How does the solution to the two equations
differ?


2.) How do the equations differ?

3.) Try graphing the solution set.

4.) What does the graph look like?


                                                      2
Linear Equations:

1.) Contains two variables

2.) Graphs straight lines


                             3
y
                                      5

                                      4

                                      3

                                      2

                                      1
                                                                    x

             ­5   ­4   ­3   ­2   ­1    0       1   2   3    4   5
                                      ­1

                                      ­2

                                      ­3

                                      ­4

                                      ­5


A.) 2x = y

  x                                   y                    (x, y)


                                                                        4
y
                                                5

                                                4

                                                3

                                                2

                                                1
                                                                              x

                   ­5   ­4   ­3   ­2       ­1    0       1   2   3    4   5
                                                ­1

                                                ­2

                                                ­3

                                                ­4

                                                ­5


B.) x + (-3) = y

 x                                     y                     (x, y)


                                                                                  5
y
                                     5

                                     4

                                     3

                                     2

                                     1
                                                                   x

            ­5   ­4   ­3   ­2   ­1    0       1   2   3   4    5
                                     ­1

                                     ­2

                                     ­3

                                     ­4

                                     ­5


C.) Graph y = -2x + 1

  x                                  y                (x, y)


                                                                       6
y
                                 5
                                                             (2 ,
                                 4                             4)

                                 3

                                 2
                                                  (1 ,
                                 1                  1)
                                                                                 x

        ­5   ­4   ­3   ­2   ­1     0          1          2          3   4    5
                                 ­1
                                       (0 ,
                                 ­2     ­2)

                                 ­3

                                 ­4
                             (­1 ,
                                 ­5
                               ­5)


D.) Graph y = 3x - 2
 x                                y                                 (x, y)


                                                                                     7
BEFORE YOU LEAVE
How were the linear equations we graphed
today similar and different?

    Similar              Different


                                           8
Mr. Tjersland's Math 7


Homework: Homework Sheet


                                 9
AIM: Graphing Linear Equations


C.) Graph y = -2x + 1

  x                      y             (x, y)


                                                         10

Day 2 graphing linear equations

  • 1.
    AIM: Graphing LinearEquations Do Now A B C 1
  • 2.
    Anticipatory Set Find the solution to each equation: x+3=5 Solution: x+3=y Solution: 1.) How does the solution to the two equations differ? 2.) How do the equations differ? 3.) Try graphing the solution set. 4.) What does the graph look like? 2
  • 3.
    Linear Equations: 1.) Containstwo variables 2.) Graphs straight lines 3
  • 4.
    y 5 4 3 2 1 x ­5 ­4 ­3 ­2 ­1 0 1 2 3 4 5 ­1 ­2 ­3 ­4 ­5 A.) 2x = y x y (x, y) 4
  • 5.
    y 5 4 3 2 1 x ­5 ­4 ­3 ­2 ­1 0 1 2 3 4 5 ­1 ­2 ­3 ­4 ­5 B.) x + (-3) = y x y (x, y) 5
  • 6.
    y 5 4 3 2 1 x ­5 ­4 ­3 ­2 ­1 0 1 2 3 4 5 ­1 ­2 ­3 ­4 ­5 C.) Graph y = -2x + 1 x y (x, y) 6
  • 7.
    y 5 (2 , 4  4) 3 2 (1 , 1  1) x ­5 ­4 ­3 ­2 ­1 0 1 2 3 4 5 ­1 (0 , ­2  ­2) ­3 ­4 (­1 , ­5  ­5) D.) Graph y = 3x - 2 x y (x, y) 7
  • 8.
    BEFORE YOU LEAVE Howwere the linear equations we graphed today similar and different? Similar Different 8
  • 9.
    Mr. Tjersland's Math7 Homework: Homework Sheet 9
  • 10.
    AIM: Graphing LinearEquations C.) Graph y = -2x + 1 x y (x, y) 10