The document provides information and examples on linear laws and linear relationships. It discusses:
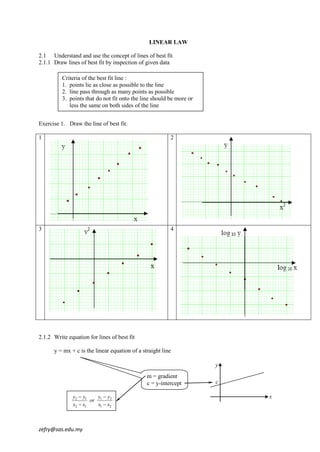
- Drawing lines of best fit by inspection of data points.
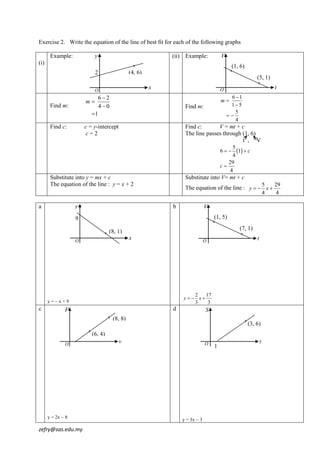
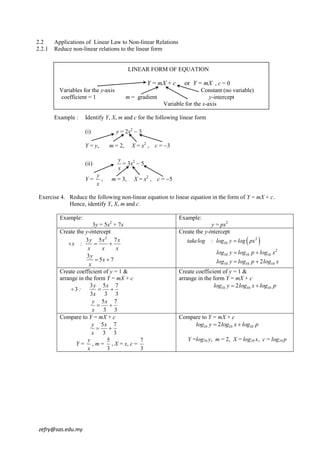
- Writing equations for lines of best fit in the form of y = mx + c.
- Determining values of variables from lines of best fit and equations.
- Reducing non-linear relationships to linear form by rearranging variables.
- Finding values of constants in non-linear relationships by plotting graphs of best fit lines and determining the gradient and y-intercept.
Worked examples are provided to illustrate key concepts like identifying dependent and independent variables, determining the gradient and y-intercept, and using these to solve for constants in non-


![2.2.2a Determine values of constants of non-linear relations when given lines of best fit
Example :
a
The variables x and y are related by the equation by x where a and b are constants.
x
The diagram below shows part of a line of best fit obtained by plotting a graph of xy against x2.
Find the values of a and b. xy
(4, 50)
(1, 35)
O
x2
From the graph identify the representation of y-axis and x-axis
Y = xy, X = x2
Reduce the equation given to linear form, Y = mX + c
by x a
b :
b b b x
x a
y
b bx
x x a x
x : x y
b bx
1 a
xy x 2
b b
Compare with Y = mX + c
1 a
Y = xy , m = , X = x2 , c =
b b
50 35
Find m from the graph : m 5
4 1
Find c, substitute X = 1, Y = 35, m = 5 into the equation Y = mX + c
35 = 5 (1) + c
c = 30
a
1 30
m 5 b
b a
Find the variables a and b : 30
1 1
b
5 5
a6
Exercise 5.
1 2
[y = 2x + 4] [y2 = 5(1/x) + 2]
zefry@sas.edu.my](https://image.slidesharecdn.com/linearlaw-130207215440-phpapp01/85/Linear-law-8-320.jpg)