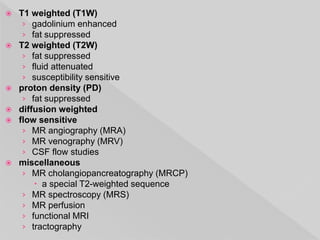
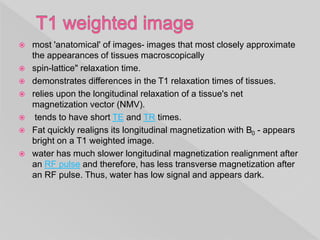
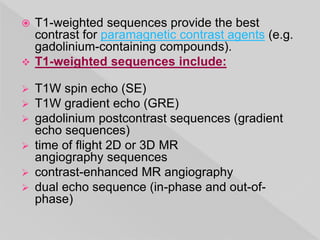
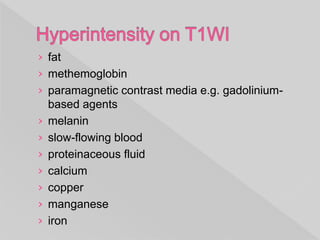
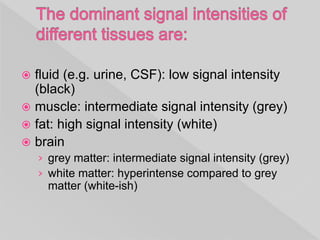
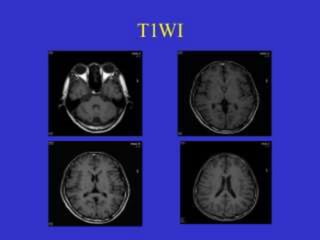
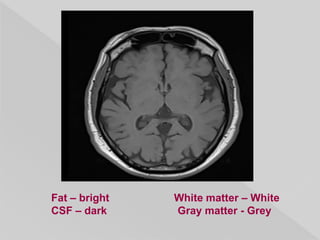
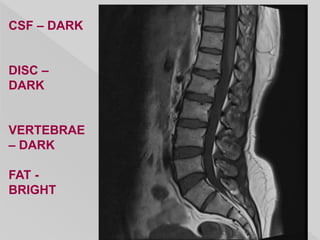
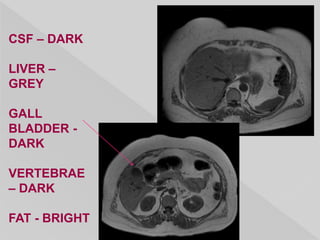
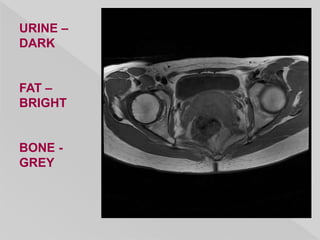
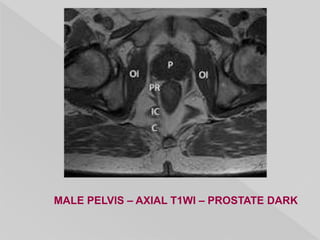
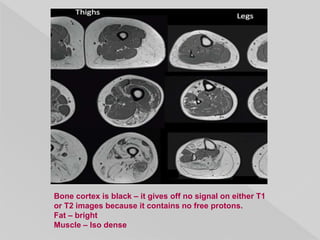
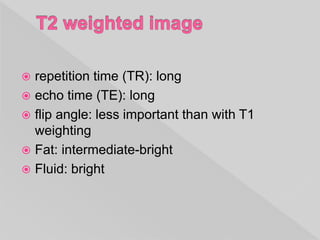
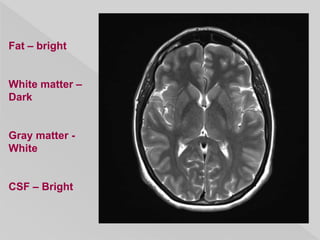
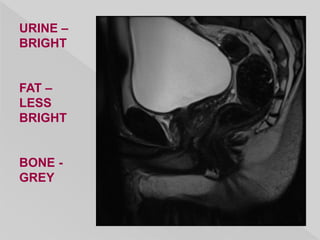
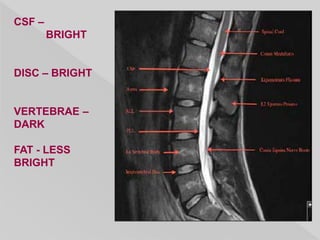
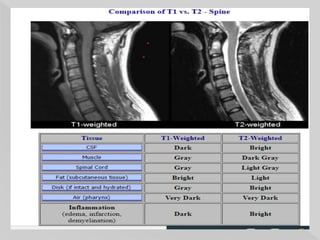
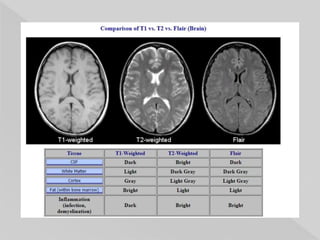
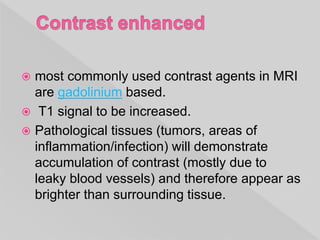
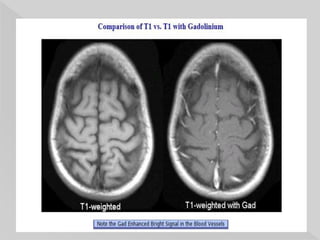
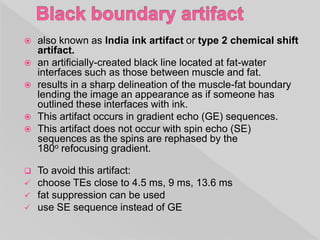
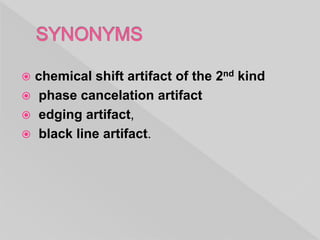
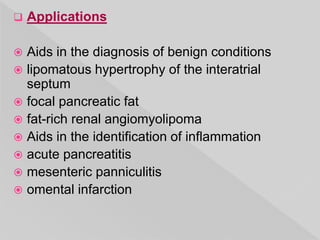
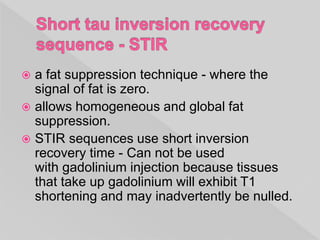
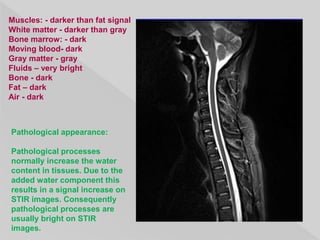
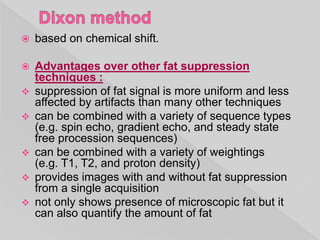
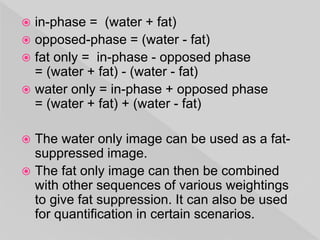
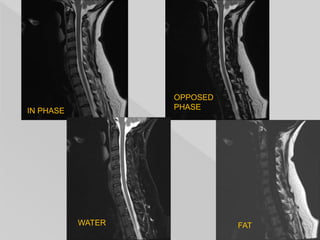
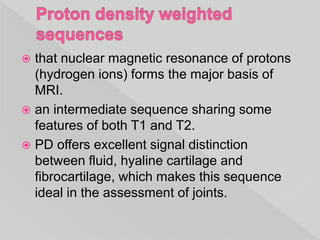
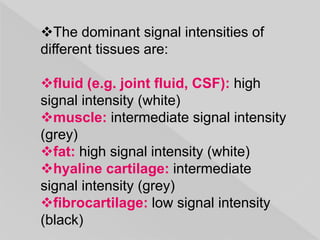
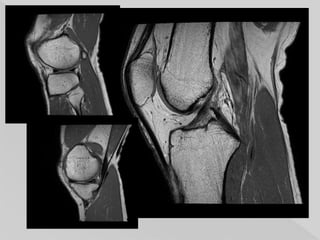
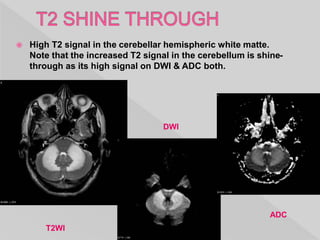
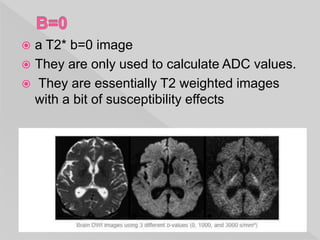
 T1 weighted (T1W)
› gadolinium enhanced
› fat suppressed
 T2 weighted (T2W)
› fat suppressed
› fluid attenuated
› susceptibility sensitive
 proton density (PD)
› fat suppressed
 diffusion weighted
 flow sensitive
› MR angiography (MRA)
› MR venography (MRV)
› CSF flow studies
 miscellaneous
› MR cholangiopancreatography (MRCP)
 a special T2-weighted sequence
› MR spectroscopy (MRS)
› MR perfusion
› functional MRI
› tractography
 most 'anatomical' of images- images that most closely approximate
the appearances of tissues macroscopically
 spin-lattice" relaxation time.
 demonstrates differences in the T1 relaxation times of tissues.
 relies upon the longitudinal relaxation of a tissue's net
magnetization vector (NMV).
 tends to have short TE and TR times.
 Fat quickly realigns its longitudinal magnetization with B0 - appears
bright on a T1 weighted image.
 water has much slower longitudinal magnetization realignment after
an RF pulse and therefore, has less transverse magnetization after
an RF pulse. Thus, water has low signal and appears dark.
 T1-weighted sequences provide the best
contrast for paramagnetic contrast agents (e.g.
gadolinium-containing compounds).
 T1-weighted sequences include:
 T1W spin echo (SE)
 T1W gradient echo (GRE)
 gadolinium postcontrast sequences (gradient
echo sequences)
 time of flight 2D or 3D MR
angiography sequences
 contrast-enhanced MR angiography
 dual echo sequence (in-phase and out-of-
phase)
› fat
› methemoglobin
› paramagnetic contrast media e.g. gadolinium-
based agents
› melanin
› slow-flowing blood
› proteinaceous fluid
› calcium
› copper
› manganese
› iron
 fluid (e.g. urine, CSF): low signal intensity
(black)
 muscle: intermediate signal intensity (grey)
 fat: high signal intensity (white)
 brain
› grey matter: intermediate signal intensity (grey)
› white matter: hyperintense compared to grey
matter (white-ish)
Fat – bright White matter – White
CSF – dark Gray matter - Grey
CSF – DARK
DISC –
DARK
VERTEBRAE
– DARK
FAT -
BRIGHT
CSF – DARK
LIVER –
GREY
GALL
BLADDER -
DARK
VERTEBRAE
– DARK
FAT - BRIGHT
URINE –
DARK
FAT –
BRIGHT
BONE -
GREY
MALE PELVIS – AXIAL T1WI – PROSTATE DARK
Bone cortex is black – it gives off no signal on either T1
or T2 images because it contains no free protons.
Fat – bright
Muscle – Iso dense
 repetition time (TR): long
 echo time (TE): long
 flip angle: less important than with T1
weighting
 Fat: intermediate-bright
 Fluid: bright
Fat – bright
White matter –
Dark
Gray matter -
White
CSF – Bright
URINE –
BRIGHT
FAT –
LESS
BRIGHT
BONE -
GREY
CSF –
BRIGHT
DISC – BRIGHT
VERTEBRAE –
DARK
FAT - LESS
BRIGHT
 most commonly used contrast agents in MRI
are gadolinium based.
 T1 signal to be increased.
 Pathological tissues (tumors, areas of
inflammation/infection) will demonstrate
accumulation of contrast (mostly due to
leaky blood vessels) and therefore appear as
brighter than surrounding tissue.
 Fat suppression (or attenuation or
saturation) is a tweak performed on many T1
weighted sequences, to suppress the bright
signal from fat.
 This is performed most commonly in two
scenarios:
 After the administration of gadolinium
contrast.
 some particular tissue is fatty and want to
prove it, showing that it becomes dark on fat
suppressed sequences.
 can be applied to both T1 and T2 weighted
sequences.
 FAT - short relaxation time – BRIGHT ON
T1 AND T2WI.
 FAT SIGNAL - responsible for artifacts such
as ghosting and chemical shift. ALSO mask
subtle contrast difference in non-fatty tissue.
 Contrast enhancing tumor may be hidden by
the surrounding fat.
I. (CHESS): Chemical shift–selective
saturation (CHESS) fat saturation (fat-sat)
techniques – used in MSK imaging.
II. phase contrast techniques (by same mechanism
as black boundary or india ink artifacts)
III. short T1 relaxation time by means of inversion
recovery sequences (STIR technique)
IV. Dixon method
V. hybrid techniques combining several of these fat
suppression techniques such as SPIR (spectral
presaturation with inversion recovery).
 CHESS techniques are more prone to
magnetic field inhomogeneities but can be
used with gadolinium-based contrast
material. Inversion recovery–based
techniques are less susceptible to magnetic
field inhomogeneities but may decrease the
signal intensity of contrast material.
 also known as India ink artifact or type 2 chemical shift
artifact.
 an artificially-created black line located at fat-water
interfaces such as those between muscle and fat.
 results in a sharp delineation of the muscle-fat boundary
lending the image an appearance as if someone has
outlined these interfaces with ink.
 This artifact occurs in gradient echo (GE) sequences.
 This artifact does not occur with spin echo (SE)
sequences as the spins are rephased by the
180o refocusing gradient.
 To avoid this artifact:
 choose TEs close to 4.5 ms, 9 ms, 13.6 ms
 fat suppression can be used
 use SE sequence instead of GE
 chemical shift artifact of the 2nd kind
 phase cancelation artifact
 edging artifact,
 black line artifact.
 Applications
 Aids in the diagnosis of benign conditions
 lipomatous hypertrophy of the interatrial
septum
 focal pancreatic fat
 fat-rich renal angiomyolipoma
 Aids in the identification of inflammation
 acute pancreatitis
 mesenteric panniculitis
 omental infarction
BLACK BOUNDRY ARTEFACT - The muscles are sharply outlined in black.
 a fat suppression technique - where the
signal of fat is zero.
 allows homogeneous and global fat
suppression.
 STIR sequences use short inversion
recovery time - Can not be used
with gadolinium injection because tissues
that take up gadolinium will exhibit T1
shortening and may inadvertently be nulled.
Muscles: - darker than fat signal
White matter - darker than gray
Bone marrow: - dark
Moving blood- dark
Gray matter - gray
Fluids – very bright
Bone - dark
Fat – dark
Air - dark
Pathological appearance:
Pathological processes
normally increase the water
content in tissues. Due to the
added water component this
results in a signal increase on
STIR images. Consequently
pathological processes are
usually bright on STIR
images.
 based on chemical shift.
 Advantages over other fat suppression
techniques :
 suppression of fat signal is more uniform and less
affected by artifacts than many other techniques
 can be combined with a variety of sequence types
(e.g. spin echo, gradient echo, and steady state
free procession sequences)
 can be combined with a variety of weightings
(e.g. T1, T2, and proton density)
 provides images with and without fat suppression
from a single acquisition
 not only shows presence of microscopic fat but it
can also quantify the amount of fat
 in-phase = (water + fat)
 opposed-phase = (water - fat)
 fat only = in-phase - opposed phase
= (water + fat) - (water - fat)
 water only = in-phase + opposed phase
= (water + fat) + (water - fat)
 The water only image can be used as a fat-
suppressed image.
 The fat only image can then be combined
with other sequences of various weightings
to give fat suppression. It can also be used
for quantification in certain scenarios.
IN PHASE
OPPOSED
PHASE
WATER FAT
 is seen in a significant proportion of
fat/water suppressed sequences using
the Dixon method.
 Computational error whether the
inhomogeneous areas contains fat or water.
 The images have geographic regions of
inappropriate suppression with sharp
margins.
 It can be seen anywhere but is most striking
when a whole solid organ appears black on
suppressed images.
Dixon
method throug
h the thoracic
spine
demonstrating f
at-water swap
artifact (blue
arrow) in the
upper part of
the scan. The
CSF signal is
incorrectly
interpreted
resulting in a
geographic
region of fat-
water
swapping.
Post-contrast fat-suppressed series of abdominal MRI shows sharply
demarcated areas of opposing signal. The left kidney is very low in
signal, and the right kidney is high in signal. This is a result of a fat-
water swap artifact with the Dixon technique of acquiring images.
 a special inversion recovery sequence with a
long inversion time.
 This removes signal from the cerebrospinal
fluid in the resulting images.
 similar to T2 weighted images with grey
matter brighter than white matter but CSF is
dark instead of bright.
 The FLAIR sequence is part of almost
all protocols for imaging the brain, particularly
useful in the detection of subtle changes at the
periphery of the hemispheres and in the
periventricular region close to CSF.
 The usefulness of FLAIR sequences in many
diseases of the central nervous system:
 infarction
 multiple sclerosis
 subarachnoid hemorrhage
 head injuries, and others.
 Post-contrast FLAIR images - to assess
leptomeningeal diseases, such as meningitis
Fat – bright
White matter –
Dark
Gray matter -
White
CSF – Dark
FLAIR
SEQUENCE
 particularly sensitive to compounds which
distort the local magnetic field and as such
make it useful in detecting blood products,
calcium, etc.
 a 3D high-spatial-resolution fully velocity
corrected gradient-echo MRI sequence.
 Paramagnetic compounds :
 deoxyhemoglobin
 ferritin
 Hemosiderin
 Diamagnetic compounds :
 bone minerals
 dystrophic calcifications
 Typically the images post proessing presented
are:
 magnitude (mag)
 filtered phase
 SWI (combined post-processed magnitude and
phase)
 Clinical use:
 identification of small amounts
of hemorrhage/blood products or calcium, both
of which may be in apparent on other MRI
sequences.
 well suited to assess veins as deoxyhemoglobin
results in both a loss in magnitude and a shift in
phase .
 post-processed SWI :
calcification and blood products both
demonstrate signal drop out and blooming.
 filtered phase images :
diamagnetic and paramagnetic compounds
will affect phase differently (i.e.
veins/hemorrhage and calcification will
appear of opposite signal intensity)
 On phase imaging ,
whether a lesion appears black or white on
phase imaging depends on numerous
factors:
 handedness of the system – right or left
 how images are presented (e.g. grey scale
inversion)
 size and degree to which a lesion causes a
phase shift (aliasing)
 oxygenation
 internal control for comparision :
 paramagnetic (e.g. blood products) – the
internal cerebral veins
 diamagnetic (e.g. calcification) - pineal or
choroid calcification.
 If it is the same as veins it is paramagnetic and
therefore contains blood products. If it is the
opposite, then it will be diamagnetic and
therefore most likely dystrophic calcification.
SWI PHASE
 that nuclear magnetic resonance of protons
(hydrogen ions) forms the major basis of
MRI.
 an intermediate sequence sharing some
features of both T1 and T2.
 PD offers excellent signal distinction
between fluid, hyaline cartilage and
fibrocartilage, which makes this sequence
ideal in the assessment of joints.
The dominant signal intensities of
different tissues are:
fluid (e.g. joint fluid, CSF): high
signal intensity (white)
muscle: intermediate signal intensity
(grey)
fat: high signal intensity (white)
hyaline cartilage: intermediate
signal intensity (grey)
fibrocartilage: low signal intensity
(black)
 based upon measuring the random
Brownian motion of water molecules within
a voxel of tissue.
 assess the ease with which water molecules
move around within a tissue.
 mostly representing fluid within the
extracellular space.
 gives insight into cellularity (e.g. tumors), cell
swelling (e.g. ischemia) and edema.
 The dominant signal intensities of different
tissues are:
 fluid (e.g. urine, CSF): no restriction to
diffusion
 soft tissues (muscle, solid organs, brain):
intermediate diffusion
 fat: little signal due to paucity of water
 three sets of images :
 isotropic diffusion map - DWI,
 the pulse sequence - ADC &
 B=0 images.
 an isotropic T2 weighted map as it represents
the combination of actual diffusion values and
T2 signal.
 It is a relatively low resolution image with the
following appearance:
 grey matter: intermediate signal intensity (grey)
 white matter: slightly hypointense compared to
grey matter
 CSF: low signal (black)
 fat: little signal due to paucity of water
 other soft tissues: intermediate signal intensity
(grey)
DWI AT
B = 200
 Acute pathology (ischemic stroke, cellular
tumor, pus) : increased signal denoting
restricted diffusion.
 T2 shine through phenomenon : bright on
T2 will appear bright on DWI images without
there being an abnormal restricted diffusion.
 High T2 signal in the cerebellar hemispheric white matte.
Note that the increased T2 signal in the cerebellum is shine-
through as its high signal on DWI & ADC both.
T2WI
DWI
ADC
 representing the actual diffusion values of
the tissue without T2 effects.
 much more useful, and objective measures
of diffusion values can be obtain.
 grayscale inverted DWI images.
 They are relatively low resolution images
with the following appearances:
 grey matter: intermediate signal intensity
(grey)
 white matter: slightly hyperintense compared
to grey matter
 CSF: high signal (white)
 fat: little signal due to paucity of water
 other soft tissues: intermediate signal
intensity (grey)
 Acute pathology (ischemic stroke, cellular
tumor, pus) : decreased signal denoting
restricted diffusion.
CENTRAL DIFFUSION
RESTRICTION IN CASE OF
ABSCESS
Low ADC values is seen
involving the right-sided basal
ganglia and cortex of the MCA
and ACA territories of the right
cerebral hemisphere.
 Clinical application
 Diffusion-weighted imaging has a major role in the following
clinical situations
 early identification of ischemic stroke
 differentiation of acute from chronic stroke
 differentiation of acute stroke from other stroke mimics
 differentiation of epidermoid cyst from an arachnoid cyst
 differentiation of abscess from necrotic tumors
 assessment of cortical lesions in Creutzfeldt-Jakob disease
(CJD)
 differentiation of herpes encephalitis from diffuse temporal
gliomas
 assessment of the extent of diffuse axonal injury
 grading of diffuse gliomas and meningiomas
 assessment of active demyelination
 grading of prostate lesions (see PIRADS)
 differentiation between cholesteatoma and otitis media
 b value measures the degree of diffusion
weighting applied,
 a larger b value is achieved by increasing the
gradient amplitude and duration and by
widening the interval between paired gradient
pulses.
 To sense slow moving water molecules and
smaller diffusion distances, b values should be
higher (e.g. b = 500 s/mm2).
 Apparent diffusion coefficient is calculated using
different b-values (e.g 0-1000 s/mm2).
 A useful rule of thumb is to choose the b value
such that (b X ADC) is nearly equal to 1.
 a T2* b=0 image
 They are only used to calculate ADC values.
 They are essentially T2 weighted images
with a bit of susceptibility effects
 One of the great advantages of MRI is its
ability to image physiological flow of fluids
(e.g. blood flow) often without the need for
intravenous contrast. This allows for the
imaging of arteries, veins and CSF flow.
 These includes
 MR ANGIOGRAPHY
 MR VENOGRAPHY
 CSF FLOW STUDIES
 alternative to conventional
angiography and CT angiography,
eliminating the need for ionizing
radiation and iodinated contrast media
 contrast enhanced MR angiography (MRA)
 non-contrast enhanced MR angiography
(MRA)
 a technique involving 3D spoiled gradient-echo
(GE) sequences, with administration
of gadolinium-based contrast agents (GBCA).
 T1 weighted spoiled gradient-echo sequence
(flip angle 25° - 50° allows T1-weighting)
 central k-space acquisition corresponding to
arterial phase of the study maximizes
preferential visualization of arteries
 use of GBCAs to shorten T1 interval of the
blood which appears bright as a result
Beautiful definition of
the aorta and right
renal artery (and left
renal artery stump).
MIP MRA
VOLUME RENDERED
MRA
 Non contrast enhanced MR angiography is
performed in several ways including:
 time of flight angiography
 phase contrast angiography
 three-dimensional (3D) electrocardiograph-
triggered half-Fourier fast spin echo
 Generally, these techniques are time-
consuming as compared with contrast
enhanced MR angiography.
 a MRI technique to visualize flow within
vessels, without the need to
administer contrast.
 based on the phenomenon of flow-related
enhancement of spins entering into an
imaging slice.
 s a result of being unsaturated, these spins
give more signal than surrounding stationary
spins.
 With 2-D TOF,
multiple thin imaging slices are acquired
with a flow-compensated gradient-echo
sequence.
 3-D TOF ,
recunstruction of 2D images , combining
them with maximum intensity projections, o
obtain a 3-D image of the vessels analogous to
conventional angiography.
 Key points
 short TR
 image-plane kept perpendicular to flow direction
 slow flow or flow from a vessel parallel to the scan
plane may become desaturated just like stationary
tissue, resulting in a signal loss from the vessel
 turbulent flow may undergo spin-dephasing and
unexpectedly short T2 relaxation: again resulting in
a signal loss from the vessel
 acquisition times are relatively long.
 retrograde arterial flow may be obscured if
venous saturation bands have been applied.
 artifacts: ghosting, susceptibility artifact
 very T1 bright signal will be visible, e.g.
hemorrhage
 able to qualitatively assess and quantify
pulsatile CSF flow.
 The most common technique used : time-
resolved 2D phase-contrast MRI with
velocity encoding.
 Images are typically presented in sets of 3 for
each plane and velocity encoding (VENC)
obtained, similar to susceptibility weighted
imaging (SWI). The set comprises of 1:
 re-phased image (magnitude of flow
compensated signal)
› flow is of high signal
› background is visible
 magnitude image (magnitude of difference
signal)
› flow is of high signal (regardless of direction)
› background is suppressed
 phase image (phase of difference signal)
› signal is dependent on direction: forward flow is of
high signal; reverse flow is of low signal
› background is mid-grey
 Clinical applications
 The following clinical situations can benefit
from CSF flow studies 2:
 aqueduct stenosis
 normal pressure hydrocephalus (NPH)
 patency of third ventriculostomy
 flow at the cervicomedullary junction
(foramen magnum)
› Chiari I malformation
› achondroplasia
Axial Re-phased (VENC) Axial Phase (VENC 5) Axial Magnitude (VENC
15)
MRI SEQUENCES BASICS AND ADVANCES  .pptx

MRI SEQUENCES BASICS AND ADVANCES .pptx

  • 2.
     T1 weighted(T1W) › gadolinium enhanced › fat suppressed  T2 weighted (T2W) › fat suppressed › fluid attenuated › susceptibility sensitive  proton density (PD) › fat suppressed  diffusion weighted  flow sensitive › MR angiography (MRA) › MR venography (MRV) › CSF flow studies  miscellaneous › MR cholangiopancreatography (MRCP)  a special T2-weighted sequence › MR spectroscopy (MRS) › MR perfusion › functional MRI › tractography
  • 3.
     most 'anatomical'of images- images that most closely approximate the appearances of tissues macroscopically  spin-lattice" relaxation time.  demonstrates differences in the T1 relaxation times of tissues.  relies upon the longitudinal relaxation of a tissue's net magnetization vector (NMV).  tends to have short TE and TR times.  Fat quickly realigns its longitudinal magnetization with B0 - appears bright on a T1 weighted image.  water has much slower longitudinal magnetization realignment after an RF pulse and therefore, has less transverse magnetization after an RF pulse. Thus, water has low signal and appears dark.
  • 4.
     T1-weighted sequencesprovide the best contrast for paramagnetic contrast agents (e.g. gadolinium-containing compounds).  T1-weighted sequences include:  T1W spin echo (SE)  T1W gradient echo (GRE)  gadolinium postcontrast sequences (gradient echo sequences)  time of flight 2D or 3D MR angiography sequences  contrast-enhanced MR angiography  dual echo sequence (in-phase and out-of- phase)
  • 5.
    › fat › methemoglobin ›paramagnetic contrast media e.g. gadolinium- based agents › melanin › slow-flowing blood › proteinaceous fluid › calcium › copper › manganese › iron
  • 6.
     fluid (e.g.urine, CSF): low signal intensity (black)  muscle: intermediate signal intensity (grey)  fat: high signal intensity (white)  brain › grey matter: intermediate signal intensity (grey) › white matter: hyperintense compared to grey matter (white-ish)
  • 8.
    Fat – brightWhite matter – White CSF – dark Gray matter - Grey
  • 9.
    CSF – DARK DISC– DARK VERTEBRAE – DARK FAT - BRIGHT
  • 10.
    CSF – DARK LIVER– GREY GALL BLADDER - DARK VERTEBRAE – DARK FAT - BRIGHT
  • 11.
  • 12.
    MALE PELVIS –AXIAL T1WI – PROSTATE DARK
  • 13.
    Bone cortex isblack – it gives off no signal on either T1 or T2 images because it contains no free protons. Fat – bright Muscle – Iso dense
  • 14.
     repetition time(TR): long  echo time (TE): long  flip angle: less important than with T1 weighting  Fat: intermediate-bright  Fluid: bright
  • 15.
    Fat – bright Whitematter – Dark Gray matter - White CSF – Bright
  • 16.
  • 17.
    CSF – BRIGHT DISC –BRIGHT VERTEBRAE – DARK FAT - LESS BRIGHT
  • 20.
     most commonlyused contrast agents in MRI are gadolinium based.  T1 signal to be increased.  Pathological tissues (tumors, areas of inflammation/infection) will demonstrate accumulation of contrast (mostly due to leaky blood vessels) and therefore appear as brighter than surrounding tissue.
  • 22.
     Fat suppression(or attenuation or saturation) is a tweak performed on many T1 weighted sequences, to suppress the bright signal from fat.  This is performed most commonly in two scenarios:  After the administration of gadolinium contrast.  some particular tissue is fatty and want to prove it, showing that it becomes dark on fat suppressed sequences.
  • 23.
     can beapplied to both T1 and T2 weighted sequences.  FAT - short relaxation time – BRIGHT ON T1 AND T2WI.  FAT SIGNAL - responsible for artifacts such as ghosting and chemical shift. ALSO mask subtle contrast difference in non-fatty tissue.  Contrast enhancing tumor may be hidden by the surrounding fat.
  • 24.
    I. (CHESS): Chemicalshift–selective saturation (CHESS) fat saturation (fat-sat) techniques – used in MSK imaging. II. phase contrast techniques (by same mechanism as black boundary or india ink artifacts) III. short T1 relaxation time by means of inversion recovery sequences (STIR technique) IV. Dixon method V. hybrid techniques combining several of these fat suppression techniques such as SPIR (spectral presaturation with inversion recovery).
  • 25.
     CHESS techniquesare more prone to magnetic field inhomogeneities but can be used with gadolinium-based contrast material. Inversion recovery–based techniques are less susceptible to magnetic field inhomogeneities but may decrease the signal intensity of contrast material.
  • 26.
     also knownas India ink artifact or type 2 chemical shift artifact.  an artificially-created black line located at fat-water interfaces such as those between muscle and fat.  results in a sharp delineation of the muscle-fat boundary lending the image an appearance as if someone has outlined these interfaces with ink.  This artifact occurs in gradient echo (GE) sequences.  This artifact does not occur with spin echo (SE) sequences as the spins are rephased by the 180o refocusing gradient.  To avoid this artifact:  choose TEs close to 4.5 ms, 9 ms, 13.6 ms  fat suppression can be used  use SE sequence instead of GE
  • 27.
     chemical shiftartifact of the 2nd kind  phase cancelation artifact  edging artifact,  black line artifact.
  • 28.
     Applications  Aidsin the diagnosis of benign conditions  lipomatous hypertrophy of the interatrial septum  focal pancreatic fat  fat-rich renal angiomyolipoma  Aids in the identification of inflammation  acute pancreatitis  mesenteric panniculitis  omental infarction
  • 29.
    BLACK BOUNDRY ARTEFACT- The muscles are sharply outlined in black.
  • 30.
     a fatsuppression technique - where the signal of fat is zero.  allows homogeneous and global fat suppression.  STIR sequences use short inversion recovery time - Can not be used with gadolinium injection because tissues that take up gadolinium will exhibit T1 shortening and may inadvertently be nulled.
  • 31.
    Muscles: - darkerthan fat signal White matter - darker than gray Bone marrow: - dark Moving blood- dark Gray matter - gray Fluids – very bright Bone - dark Fat – dark Air - dark Pathological appearance: Pathological processes normally increase the water content in tissues. Due to the added water component this results in a signal increase on STIR images. Consequently pathological processes are usually bright on STIR images.
  • 32.
     based onchemical shift.  Advantages over other fat suppression techniques :  suppression of fat signal is more uniform and less affected by artifacts than many other techniques  can be combined with a variety of sequence types (e.g. spin echo, gradient echo, and steady state free procession sequences)  can be combined with a variety of weightings (e.g. T1, T2, and proton density)  provides images with and without fat suppression from a single acquisition  not only shows presence of microscopic fat but it can also quantify the amount of fat
  • 33.
     in-phase =(water + fat)  opposed-phase = (water - fat)  fat only = in-phase - opposed phase = (water + fat) - (water - fat)  water only = in-phase + opposed phase = (water + fat) + (water - fat)  The water only image can be used as a fat- suppressed image.  The fat only image can then be combined with other sequences of various weightings to give fat suppression. It can also be used for quantification in certain scenarios.
  • 34.
  • 35.
     is seenin a significant proportion of fat/water suppressed sequences using the Dixon method.  Computational error whether the inhomogeneous areas contains fat or water.  The images have geographic regions of inappropriate suppression with sharp margins.  It can be seen anywhere but is most striking when a whole solid organ appears black on suppressed images.
  • 36.
    Dixon method throug h thethoracic spine demonstrating f at-water swap artifact (blue arrow) in the upper part of the scan. The CSF signal is incorrectly interpreted resulting in a geographic region of fat- water swapping.
  • 37.
    Post-contrast fat-suppressed seriesof abdominal MRI shows sharply demarcated areas of opposing signal. The left kidney is very low in signal, and the right kidney is high in signal. This is a result of a fat- water swap artifact with the Dixon technique of acquiring images.
  • 38.
     a specialinversion recovery sequence with a long inversion time.  This removes signal from the cerebrospinal fluid in the resulting images.  similar to T2 weighted images with grey matter brighter than white matter but CSF is dark instead of bright.
  • 39.
     The FLAIRsequence is part of almost all protocols for imaging the brain, particularly useful in the detection of subtle changes at the periphery of the hemispheres and in the periventricular region close to CSF.  The usefulness of FLAIR sequences in many diseases of the central nervous system:  infarction  multiple sclerosis  subarachnoid hemorrhage  head injuries, and others.  Post-contrast FLAIR images - to assess leptomeningeal diseases, such as meningitis
  • 40.
    Fat – bright Whitematter – Dark Gray matter - White CSF – Dark FLAIR SEQUENCE
  • 42.
     particularly sensitiveto compounds which distort the local magnetic field and as such make it useful in detecting blood products, calcium, etc.  a 3D high-spatial-resolution fully velocity corrected gradient-echo MRI sequence.
  • 43.
     Paramagnetic compounds:  deoxyhemoglobin  ferritin  Hemosiderin  Diamagnetic compounds :  bone minerals  dystrophic calcifications
  • 44.
     Typically theimages post proessing presented are:  magnitude (mag)  filtered phase  SWI (combined post-processed magnitude and phase)  Clinical use:  identification of small amounts of hemorrhage/blood products or calcium, both of which may be in apparent on other MRI sequences.  well suited to assess veins as deoxyhemoglobin results in both a loss in magnitude and a shift in phase .
  • 45.
     post-processed SWI: calcification and blood products both demonstrate signal drop out and blooming.  filtered phase images : diamagnetic and paramagnetic compounds will affect phase differently (i.e. veins/hemorrhage and calcification will appear of opposite signal intensity)
  • 46.
     On phaseimaging , whether a lesion appears black or white on phase imaging depends on numerous factors:  handedness of the system – right or left  how images are presented (e.g. grey scale inversion)  size and degree to which a lesion causes a phase shift (aliasing)  oxygenation
  • 47.
     internal controlfor comparision :  paramagnetic (e.g. blood products) – the internal cerebral veins  diamagnetic (e.g. calcification) - pineal or choroid calcification.  If it is the same as veins it is paramagnetic and therefore contains blood products. If it is the opposite, then it will be diamagnetic and therefore most likely dystrophic calcification.
  • 48.
  • 49.
     that nuclearmagnetic resonance of protons (hydrogen ions) forms the major basis of MRI.  an intermediate sequence sharing some features of both T1 and T2.  PD offers excellent signal distinction between fluid, hyaline cartilage and fibrocartilage, which makes this sequence ideal in the assessment of joints.
  • 50.
    The dominant signalintensities of different tissues are: fluid (e.g. joint fluid, CSF): high signal intensity (white) muscle: intermediate signal intensity (grey) fat: high signal intensity (white) hyaline cartilage: intermediate signal intensity (grey) fibrocartilage: low signal intensity (black)
  • 52.
     based uponmeasuring the random Brownian motion of water molecules within a voxel of tissue.  assess the ease with which water molecules move around within a tissue.  mostly representing fluid within the extracellular space.  gives insight into cellularity (e.g. tumors), cell swelling (e.g. ischemia) and edema.
  • 53.
     The dominantsignal intensities of different tissues are:  fluid (e.g. urine, CSF): no restriction to diffusion  soft tissues (muscle, solid organs, brain): intermediate diffusion  fat: little signal due to paucity of water  three sets of images :  isotropic diffusion map - DWI,  the pulse sequence - ADC &  B=0 images.
  • 54.
     an isotropicT2 weighted map as it represents the combination of actual diffusion values and T2 signal.  It is a relatively low resolution image with the following appearance:  grey matter: intermediate signal intensity (grey)  white matter: slightly hypointense compared to grey matter  CSF: low signal (black)  fat: little signal due to paucity of water  other soft tissues: intermediate signal intensity (grey)
  • 55.
  • 57.
     Acute pathology(ischemic stroke, cellular tumor, pus) : increased signal denoting restricted diffusion.  T2 shine through phenomenon : bright on T2 will appear bright on DWI images without there being an abnormal restricted diffusion.
  • 58.
     High T2signal in the cerebellar hemispheric white matte. Note that the increased T2 signal in the cerebellum is shine- through as its high signal on DWI & ADC both. T2WI DWI ADC
  • 59.
     representing theactual diffusion values of the tissue without T2 effects.  much more useful, and objective measures of diffusion values can be obtain.  grayscale inverted DWI images.
  • 60.
     They arerelatively low resolution images with the following appearances:  grey matter: intermediate signal intensity (grey)  white matter: slightly hyperintense compared to grey matter  CSF: high signal (white)  fat: little signal due to paucity of water  other soft tissues: intermediate signal intensity (grey)
  • 61.
     Acute pathology(ischemic stroke, cellular tumor, pus) : decreased signal denoting restricted diffusion.
  • 62.
    CENTRAL DIFFUSION RESTRICTION INCASE OF ABSCESS Low ADC values is seen involving the right-sided basal ganglia and cortex of the MCA and ACA territories of the right cerebral hemisphere.
  • 63.
     Clinical application Diffusion-weighted imaging has a major role in the following clinical situations  early identification of ischemic stroke  differentiation of acute from chronic stroke  differentiation of acute stroke from other stroke mimics  differentiation of epidermoid cyst from an arachnoid cyst  differentiation of abscess from necrotic tumors  assessment of cortical lesions in Creutzfeldt-Jakob disease (CJD)  differentiation of herpes encephalitis from diffuse temporal gliomas  assessment of the extent of diffuse axonal injury  grading of diffuse gliomas and meningiomas  assessment of active demyelination  grading of prostate lesions (see PIRADS)  differentiation between cholesteatoma and otitis media
  • 64.
     b valuemeasures the degree of diffusion weighting applied,  a larger b value is achieved by increasing the gradient amplitude and duration and by widening the interval between paired gradient pulses.  To sense slow moving water molecules and smaller diffusion distances, b values should be higher (e.g. b = 500 s/mm2).  Apparent diffusion coefficient is calculated using different b-values (e.g 0-1000 s/mm2).  A useful rule of thumb is to choose the b value such that (b X ADC) is nearly equal to 1.
  • 65.
     a T2*b=0 image  They are only used to calculate ADC values.  They are essentially T2 weighted images with a bit of susceptibility effects
  • 66.
     One ofthe great advantages of MRI is its ability to image physiological flow of fluids (e.g. blood flow) often without the need for intravenous contrast. This allows for the imaging of arteries, veins and CSF flow.  These includes  MR ANGIOGRAPHY  MR VENOGRAPHY  CSF FLOW STUDIES
  • 67.
     alternative toconventional angiography and CT angiography, eliminating the need for ionizing radiation and iodinated contrast media  contrast enhanced MR angiography (MRA)  non-contrast enhanced MR angiography (MRA)
  • 68.
     a techniqueinvolving 3D spoiled gradient-echo (GE) sequences, with administration of gadolinium-based contrast agents (GBCA).  T1 weighted spoiled gradient-echo sequence (flip angle 25° - 50° allows T1-weighting)  central k-space acquisition corresponding to arterial phase of the study maximizes preferential visualization of arteries  use of GBCAs to shorten T1 interval of the blood which appears bright as a result
  • 69.
    Beautiful definition of theaorta and right renal artery (and left renal artery stump). MIP MRA VOLUME RENDERED MRA
  • 70.
     Non contrastenhanced MR angiography is performed in several ways including:  time of flight angiography  phase contrast angiography  three-dimensional (3D) electrocardiograph- triggered half-Fourier fast spin echo  Generally, these techniques are time- consuming as compared with contrast enhanced MR angiography.
  • 71.
     a MRItechnique to visualize flow within vessels, without the need to administer contrast.  based on the phenomenon of flow-related enhancement of spins entering into an imaging slice.  s a result of being unsaturated, these spins give more signal than surrounding stationary spins.
  • 72.
     With 2-DTOF, multiple thin imaging slices are acquired with a flow-compensated gradient-echo sequence.  3-D TOF , recunstruction of 2D images , combining them with maximum intensity projections, o obtain a 3-D image of the vessels analogous to conventional angiography.  Key points  short TR  image-plane kept perpendicular to flow direction
  • 73.
     slow flowor flow from a vessel parallel to the scan plane may become desaturated just like stationary tissue, resulting in a signal loss from the vessel  turbulent flow may undergo spin-dephasing and unexpectedly short T2 relaxation: again resulting in a signal loss from the vessel  acquisition times are relatively long.  retrograde arterial flow may be obscured if venous saturation bands have been applied.  artifacts: ghosting, susceptibility artifact  very T1 bright signal will be visible, e.g. hemorrhage
  • 75.
     able toqualitatively assess and quantify pulsatile CSF flow.  The most common technique used : time- resolved 2D phase-contrast MRI with velocity encoding.
  • 76.
     Images aretypically presented in sets of 3 for each plane and velocity encoding (VENC) obtained, similar to susceptibility weighted imaging (SWI). The set comprises of 1:  re-phased image (magnitude of flow compensated signal) › flow is of high signal › background is visible  magnitude image (magnitude of difference signal) › flow is of high signal (regardless of direction) › background is suppressed  phase image (phase of difference signal) › signal is dependent on direction: forward flow is of high signal; reverse flow is of low signal › background is mid-grey
  • 77.
     Clinical applications The following clinical situations can benefit from CSF flow studies 2:  aqueduct stenosis  normal pressure hydrocephalus (NPH)  patency of third ventriculostomy  flow at the cervicomedullary junction (foramen magnum) › Chiari I malformation › achondroplasia
  • 78.
    Axial Re-phased (VENC)Axial Phase (VENC 5) Axial Magnitude (VENC 15)