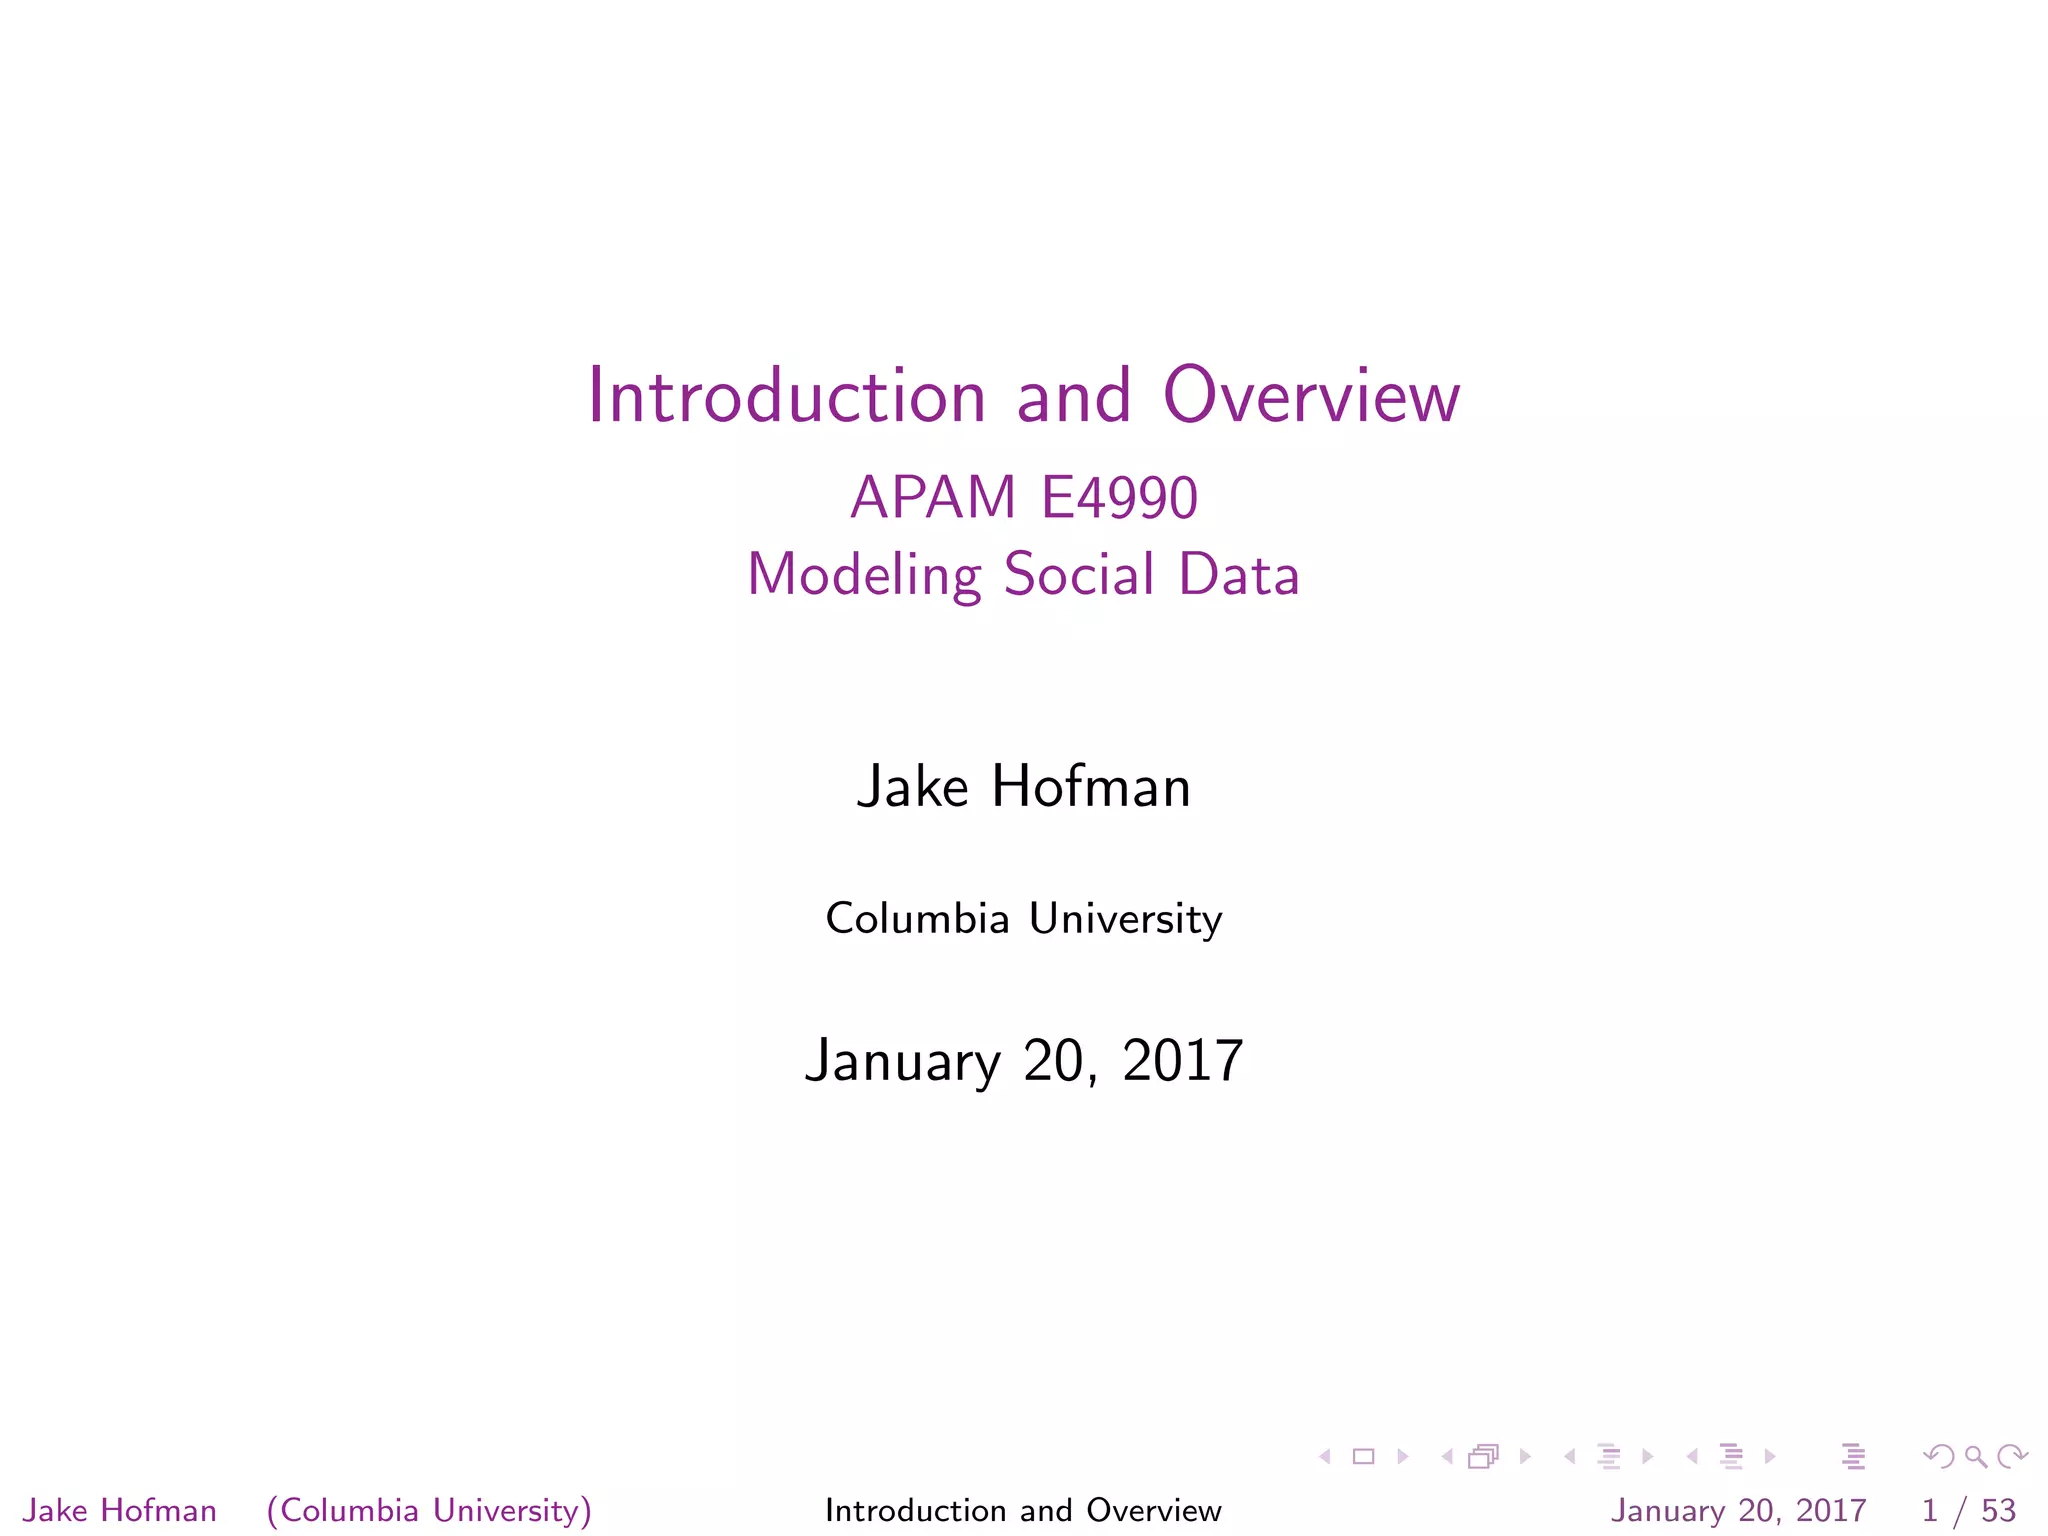
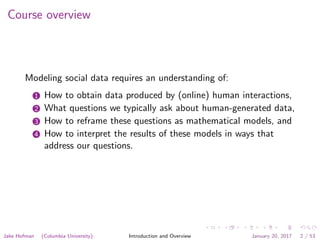
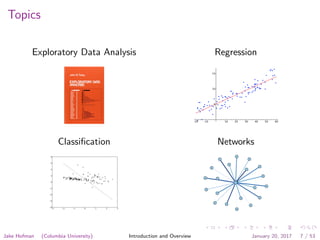
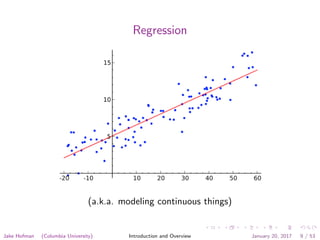
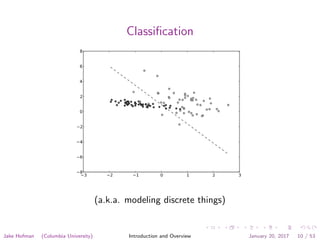
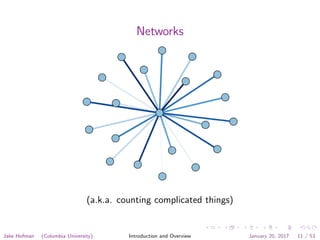
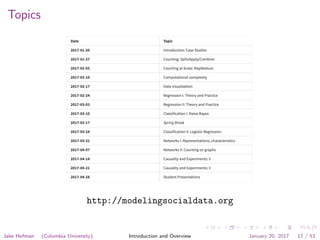
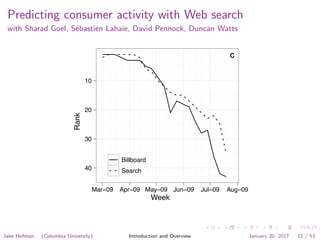
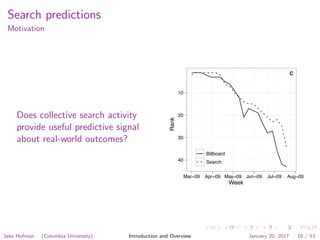
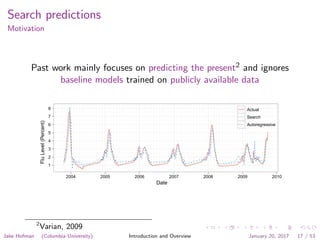
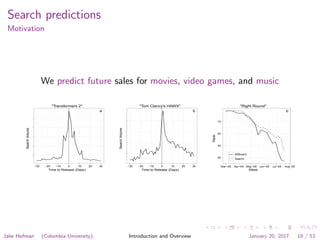
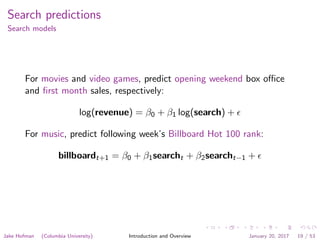
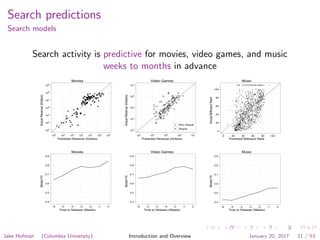
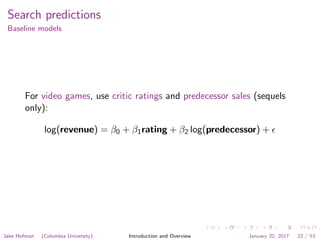
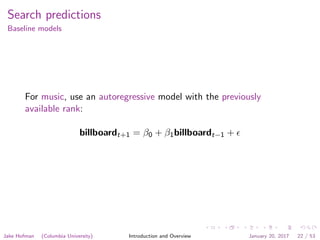
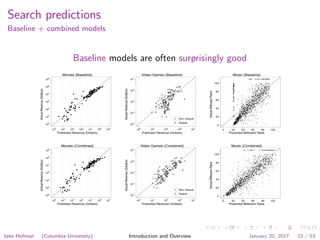
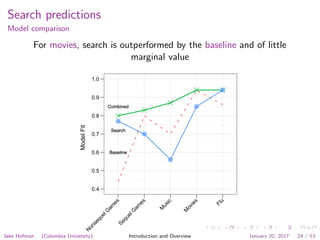
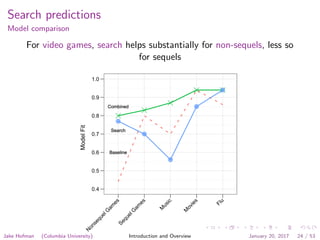
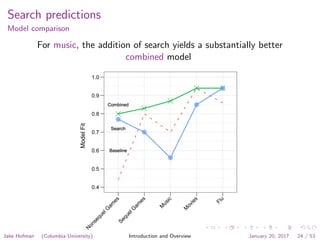
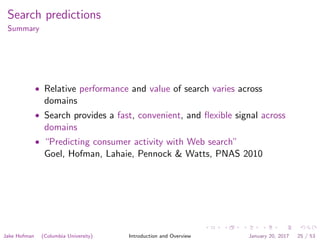
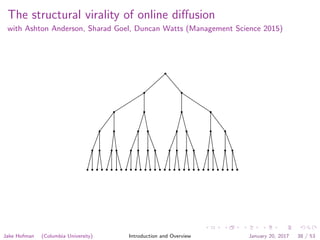
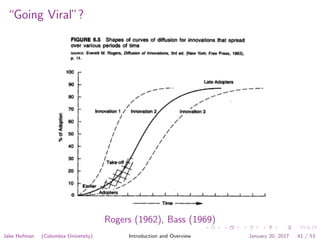
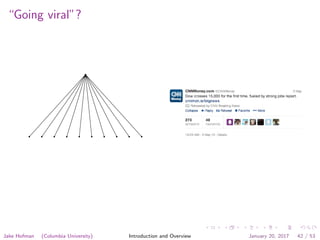
Introduction and Overview
APAM E4990
Modeling Social Data
Jake Hofman
Columbia University
January 20, 2017
Jake Hofman (Columbia University) Introduction and Overview January 20, 2017 1 / 53
Course overview
Modeling social data requires an understanding of:
1 How to obtain data produced by (online) human interactions,
2 What questions we typically ask about human-generated data,
3 How to reframe these questions as mathematical models, and
4 How to interpret the results of these models in ways that
address our questions.
Jake Hofman (Columbia University) Introduction and Overview January 20, 2017 2 / 53
Questions
Many long-standing questions in the social sciences are notoriously
difficult to answer, e.g.:
• “Who says what to whom in what channel with what effect”?
(Laswell, 1948)
• How do ideas and technology spread through cultures?
(Rogers, 1962)
• How do new forms of communication affect society?
(Singer, 1970)
• . . .
Jake Hofman (Columbia University) Introduction and Overview January 20, 2017 3 / 53
Questions
Typically difficult to observe the relevant information via
conventional methods
Moreno, 1933
Jake Hofman (Columbia University) Introduction and Overview January 20, 2017 4 / 53
Large-scale data
Recently available electronic data provide an unprecedented
opportunity to address these questions at scale
Demographic Behavioral Network
Jake Hofman (Columbia University) Introduction and Overview January 20, 2017 5 / 53
Computational social science
An emerging discipline at the intersection of the social sciences,
statistics, and computer science
Jake Hofman (Columbia University) Introduction and Overview January 20, 2017 6 / 53
Computational social science
An emerging discipline at the intersection of the social sciences,
statistics, and computer science
(motivating questions)
Jake Hofman (Columbia University) Introduction and Overview January 20, 2017 6 / 53
Computational social science
An emerging discipline at the intersection of the social sciences,
statistics, and computer science
(fitting large, potentially sparse models)
Jake Hofman (Columbia University) Introduction and Overview January 20, 2017 6 / 53
Computational social science
An emerging discipline at the intersection of the social sciences,
statistics, and computer science
(parallel processing for filtering and aggregating data)
Jake Hofman (Columbia University) Introduction and Overview January 20, 2017 6 / 53
Topics
Exploratory Data Analysis
Classification
Regression
Networks
Jake Hofman (Columbia University) Introduction and Overview January 20, 2017 7 / 53
Exploratory Data Analysis
(a.k.a. counting and plotting things)
Jake Hofman (Columbia University) Introduction and Overview January 20, 2017 8 / 53
Regression
(a.k.a. modeling continuous things)
Jake Hofman (Columbia University) Introduction and Overview January 20, 2017 9 / 53
Classification
(a.k.a. modeling discrete things)
Jake Hofman (Columbia University) Introduction and Overview January 20, 2017 10 / 53
Networks
(a.k.a. counting complicated things)
Jake Hofman (Columbia University) Introduction and Overview January 20, 2017 11 / 53
Topics
http://modelingsocialdata.org
Jake Hofman (Columbia University) Introduction and Overview January 20, 2017 12 / 53
The clean real story
“We have a habit in writing articles published in
scientific journals to make the work as finished as
possible, to cover all the tracks, to not worry about the
blind alleys or to describe how you had the wrong idea
first, and so on. So there isn’t any place to publish, in
a dignified manner, what you actually did in order to
get to do the work ...”
-Richard Feynman
Nobel Lecture1, 1965
1
http://bit.ly/feynmannobel
Jake Hofman (Columbia University) Introduction and Overview January 20, 2017 13 / 53
Outline
Web demographicsDailyPer−CapitaPageviews
0
10
20
30
40
50
60
70
q
q
q
q
q
Over $25k
Under $25k
Black
&
Hispanic
White
No College
Some College
Over 65
Under 65
Female
Male
Income Race Education Age Sex
Search predictions"Right Round"
Week
Rank
40
30
20
10
cccccccccccccccccccccccccccccccccccccccccc
Mar−09 Apr−09 May−09 Jun−09 Jul−09 Aug−09
Billboard
Search
Viral hits
Jake Hofman (Columbia University) Introduction and Overview January 20, 2017 14 / 53
Predicting consumer activity with Web search
with Sharad Goel, S´ebastien Lahaie, David Pennock, Duncan Watts
"Right Round"
Week
Rank
40
30
20
10
cccccccccccccccccccccccccccccccccccccccccc
Mar−09 Apr−09 May−09 Jun−09 Jul−09 Aug−09
Billboard
Search
Jake Hofman (Columbia University) Introduction and Overview January 20, 2017 15 / 53
Search predictions
Motivation
Does collective search activity
provide useful predictive signal
about real-world outcomes?
"Right Round"
Week
Rank
40
30
20
10
cccccccccccccccccccccccccccccccccccccccccc
Mar−09 Apr−09 May−09 Jun−09 Jul−09 Aug−09
Billboard
Search
Jake Hofman (Columbia University) Introduction and Overview January 20, 2017 16 / 53
Search predictions
Motivation
Past work mainly focuses on predicting the present2 and ignores
baseline models trained on publicly available data
Date
FluLevel(Percent)
1
2
3
4
5
6
7
8
2004 2005 2006 2007 2008 2009 2010
Actual
Search
Autoregressive
2
Varian, 2009
Jake Hofman (Columbia University) Introduction and Overview January 20, 2017 17 / 53
Search predictions
Motivation
We predict future sales for movies, video games, and music
"Transformers 2"
Time to Release (Days)
SearchVolume
a
−30 −20 −10 0 10 20 30
"Tom Clancy's HAWX"
Time to Release (Days)
SearchVolume
b
−30 −20 −10 0 10 20 30
"Right Round"
Week
Rank
40
30
20
10
cccccccccccccccccccccccccccccccccccccccccc
Mar−09 Apr−09 May−09 Jun−09 Jul−09 Aug−09
Billboard
Search
Jake Hofman (Columbia University) Introduction and Overview January 20, 2017 18 / 53
Search predictions
Search models
For movies and video games, predict opening weekend box office
and first month sales, respectively:
log(revenue) = β0 + β1 log(search) +
For music, predict following week’s Billboard Hot 100 rank:
billboardt+1 = β0 + β1searcht + β2searcht−1 +
Jake Hofman (Columbia University) Introduction and Overview January 20, 2017 19 / 53
Search predictions
Search volume
Jake Hofman (Columbia University) Introduction and Overview January 20, 2017 20 / 53
Search predictions
Search models
Search activity is predictive for movies, video games, and music
weeks to months in advance
Movies
Predicted Revenue (Dollars)
ActualRevenue(Dollars)
103
104
105
106
107
108
109
●
●
●
●
●
●
●
●
●
●
●
●
●
●
●
●
●
●
●
●
●
●
●
●
●
●
●
●
● ●
●
●
●
●
●
●
●
●
●
●
●
●
●
●
●
●
●
●
●
●
●
●
●
●
●
●
●
●
●
●
●
●●
●
●
●
●
●
●
●
●
●
●
●
●
●
●
●
●
●
● ●
●
●
●
●●
●
●
●
●
●●
●
●
●
●
●
●
●
●
●
●
●
●
●
●
●
●
●
●
●
●
●
●
●
●
aaaaaaaaaaaaaaaaaaaaaaaaaaaaaaaaaaaaaaaaaaaaaaaaaaaaaaaaaaaaaaaaaaaaaaaaaaaaaaaaaaaaaaaaaaaaaaaaaaaaaaaaaaaaaaaaaaaaaaa
103
104
105
106
107
108
109
Video Games
Predicted Revenue (Dollars)
ActualRevenue(Dollars)
103
104
105
106
107
●
●
●
●
●
●
●
●
●
●
●
●
●
●
●
●
●
●
●
●
●
●
●
●
●
●
●
●
●
●
●
●
●
●
●
●
●
●
●●
●
●
●
●
●
●
●
●
●
●
●
●
● ●
●
●
●
●
●
●
●
●
●
●
●
●
●
●
bbbbbbbbbbbbbbbbbbbbbbbbbbbbbbbbbbbbbbbbbbbbbbbbbbbbbbbbbbbbbbbbbbbbbbbbbbbbbbbbbbbbbbbbbbbbbbbbbbbbbbbbbb
103
104
105
106
107
● Non−Sequel
Sequel
Music
Predicted Billboard Rank
ActualBillboardRank
0
20
40
60
80
100
●
●
●
●
●
●
●
●
●
●
●
●
●
●
●
●
●
●
●
●
●
●
●
●
●
●
●
●
●
●
●
●
●
●
●
●
●
●
●
●
●
●
●
●
●
●
●
●
●
●
●
●
●
●
●
●
●
●
●
●
●
●
●
●
●
●
●
●
●
●
●
●
●
●
●
●
●
●
●
●
●
●
●
●
●
●
●
●
●
●
●
●
●
●
●
●
●
●
●
●
●
●
●
●
●
●
●
●
●
●
●
●
●
●
●
●
●
●
●
●
●
●
●
●
●
●
●
●
●
●
●
●
●
●
●
●
●
●
●
●
●
●
●
●
●
●
●
●
●
●
●
●
●
●
●
●
●
●
●
●
●
●
●
●
●
●
●
●
●
●
●
●
●
●
●
●
●
●
●
●
●
●
●
●
●
●
●
●
●
●
●
●
●
●
●
●
●
●
●
●
●
●
●
●
●
●
●
●
●
●
●
●
●
●
●
●
●
●
●
●
●
●
●
●
●
●
●
●
●
●
●
●
●
●
●
●
●
●
●
●
●
●
●
●
●
●
●
●
●
●
●
●
●
●
●
●
●
●
●
●
●
●
●
●
●
●
●
●
●
●
●
●
●
●
●
●
●
●
●
●
●
●
●
●
●
●
●
●
●
●
●
●
●
●
●
●
●
●
●
●
●
●
●
●
●
●
●
●
●
●
●
●
●
●
●
●
●
●
●
●
●
●
●
●
●
●
●
●
●
●
●
●
●
●
●
●
●
●
●
●
●
●
●
●
●
●
●
●
●
●
●
●
●
●
●
●
●
● ●
●
●
●
●
●
●
●
●
●
●
●
●
●
●
●
●
●
●
●
●
●
●
●
●
●
●
●
●
●
●
●
●
●
●
●
●
●
●
●
●
●
●
●
●
●
●
●
●
●
●
●
●
●
●
●
●
●
●
●
●
●
●
●
●
●
●
●
●
●
●
●
●
●
●
●
●
●
●
●
●
●
●
●
●
●
●
●
●
●
●
●
●
●
●
● ●
●
●
●
●
●
●
●
●
●
●
●
●
●
●
●
●
●
●
●
●
●
●
●
●
●
●
●
●
●
●
●
●
●
●
●
●
●
●
●
●
●
●
●
●
●
●
●
●
●
●
●
●
●
●
●
●
●
●
●
●
●
●
●
●
●
●
●
●
●
●
●
●
●
●
●
●
●
●
●
●
●
●
●
●
●
●
●
●
●
●
●
●
●
●
●
●
●
●
●
●
●
●
●
●
●
●
●
●
●
●
●
●
●
●
●
●
●
●
●
●
●
●
●
●
●
●
●
●
●
●
●
●
●
●
●
●
●
●
●
●
●
●
●
●
●
●
●
●
●
●
●
●
●
●
●
●
●
●
●
●
●
●
●
●
●
●
●
●
●
●
●
●
●
●
●
●
●
●
●
●
●
●
●
●
●
●
●
●
●
●
●
●
●
●
●
●
●
●
●
●
●
●
●
●
●
●
●
●
●
●
●
●
●
●
●
●
●
●
●
●
●
●
●
●
●
●
●
●
●
●
●
●
●
●
●
●
●
●
●
●
●
●
●
●
●
●
●
●
●
●
●
●
●
●
●
●
●
●
●
●
●
●
●
●
●
●
●
●
●
●
●
●
●
●
●
●
●
●
●
●
●
●
●
●
●
●
●
●
●
●
●
●
●
●
●
●
●
●
●
●
●
●
●
●
●
●
●
●
●
●
●
●
●
●
●
●
●
●
●
●
●
●
●
●
●
●
●
●
●
●
●
●
●
●
●
●
●
●
●
●
●
●
●
●
●
●
●
●
●
●
●
●
●
●
●
●
●
●
●
●●
●
●
●
●
●
●
●
●
●
●
●
●
●
●
●
●
●
●
●
●
●
●
●
●
●
●
●
●
●
●
●
●
●
●
●
●
●
●
●
●
●
●
●
●
●
●
●
●
●
●
●
●
●
●
●
●
●
●
●
●
●
●
●
●
●
●
●
●
●
●
●
●
●
●
●
●
●
●
●
●
●
●
●
●
●
●
●
●
●
●
●
●
●
●
●
●
●
●
●
●
●
●
●
●
●
●
●
●
●
●
●
●
●
●
●
●
●
●
●
●
●
●
●
●
●
●
●
●
●
●
●
●
●
●
●
●
●
●
●
●
●
●
●
●
●
●
●
●
●
●
●
●
●
●
●
●
●
●
●
●
●
●
●
●
●
●
●
●
●
●
●
●
●
●
●
●
●
●
●
●
●
●
●
●
c
0 20 40 60 80 100
Movies
Time to Release (Weeks)
ModelFit
0.4
0.5
0.6
0.7
0.8
0.9 ddddddd
−6 −5 −4 −3 −2 −1 0
Video Games
Time to Release (Weeks)
ModelFit
0.4
0.5
0.6
0.7
0.8
0.9 eeeeeee
−6 −5 −4 −3 −2 −1 0
Music
Time to Release (Weeks)ModelFit
0.4
0.5
0.6
0.7
0.8
0.9 fffffff
−6 −5 −4 −3 −2 −1 0
Jake Hofman (Columbia University) Introduction and Overview January 20, 2017 21 / 53
Search predictions
Baseline models
For movies, use budget, number of opening screens and Hollywood
Stock Exchange:
log(revenue) = β0 + β1 log(budget) + β2 log(screens) +
β3 log(hsx) +
Jake Hofman (Columbia University) Introduction and Overview January 20, 2017 22 / 53
Search predictions
Baseline models
For video games, use critic ratings and predecessor sales (sequels
only):
log(revenue) = β0 + β1rating + β2 log(predecessor) +
Jake Hofman (Columbia University) Introduction and Overview January 20, 2017 22 / 53
Search predictions
Baseline models
For music, use an autoregressive model with the previously
available rank:
billboardt+1 = β0 + β1billboardt−1 +
Jake Hofman (Columbia University) Introduction and Overview January 20, 2017 22 / 53
Search predictions
Baseline + combined models
Baseline models are often surprisingly good
Movies (Baseline)
Predicted Revenue (Dollars)
ActualRevenue(Dollars)
103
104
105
106
107
108
109
●
●
●
●
●
●
●
●
●
●
●
●
●
●
●
●
●
●
●
●
●
●
●
●
●
●
●
●
● ●
●
●
●
●
●
●
●
●
●
●
●
●
●
●
●
●
●
●
●
●
●
●
●
●
●
●
●
●
●
●
●
● ●
●
●
●
●
●
●
●
●
●
●
●
●
●
●
●
●
●
●
● ●
●
●
●
●●
●
●
●
●
●●
●
●
●
●
●
●
●
●
●
●
●
●
●
●
●
●
●
●
●
●
●
●
●
●
aaaaaaaaaaaaaaaaaaaaaaaaaaaaaaaaaaaaaaaaaaaaaaaaaaaaaaaaaaaaaaaaaaaaaaaaaaaaaaaaaaaaaaaaaaaaaaaaaaaaaaaaaaaaaaaaaaaaaaa
103
104
105
106
107
108
109
Video Games (Baseline)
Predicted Revenue (Dollars)
ActualRevenue(Dollars)
103
104
105
106
107
●
●
●
●
●
●
●
●
●
●
●
●
●
●
●
●
●
●
●
●
●
●
●
●
●
●
●
●
●
●
●
●
●
●
●
●
●
●
●●
●
●
●
●
●
●
●
●
●
●
●
●
●●
●
●
●
●
●
●
●
●
●
●
●
●
●
●
bbbbbbbbbbbbbbbbbbbbbbbbbbbbbbbbbbbbbbbbbbbbbbbbbbbbbbbbbbbbbbbbbbbbbbbbbbbbbbbbbbbbbbbbbbbbbbbbbbbbbbbbbb
103
104
105
106
107
● Non−Sequel
Sequel
Music (Baseline)
Predicted Billboard Rank
ActualBillboardRank
0
20
40
60
80
100
●
●
●
●
●
●
●
●
●
●
●
●
●
●
●
●
●
●
●
●
●
●
●
●
●
●
●
●
●
●
●
●
●
●
●
●
●
●
●
●
●
●
●
●
●
●
●
●
●
●
●
●
●
●
●
●
●
●
●
●
●
●
●
●
●
●
●
●
●
●
●
●
●
●
●
●
●
●
●
●
●
●
●
●
●
●
●
●
●
●
●
●
●
●
●
●
●
●
●
●
●
●
●
●
●
●
●
●
●
●
●
●
●
●
●
●
●
●
●
●
●
●
●
●
●
●
●
●
●
●
●
●
●
●
●
●
●
●
●
●
●
●
●
●
●
●
●
●
●
●
●
●
●
●
●
●
●
●
●
●
●
●
●
●
●
●
●
●
●
●
●
●
●
●
●
●
●
●
●
●
●
●
●
●
●
●
●
●
●
●
●
●
●
●
●
●
●
●
●
●
●
●
●
●
●
●
●
●
●
●
●
●
●
●
●
●
●
●
●
●
●
●
●
●
●
●
●
●
●
●
●
●
●
●
●
●
●
●
●
●
●
●
●
●
●
●
●
●
●
●
●
●
●
●
●
●
●
●
●
●
●
●
●
●
●
●
●
●
●
●
●
●
●
●
●
●
●
●
●
●
●
●
●
●
●
●
●
●
●●
●
●
●
●
●
●
●
●
●
●
●
●
●
●
●
●
●
●
●
●
●
●
●
●
●
●
●
●
●
●
●
●
●
●
●
●
●
●
●
●
●
●
●
●
●
●
●
●
●
●
●
●
●
●
●
●
●
●
●
●
●
●
●
●
●
●
●
●
●
●
●
●
●
●
●
●
●
●
●
●
●
●
●
●
●
●
●
●
●
●
●
●
●
●
●
●
●
●
●
●
●
●
●
●
●
●
●
●
●
●
●
●
●
●
●
●
●
●
●
●
●
●
●
●
●
●
●
●
●
●
●
●
●
●
●
●
●
●
●
●
●
●
●
● ●
●
●
●
●
●
●
●
●
●
●
●
●
●
●
●
●
●
●
●
●
●
●
●
●
●
●
●
●
●
●
●
●
●
●
●
●
●
●
●
●
●
●
●
●
●
●
●
●
●
●
●
●
●
●
●
●
●
●
●
●
●
●●
●
●
●
●
●
●
●
●
●
●
●
●
●
●
●
●
●
●
●
●
●
●
●
●
●
●
●
●
●
●
●
●
●
●
●
●
●
●
●
●
●
●
●
●
●
●
●
●
●
●
●
●
●
●
●
●
●
●
●
●
●
●
●
●
●
●
●
●
●
●
●
●
●
●
●
●
●
●
●
●
●
●
●
●
●
●
●
●
●
●
●
●
●
●
●
●
●
●
●
●
●
●
●
●
●
●
●
●
●
●
●
●
●
●
●
●
●
●
●
●
●
●
●
●
●
●
●
●
●
●
●
●
●
●
●
●
●
●
●
●
●
●
●
●
●
●
●
●
●
●
●
●
●
●
●
●
●
●
●
●
●
●
●
●
●
●
●
●
●
●
●
●
●
●
●
●
●
●
●
●
●
●
●
●
●
●
●
●
●
●
●
●
●
●
●
●
●
●
●
●
●
●
●
●
●
●
●
●
●
●
●
●
●
●
●
●
●
●
●
●
●
●
●
●
●
●
●
●
●
●
●
●
●
●
●
●
●
●
●
●
●
●
●
●
●
●
●
●
●
●
●
●
●
●
●
●
●
●
●
●
●
●
●
●
●
●
●
●
●
●
●
●
●
●
●
●
●
●
●
●
●
●
●
●
●
●
●
●
●
●
●
●
●
●
●
●
●
●
●
●
●
●
●
●
●
●
●
●
●
●
●
●
●
●
●
●
●
●
●
●
●
●
●
●
●
●
●
●
●
●
●
●
●
●
●
●
●
●
●
●
●
●
●
●
●
●●
●
●
●
●
●
●
●
●
●
●
●
●
●
●
●
●
●
●
●
●
●
●
●
●
●
●
●
●
●
●
●
●
●
●
●
●
●
●
●
●
●
●
●
●
●
●
●●
●
●
●
●
●
●
●
●
●
●
●
●
●
●
●
●
●
●
●
●
●
●
●
●
●
●
●
●
●
●
●
●
●
●
●
●
●
●
●
●
●
●
●
●
●
●
●
●
●
●
●
●
●
●
●
●
●
●
●
●
●
●
●
●
●
●
●
●
●
●
●
●
●
●
●
●
●
●
●
●
●
●
●●
●
●
●
●
●
●
●
●
●
●
●
●
●
●
●
●●
●
●
●
●
●
●
●
●
●
●
●
●
●
●
●
●
●
●
●
●
●
●
●
●
●
●
●
●
●
●
●
●
●
●
●
●
●
●
●
●
●
●
●
●
●
●
●
●
●
●
●
●
●
●
●
●
●
●
●
●
●
●
●
●
●
●
●
●
●
●
●
●
●
●
●
●
●
●
●
●
●
●
●
●
●
●
●
●
●
●
●
●
●
●
●
●
●
●
●
●
●
●
●
●
●
●
c
0 20 40 60 80 100
Movies (Combined)
Predicted Revenue (Dollars)
ActualRevenue(Dollars)
103
104
105
106
107
108
109
●
●
●
●
●
●
●
●
●
●
●
●
●
●
●
●
●
●
●
●
●
●
●
●
●
●
●
●
● ●
●
●
●
●
●
●
●
●
●
●
●
●
●
●
●
●
●
●
●
●
●
●
●
●
●
●
●
●
●
●
●
●●
●
●
●
●
●
●
●
●
●
●
●
●
●
●
●
●
●
●
● ●
●
●
●
●●
●
●
●
●
●●
●
●
●
●
●
●
●
●
●
●
●
●
●
●
●
●
●
●
●
●
●
●
●
●
ddddddddddddddddddddddddddddddddddddddddddddddddddddddddddddddddddddddddddddddddddddddddddddddddddddddddddddddddddddddd
103
104
105
106
107
108
109
Video Games (Combined)
Predicted Revenue (Dollars)
ActualRevenue(Dollars)
103
104
105
106
107
●
●
●
●
●
●
●
●
●
●
●
●
●
●
●
●
●
●
●
●
●
●
●
●
●
●
●
●
●
●
●
●
●
●
●
●
●
●
●●
●
●
●
●
●
●
●
●
●
●
●
●
●●
●
●
●
●
●
●
●
●
●
●
●
●
●
●
eeeeeeeeeeeeeeeeeeeeeeeeeeeeeeeeeeeeeeeeeeeeeeeeeeeeeeeeeeeeeeeeeeeeeeeeeeeeeeeeeeeeeeeeeeeeeeeeeeeeeeeeee
103
104
105
106
107
● Non−Sequel
Sequel
Music (Combined)
Predicted Billboard Rank
ActualBillboardRank
0
20
40
60
80
100
●
●
●
●
●
●
●
●
●
●
●
●
●
●
●
●
●
●
●
●
●
●
●
●
●
●
●
●
●
●
●
●
●
●
●
●
●
●
●
●
●
●
●
●
●
●
●
●
●
●
●
●
●
●
●
●
●
●
●
●
●
●
●
●
●
●
●
●
●
●
●
●
●
●
●
●
●
●
●
●
●
●
●
●
●
●
●
●
●
●
●
●
●
●
●
●
●
●
●
●
●
●
●
●
●
●
●
●
●
●
●
●
●
●
●
●
●
●
●
●
●
●
●
●
●
●
●
●
●
●
●
●
●
●
●
●
●
●
●
●
●
●
●
●
●
●
●
●
●
●
●
●
●
●
●
●
●
●
●
●
●
●
●
●
●
●
●
●
●
●
●
●
●
●
●
●
●
●
●
●
●
●
●
●
●
●
●
●
●
●
●
●
●
●
●
●
●
●
●
●
●
●
●
●
●
●
●
●
●
●
●
●
●
●
●
●
●
●
●
●
●●
●
●
●
●
●
●
●
●
●
●
●
●
●
●
●
●
●
●
●
●
●
●
●
●
●
●
●
●
●
●
●
●
●
●
●
●
●
●
●
●
●
●
●
●
●
●
●
●
●
●
●
●
●
●
●
●
●
●
●
●
●
●
●
●
●
●
●
●
●
●
●
●
●
●
●
●
●
●
●
●
●
●
●
●
●
●
●
●
●
●
●
●
●
●
●
●
●
●
●
●
●
●
●
●
●
●
●
●
●
●
●
●
●
●
●
●
●
●
●
●
●
●
●
●
●
●
●
●
●
●
●
●
●
● ●
●
●
●
●
●
●
●
●
●
●
●
●
●
●
●
●
●
●●
●
●
●
●
●
●
●
●
●
●
●
●
●
●
●
●
●
●
●
●
●
●
●
●
●
●
●
●
●
●
●
●
●
●
●
●
●
●
●
●
●
●
●
●
●
●
●
●
●
●
●
●
●
●
●
●
●
●
●
●
●
●
●
●
●
●
●
●
●
●
●
●
●
●
●
●●
●
●
●
●
●
●
●
●
●
●
●
●
●
●
●
●
●
●
●
●
●
●
●
●
●
●
●
●
●
●
●
●
●
●
●
●
●
●
●
●
●
●
●
●
●
●
●
●
●
●
●
●
●
●
●
●
●
●
●
●
●
●
●
●
●
●
●
●
●
●
●
●
●
●
●
●
●
●
●
●
●
●
●
●
●
●
●
●
●
●
●
●
●
●
●
●
●
●
●
●
●
●
●
●
●
●
●
●
●
●
●
●
●
●
●
●
●
●
●
●
●
●
●
●
●
●
●
●
●
●
●
●
●
●
●
●
●
●
●
●
●
●
●
●
●
●
●
●
●
●
●
●
●
●
●
●
●
●
●
●
●
●
●
●
●
●
●
●
●
●
●
●
●
●
●
●
●
●
●
●
●
●
●
●
●
●
●
●
●
●
●
●
●
●
●
●
●
●
●
●
●
●
●
●
●
●
●
●
●
●
●
●
●
●
●
●
●
●
●
●
●
●
●
●
●
●
●
●
●
●
●
●
●
●
●
●
●
●
●
●
●
●
●
●
●
●
●
●
●
●
●
●
●
●
●
●
●
●
●
●
●
●
●
●
●
●
●
●
●
●
●
●
●
●
●
●
●
●
●
●
●
●
●
●
●
●
●
●
●
●
●
●
●
●
●
●
●
●
●
●
●
●
●
●
●
●
●
●
●
●
●
●
●
●
●
●
●
●
●
●
●
●
●
●
●
●
●
●
●
●
●
●
●
●
●
●
●
●
●
●
●
●
●
●
●
●
●
●
●
●
●
●
●
●
●
●
●
●
●●
●
●
●
●
●
●
●
●
●
●
●
●
●
●
●
●
●
●
●
●
●
●
●
●
●
●
●
●
●
●
●
●
●
●
●
●
●
●
●
●
●
●
●
●
●
●
●
●
●
●
●
●
●
●
●
●
●
●
●
●
●
●
●
●
●
●
●
●
●
●
●
●
●
●
●
●
●
●
●
●
●
●
●
●
●
●
●
●
●
●
●
●
●
●
●
●
●
●
●
●
●
●
●
●
●
●
●
●
●
●
●
●
●
●
●
●
●
●
●
●
●
●
●
●
●
●
●
●
●
●
●
●
●
●
●
●
●
●
●
●
●
●
●
●
●
●
●
●
●
●
●
●
●
●
●
●
●
●
●
●
●
●
●
●
●
●
●
●
●
●
●
●
●
●
●
●
●
●
●
●
●
●
●
●
f
0 20 40 60 80 100
Jake Hofman (Columbia University) Introduction and Overview January 20, 2017 23 / 53
Search predictions
Model comparison
For movies, search is outperformed by the baseline and of little
marginal value
ModelFit
0.4
0.5
0.6
0.7
0.8
0.9
1.0
CombinedCombinedCombinedCombinedCombinedCombinedCombinedCombinedCombinedCombinedCombinedCombinedCombinedCombinedCombined
SearchSearchSearchSearchSearchSearchSearchSearchSearchSearchSearchSearchSearchSearchSearch
BaselineBaselineBaselineBaselineBaselineBaselineBaselineBaselineBaselineBaselineBaselineBaselineBaselineBaselineBaseline
N
onsequelG
am
es
SequelG
am
es
M
usic
M
ovies
Flu
Jake Hofman (Columbia University) Introduction and Overview January 20, 2017 24 / 53
Search predictions
Model comparison
For video games, search helps substantially for non-sequels, less so
for sequels
ModelFit
0.4
0.5
0.6
0.7
0.8
0.9
1.0
CombinedCombinedCombinedCombinedCombinedCombinedCombinedCombinedCombinedCombinedCombinedCombinedCombinedCombinedCombined
SearchSearchSearchSearchSearchSearchSearchSearchSearchSearchSearchSearchSearchSearchSearch
BaselineBaselineBaselineBaselineBaselineBaselineBaselineBaselineBaselineBaselineBaselineBaselineBaselineBaselineBaseline
N
onsequelG
am
es
SequelG
am
es
M
usic
M
ovies
Flu
Jake Hofman (Columbia University) Introduction and Overview January 20, 2017 24 / 53
Search predictions
Model comparison
For music, the addition of search yields a substantially better
combined model
ModelFit
0.4
0.5
0.6
0.7
0.8
0.9
1.0
CombinedCombinedCombinedCombinedCombinedCombinedCombinedCombinedCombinedCombinedCombinedCombinedCombinedCombinedCombined
SearchSearchSearchSearchSearchSearchSearchSearchSearchSearchSearchSearchSearchSearchSearch
BaselineBaselineBaselineBaselineBaselineBaselineBaselineBaselineBaselineBaselineBaselineBaselineBaselineBaselineBaseline
N
onsequelG
am
es
SequelG
am
es
M
usic
M
ovies
Flu
Jake Hofman (Columbia University) Introduction and Overview January 20, 2017 24 / 53
Search predictions
Summary
• Relative performance and value of search varies across
domains
• Search provides a fast, convenient, and flexible signal across
domains
• “Predicting consumer activity with Web search”
Goel, Hofman, Lahaie, Pennock & Watts, PNAS 2010
Jake Hofman (Columbia University) Introduction and Overview January 20, 2017 25 / 53
Demographic diversity on the Web
with Irmak Sirer and Sharad Goel (ICWSM 2012)
DailyPer−CapitaPageviews
0
10
20
30
40
50
60
70
q
q
q
q
q
Over $25k
Under $25k
Black
&
Hispanic
White
No College
Some College
Over 65
Under 65
Female
Male
Income Race Education Age Sex
Jake Hofman (Columbia University) Introduction and Overview January 20, 2017 26 / 53
Motivation
Previous work is largely survey-based and focuses and group-level
differences in online access
Jake Hofman (Columbia University) Introduction and Overview January 20, 2017 27 / 53
Motivation
“As of January 1997, we estimate that 5.2 million
African Americans and 40.8 million whites have ever used
the Web, and that 1.4 million African Americans and
20.3 million whites used the Web in the past week.”
-Hoffman & Novak (1998)
Jake Hofman (Columbia University) Introduction and Overview January 20, 2017 27 / 53
Motivation
Focus on activity instead of access
How diverse is the Web?
To what extent do online experiences vary across demographic
groups?
Jake Hofman (Columbia University) Introduction and Overview January 20, 2017 28 / 53
Data
• Representative sample of 265,000 individuals in the US, paid
via the Nielsen MegaPanel3
• Log of anonymized, complete browsing activity from June
2009 through May 2010 (URLs viewed, timestamps, etc.)
• Detailed individual and household demographic information
(age, education, income, race, sex, etc.)
3
Special thanks to Mainak Mazumdar
Jake Hofman (Columbia University) Introduction and Overview January 20, 2017 29 / 53
Data
# ls -alh nielsen_megapanel.tar
-rw-r--r-- 100G Jul 17 13:00 nielsen_megapanel.tar
Jake Hofman (Columbia University) Introduction and Overview January 20, 2017 30 / 53
Data
# ls -alh nielsen_megapanel.tar
-rw-r--r-- 100G Jul 17 13:00 nielsen_megapanel.tar
• Normalize pageviews to at most three domain levels, sans www
e.g. www.yahoo.com → yahoo.com,
us.mg2.mail.yahoo.com/neo/launch → mail.yahoo.com
• Restrict to top 100k (out of 9M+ total) most popular sites
(by unique visitors)
• Aggregate activity at the site, group, and user levels
Jake Hofman (Columbia University) Introduction and Overview January 20, 2017 30 / 53
Aggregate usage patterns
How do users distribute their time across different categories?
Fractionoftotalpageviews
0.05
0.10
0.15
0.20
0.25
q
q
q
q q
SocialM
edia
E−m
ail
G
am
es
Portals
Search
All groups spend the majority of their time in the top five most
popular categories
Jake Hofman (Columbia University) Introduction and Overview January 20, 2017 31 / 53
Aggregate usage patterns
How do users distribute their time across different categories?
User Rank by Daily Activity
FractionofPageviewsinCategory
0.05
0.10
0.15
0.20
0.25
0.30
q
q q q q
q
q
q
q
q
10% 30% 50% 70% 90%
q Social Media
E−mail
Games
Portals
Search
Highly active users devote nearly twice as much of their time to
social media relative to typical individuals
Jake Hofman (Columbia University) Introduction and Overview January 20, 2017 31 / 53
Group-level activity
How does browsing activity vary at the group level?
DailyPer−CapitaPageviews
0
10
20
30
40
50
60
70
q
q
q
q
q
Over $25k
Under $25k
Black
&
Hispanic
White
No College
Some College
Over 65
Under 65
Female
Male
Income Race Education Age Sex
Large differences exist even at the aggregate level
(e.g. women on average generate 40% more pageviews than men)
Jake Hofman (Columbia University) Introduction and Overview January 20, 2017 32 / 53
Group-level activity
How does browsing activity vary at the group level?
DailyPer−CapitaPageviews
0
10
20
30
40
50
60
70
q
q
q
q
q
Over $25k
Under $25k
Black
&
Hispanic
White
No College
Some College
Over 65
Under 65
Female
Male
Income Race Education Age Sex
Younger and more educated individuals are both more likely to
access the Web and more active once they do
Jake Hofman (Columbia University) Introduction and Overview January 20, 2017 32 / 53
Group-level activity
All demographic groups spend the majority of their time in the
same categories
Age
Fractionoftotalpageviews
0.0
0.1
0.2
0.3
0.4
0.5
q
q
q
q
q
q
q q
q
q
q
q
q
q
q q
5 10 15 20 25 30 35 40 45 50 55 60 65 70 75 80
q Social Media
E−mail
Games
Portals
Search
Fractionoftotalpageviews
0.0
0.1
0.2
0.3
0.4
Education
● ●
●
●
●
●
●
G
ram
m
arSchool
Som
e
H
ig
h
School
H
ig
h
SchoolG
raduate
Som
e
C
ollege
Associa
te
D
egree
Bachelo
r's
D
egree
PostG
raduate
D
egree
Sex
●
●
Fem
ale
M
ale
Income
●
● ●
●
●
●
$0−25k
$25−50k
$50−75k
$75−100k
$100−150k
$150k+
Race
● ●
● ●
●
O
ther
H
is
panic
Bla
ck
W
hite
Asia
n
Jake Hofman (Columbia University) Introduction and Overview January 20, 2017 33 / 53
Group-level activity
Older, more educated, male, wealthier, and Asian Internet users
spend a smaller fraction of their time on social media
Age
Fractionoftotalpageviews
0.0
0.1
0.2
0.3
0.4
0.5
q
q
q
q
q
q
q q
q
q
q
q
q
q
q q
5 10 15 20 25 30 35 40 45 50 55 60 65 70 75 80
q Social Media
E−mail
Games
Portals
Search
Fractionoftotalpageviews
0.0
0.1
0.2
0.3
0.4
Education
● ●
●
●
●
●
●
G
ram
m
arSchool
Som
e
H
ig
h
School
H
ig
h
SchoolG
raduate
Som
e
C
ollege
Associa
te
D
egree
Bachelo
r's
D
egree
PostG
raduate
D
egree
Sex
●
●
Fem
ale
M
ale
Income
●
● ●
●
●
●
$0−25k
$25−50k
$50−75k
$75−100k
$100−150k
$150k+
Race
● ●
● ●
●
O
ther
H
is
panic
Bla
ck
W
hite
Asia
n
Jake Hofman (Columbia University) Introduction and Overview January 20, 2017 33 / 53
Group-level activity
Lower social media use by these groups is often accompanied by
higher e-mail volume
Age
Fractionoftotalpageviews
0.0
0.1
0.2
0.3
0.4
0.5
q
q
q
q
q
q
q q
q
q
q
q
q
q
q q
5 10 15 20 25 30 35 40 45 50 55 60 65 70 75 80
q Social Media
E−mail
Games
Portals
Search
Fractionoftotalpageviews
0.0
0.1
0.2
0.3
0.4
Education
● ●
●
●
●
●
●
G
ram
m
arSchool
Som
e
H
ig
h
School
H
ig
h
SchoolG
raduate
Som
e
C
ollege
Associa
te
D
egree
Bachelo
r's
D
egree
PostG
raduate
D
egree
Sex
●
●
Fem
ale
M
ale
Income
●
● ●
●
●
●
$0−25k
$25−50k
$50−75k
$75−100k
$100−150k
$150k+
Race
● ●
● ●
●
O
ther
H
is
panic
Bla
ck
W
hite
Asia
n
Jake Hofman (Columbia University) Introduction and Overview January 20, 2017 33 / 53
Revisiting the digital divide
How does usage of news, health, and reference vary with
demographics?
Averagepageviewspermonth
0
2
4
6
8
10
12
Education
●
●
●
● ●
●
●
G
ram
m
arSchool
Som
e
H
ig
h
School
H
ig
h
SchoolG
raduate
Som
e
C
ollege
Associa
te
D
egree
Bachelo
r's
D
egree
PostG
raduate
D
egree
Sex
●
●
Fem
ale
M
ale
Income
● ● ●
●
●
●
$0−25k
$25−50k
$50−75k
$75−100k
$100−150k
$150k+
Race
● ●
●
●
●
O
ther
H
is
panic
Bla
ck
W
hite
Asia
n
● News
Health
Reference
Post-graduates spend three times as much time on health sites
than adults with only some high school education
Jake Hofman (Columbia University) Introduction and Overview January 20, 2017 34 / 53
Revisiting the digital divide
How does usage of news, health, and reference vary with
demographics?
Averagepageviewspermonth
0
2
4
6
8
10
12
Education
●
●
●
● ●
●
●
G
ram
m
arSchool
Som
e
H
ig
h
School
H
ig
h
SchoolG
raduate
Som
e
C
ollege
Associa
te
D
egree
Bachelo
r's
D
egree
PostG
raduate
D
egree
Sex
●
●
Fem
ale
M
ale
Income
● ● ●
●
●
●
$0−25k
$25−50k
$50−75k
$75−100k
$100−150k
$150k+
Race
● ●
●
●
●
O
ther
H
is
panic
Bla
ck
W
hite
Asia
n
● News
Health
Reference
Asians spend more than 50% more time browsing online news than
do other race groups
Jake Hofman (Columbia University) Introduction and Overview January 20, 2017 34 / 53
Revisiting the digital divide
How does usage of news, health, and reference vary with
demographics?
Averagepageviewspermonth
0
2
4
6
8
10
12
Education
●
●
●
● ●
●
●
G
ram
m
arSchool
Som
e
H
ig
h
School
H
ig
h
SchoolG
raduate
Som
e
C
ollege
Associa
te
D
egree
Bachelo
r's
D
egree
PostG
raduate
D
egree
Sex
●
●
Fem
ale
M
ale
Income
● ● ●
●
●
●
$0−25k
$25−50k
$50−75k
$75−100k
$100−150k
$150k+
Race
● ●
●
●
●
O
ther
H
is
panic
Bla
ck
W
hite
Asia
n
● News
Health
Reference
Even when less educated and less wealthy groups gain access to
the Web, they utilize these resources relatively infrequently
Jake Hofman (Columbia University) Introduction and Overview January 20, 2017 34 / 53
Revisiting the digital divide
How does usage of news, health, and reference vary with
demographics?
Averagepageviewspermonth
0
2
4
6
8
10
12
News
q
q q
q
q
H
ig
h
SchoolG
raduate
Som
e
C
ollege
Associa
te
D
egree
Bachelo
r's
D
egreePostG
raduate
D
egree
Health
q
q q
q q
H
ig
h
SchoolG
raduate
Som
e
C
ollege
Associa
te
D
egree
Bachelo
r's
D
egreePostG
raduate
D
egree
Reference
q
q q
q q
H
ig
h
SchoolG
raduate
Som
e
C
ollege
Associa
te
D
egree
Bachelo
r's
D
egreePostG
raduate
D
egree
Asian
Black
Hispanic
White
Controlling for other variables, effects of race and gender largely
disappear, while education continues to have large effect
pi =
j
αj xij +
j k
βjkxij xik +
j
γj x2
ij + i
Jake Hofman (Columbia University) Introduction and Overview January 20, 2017 35 / 53
Revisiting the digital divide
How does usage of news, health, and reference vary with
demographics?
Averagepageviewspermonth
0
2
4
6
8
10
12
Health
q
q q
q q
H
igh
SchoolG
raduate
Som
e
C
ollegeAssociate
D
egreeBachelor's
D
egree
PostG
raduate
D
egree
Female
Male
However, women spend considerably more time on health sites
compared to men
Jake Hofman (Columbia University) Introduction and Overview January 20, 2017 36 / 53
Revisiting the digital divide
How does usage of news, health, and reference vary with
demographics?
Monthly pageviews on health sites
20 40 60 80 100
Female
Male
However, women spend considerably more time on health sites
compared to men, although means can be misleading
Jake Hofman (Columbia University) Introduction and Overview January 20, 2017 36 / 53
Summary
• Highly active users spend disproportionately more of their
time on social media and less on e-mail relative to the overall
population
• Access to research, news, and healthcare is strongly related to
education, not as closely to ethnicity
• User demographics can be inferred from browsing activity with
reasonable accuracy
• “Who Does What on the Web”, Goel, Hofman & Sirer,
ICWSM 2012
Jake Hofman (Columbia University) Introduction and Overview January 20, 2017 37 / 53
The structural virality of online diffusion
with Ashton Anderson, Sharad Goel, Duncan Watts (Management Science 2015)
Jake Hofman (Columbia University) Introduction and Overview January 20, 2017 38 / 53
“Going Viral”?
Jake Hofman (Columbia University) Introduction and Overview January 20, 2017 39 / 53
“Going Viral”?
Jake Hofman (Columbia University) Introduction and Overview January 20, 2017 40 / 53
“Going Viral”?
“Therefore we ... wish to proceed with great care as is
proper, and to cut off the advance of this plague and
cancerous disease so it will not spread any further ...”4
-Pope Leo X
Exsurge Domine (1520)
4
http://www.economist.com/node/21541719
Jake Hofman (Columbia University) Introduction and Overview January 20, 2017 40 / 53
“Going Viral”?
Rogers (1962), Bass (1969)
Jake Hofman (Columbia University) Introduction and Overview January 20, 2017 41 / 53
“Going viral”?
Jake Hofman (Columbia University) Introduction and Overview January 20, 2017 42 / 53
“Going viral”?
Jake Hofman (Columbia University) Introduction and Overview January 20, 2017 42 / 53
“Going viral”?
How do popular things become popular?
Jake Hofman (Columbia University) Introduction and Overview January 20, 2017 43 / 53
Data
• Examined one year of tweets from July 2011 to July 2012
Jake Hofman (Columbia University) Introduction and Overview January 20, 2017 44 / 53
Data
• Examined one year of tweets from July 2011 to July 2012
• Restricted to 1.4 billion tweets containing links to top news,
videos, images, and petitions sites
Jake Hofman (Columbia University) Introduction and Overview January 20, 2017 44 / 53
Data
• Examined one year of tweets from July 2011 to July 2012
• Restricted to 1.4 billion tweets containing links to top news,
videos, images, and petitions sites
• Aggregated tweets by URL, resulting in 1 billion distinct
“events”
• Crawled friend list of each adopter
• Inferred “who got what from whom” to construct diffusion
trees
• Characterized size and structure of trees
Jake Hofman (Columbia University) Introduction and Overview January 20, 2017 44 / 53
The Structural Virality of Online Diffusion
A
B
D
C
E
Time
Jake Hofman (Columbia University) Introduction and Overview January 20, 2017 45 / 53
Information diffusion
Cascade size distribution
0.00001%
0.0001%
0.001%
0.01%
0.1%
1%
10%
1 10 100 1,000 10,000
Cascade Size
CCDF
Focus on the rare hits that get at least 100 adoptions
Jake Hofman (Columbia University) Introduction and Overview January 20, 2017 46 / 53
Quantifying structure
Measure the average distance between all pairs of nodes5
5
Weiner (1947); correlated with other possible metrics
Jake Hofman (Columbia University) Introduction and Overview January 20, 2017 47 / 53
Information diffusion
Size and virality by category
Remarkable structural diversity across across categories
0.001%
0.01%
0.1%
1%
10%
100%
100 1,000 10,000
Cascade Size
CCDF
Videos
Pictures
News
Petitions
0.001%
0.01%
0.1%
1%
10%
100%
3 10 30
Structural Virality
CCDF
Videos
Pictures
News
Petitions
Jake Hofman (Columbia University) Introduction and Overview January 20, 2017 48 / 53
Information diffusion
Structural diversity
0 50 100 150
time
size
0 5 10 15 20
time
size
0 20 40 60 80 100 120 140
time
size
0 20 40 60 80 100 120
time
size
0.0 0.5 1.0 1.5
time
size
0 10 20 30 40 50 60 70
time
size
Jake Hofman (Columbia University) Introduction and Overview January 20, 2017 49 / 53
Information diffusion
Structural diversity
Size is relatively poor predictive of structure
Jake Hofman (Columbia University) Introduction and Overview January 20, 2017 50 / 53
Summary
Popular = Viral
Jake Hofman (Columbia University) Introduction and Overview January 20, 2017 51 / 53
Information diffusion
Summary
• Most cascades fail, resulting in fewer than two adoptions, on
average
• Of the hits that do succeed, we observe a wide range of
diverse diffusion structures
• It’s difficult to say how something spread given only its
popularity
• “The structural virality of online diffusion”, Anderson, Goel,
Hofman & Watts (Management Science 2015)
Jake Hofman (Columbia University) Introduction and Overview January 20, 2017 52 / 53
1. Ask good questions
There’s nothing interesting in the data without them
Jake Hofman (Columbia University) Introduction and Overview January 20, 2017 53 / 53
2. Think before you code
5 minutes at the whiteboard is worth an hour at the keyboard
Jake Hofman (Columbia University) Introduction and Overview January 20, 2017 53 / 53
3. Keep the answers simple
Exploratory data analysis and linear models go a long way
Jake Hofman (Columbia University) Introduction and Overview January 20, 2017 53 / 53

Modeling Social Data, Lecture 1: Overview

  • 1.
    Introduction and Overview APAME4990 Modeling Social Data Jake Hofman Columbia University January 20, 2017 Jake Hofman (Columbia University) Introduction and Overview January 20, 2017 1 / 53
  • 2.
    Course overview Modeling socialdata requires an understanding of: 1 How to obtain data produced by (online) human interactions, 2 What questions we typically ask about human-generated data, 3 How to reframe these questions as mathematical models, and 4 How to interpret the results of these models in ways that address our questions. Jake Hofman (Columbia University) Introduction and Overview January 20, 2017 2 / 53
  • 3.
    Questions Many long-standing questionsin the social sciences are notoriously difficult to answer, e.g.: • “Who says what to whom in what channel with what effect”? (Laswell, 1948) • How do ideas and technology spread through cultures? (Rogers, 1962) • How do new forms of communication affect society? (Singer, 1970) • . . . Jake Hofman (Columbia University) Introduction and Overview January 20, 2017 3 / 53
  • 4.
    Questions Typically difficult toobserve the relevant information via conventional methods Moreno, 1933 Jake Hofman (Columbia University) Introduction and Overview January 20, 2017 4 / 53
  • 5.
    Large-scale data Recently availableelectronic data provide an unprecedented opportunity to address these questions at scale Demographic Behavioral Network Jake Hofman (Columbia University) Introduction and Overview January 20, 2017 5 / 53
  • 6.
    Computational social science Anemerging discipline at the intersection of the social sciences, statistics, and computer science Jake Hofman (Columbia University) Introduction and Overview January 20, 2017 6 / 53
  • 7.
    Computational social science Anemerging discipline at the intersection of the social sciences, statistics, and computer science (motivating questions) Jake Hofman (Columbia University) Introduction and Overview January 20, 2017 6 / 53
  • 8.
    Computational social science Anemerging discipline at the intersection of the social sciences, statistics, and computer science (fitting large, potentially sparse models) Jake Hofman (Columbia University) Introduction and Overview January 20, 2017 6 / 53
  • 9.
    Computational social science Anemerging discipline at the intersection of the social sciences, statistics, and computer science (parallel processing for filtering and aggregating data) Jake Hofman (Columbia University) Introduction and Overview January 20, 2017 6 / 53
  • 10.
    Topics Exploratory Data Analysis Classification Regression Networks JakeHofman (Columbia University) Introduction and Overview January 20, 2017 7 / 53
  • 11.
    Exploratory Data Analysis (a.k.a.counting and plotting things) Jake Hofman (Columbia University) Introduction and Overview January 20, 2017 8 / 53
  • 12.
    Regression (a.k.a. modeling continuousthings) Jake Hofman (Columbia University) Introduction and Overview January 20, 2017 9 / 53
  • 13.
    Classification (a.k.a. modeling discretethings) Jake Hofman (Columbia University) Introduction and Overview January 20, 2017 10 / 53
  • 14.
    Networks (a.k.a. counting complicatedthings) Jake Hofman (Columbia University) Introduction and Overview January 20, 2017 11 / 53
  • 15.
    Topics http://modelingsocialdata.org Jake Hofman (ColumbiaUniversity) Introduction and Overview January 20, 2017 12 / 53
  • 16.
    The clean realstory “We have a habit in writing articles published in scientific journals to make the work as finished as possible, to cover all the tracks, to not worry about the blind alleys or to describe how you had the wrong idea first, and so on. So there isn’t any place to publish, in a dignified manner, what you actually did in order to get to do the work ...” -Richard Feynman Nobel Lecture1, 1965 1 http://bit.ly/feynmannobel Jake Hofman (Columbia University) Introduction and Overview January 20, 2017 13 / 53
  • 17.
    Outline Web demographicsDailyPer−CapitaPageviews 0 10 20 30 40 50 60 70 q q q q q Over $25k Under$25k Black & Hispanic White No College Some College Over 65 Under 65 Female Male Income Race Education Age Sex Search predictions"Right Round" Week Rank 40 30 20 10 cccccccccccccccccccccccccccccccccccccccccc Mar−09 Apr−09 May−09 Jun−09 Jul−09 Aug−09 Billboard Search Viral hits Jake Hofman (Columbia University) Introduction and Overview January 20, 2017 14 / 53
  • 18.
    Predicting consumer activitywith Web search with Sharad Goel, S´ebastien Lahaie, David Pennock, Duncan Watts "Right Round" Week Rank 40 30 20 10 cccccccccccccccccccccccccccccccccccccccccc Mar−09 Apr−09 May−09 Jun−09 Jul−09 Aug−09 Billboard Search Jake Hofman (Columbia University) Introduction and Overview January 20, 2017 15 / 53
  • 19.
    Search predictions Motivation Does collectivesearch activity provide useful predictive signal about real-world outcomes? "Right Round" Week Rank 40 30 20 10 cccccccccccccccccccccccccccccccccccccccccc Mar−09 Apr−09 May−09 Jun−09 Jul−09 Aug−09 Billboard Search Jake Hofman (Columbia University) Introduction and Overview January 20, 2017 16 / 53
  • 20.
    Search predictions Motivation Past workmainly focuses on predicting the present2 and ignores baseline models trained on publicly available data Date FluLevel(Percent) 1 2 3 4 5 6 7 8 2004 2005 2006 2007 2008 2009 2010 Actual Search Autoregressive 2 Varian, 2009 Jake Hofman (Columbia University) Introduction and Overview January 20, 2017 17 / 53
  • 21.
    Search predictions Motivation We predictfuture sales for movies, video games, and music "Transformers 2" Time to Release (Days) SearchVolume a −30 −20 −10 0 10 20 30 "Tom Clancy's HAWX" Time to Release (Days) SearchVolume b −30 −20 −10 0 10 20 30 "Right Round" Week Rank 40 30 20 10 cccccccccccccccccccccccccccccccccccccccccc Mar−09 Apr−09 May−09 Jun−09 Jul−09 Aug−09 Billboard Search Jake Hofman (Columbia University) Introduction and Overview January 20, 2017 18 / 53
  • 22.
    Search predictions Search models Formovies and video games, predict opening weekend box office and first month sales, respectively: log(revenue) = β0 + β1 log(search) + For music, predict following week’s Billboard Hot 100 rank: billboardt+1 = β0 + β1searcht + β2searcht−1 + Jake Hofman (Columbia University) Introduction and Overview January 20, 2017 19 / 53
  • 23.
    Search predictions Search volume JakeHofman (Columbia University) Introduction and Overview January 20, 2017 20 / 53
  • 24.
    Search predictions Search models Searchactivity is predictive for movies, video games, and music weeks to months in advance Movies Predicted Revenue (Dollars) ActualRevenue(Dollars) 103 104 105 106 107 108 109 ● ● ● ● ● ● ● ● ● ● ● ● ● ● ● ● ● ● ● ● ● ● ● ● ● ● ● ● ● ● ● ● ● ● ● ● ● ● ● ● ● ● ● ● ● ● ● ● ● ● ● ● ● ● ● ● ● ● ● ● ● ●● ● ● ● ● ● ● ● ● ● ● ● ● ● ● ● ● ● ● ● ● ● ● ●● ● ● ● ● ●● ● ● ● ● ● ● ● ● ● ● ● ● ● ● ● ● ● ● ● ● ● ● ● ● aaaaaaaaaaaaaaaaaaaaaaaaaaaaaaaaaaaaaaaaaaaaaaaaaaaaaaaaaaaaaaaaaaaaaaaaaaaaaaaaaaaaaaaaaaaaaaaaaaaaaaaaaaaaaaaaaaaaaaa 103 104 105 106 107 108 109 Video Games Predicted Revenue (Dollars) ActualRevenue(Dollars) 103 104 105 106 107 ● ● ● ● ● ● ● ● ● ● ● ● ● ● ● ● ● ● ● ● ● ● ● ● ● ● ● ● ● ● ● ● ● ● ● ● ● ● ●● ● ● ● ● ● ● ● ● ● ● ● ● ● ● ● ● ● ● ● ● ● ● ● ● ● ● ● ● bbbbbbbbbbbbbbbbbbbbbbbbbbbbbbbbbbbbbbbbbbbbbbbbbbbbbbbbbbbbbbbbbbbbbbbbbbbbbbbbbbbbbbbbbbbbbbbbbbbbbbbbbb 103 104 105 106 107 ● Non−Sequel Sequel Music Predicted Billboard Rank ActualBillboardRank 0 20 40 60 80 100 ● ● ● ● ● ● ● ● ● ● ● ● ● ● ● ● ● ● ● ● ● ● ● ● ● ● ● ● ● ● ● ● ● ● ● ● ● ● ● ● ● ● ● ● ● ● ● ● ● ● ● ● ● ● ● ● ● ● ● ● ● ● ● ● ● ● ● ● ● ● ● ● ● ● ● ● ● ● ● ● ● ● ● ● ● ● ● ● ● ● ● ● ● ● ● ● ● ● ● ● ● ● ● ● ● ● ● ● ● ● ● ● ● ● ● ● ● ● ● ● ● ● ● ● ● ● ● ● ● ● ● ● ● ● ● ● ● ● ● ● ● ● ● ● ● ● ● ● ● ● ● ● ● ● ● ● ● ● ● ● ● ● ● ● ● ● ● ● ● ● ● ● ● ● ● ● ● ● ● ● ● ● ● ● ● ● ● ● ● ● ● ● ● ● ● ● ● ● ● ● ● ● ● ● ● ● ● ● ● ● ● ● ● ● ● ● ● ● ● ● ● ● ● ● ● ● ● ● ● ● ● ● ● ● ● ● ● ● ● ● ● ● ● ● ● ● ● ● ● ● ● ● ● ● ● ● ● ● ● ● ● ● ● ● ● ● ● ● ● ● ● ● ● ● ● ● ● ● ● ● ● ● ● ● ● ● ● ● ● ● ● ● ● ● ● ● ● ● ● ● ● ● ● ● ● ● ● ● ● ● ● ● ● ● ● ● ● ● ● ● ● ● ● ● ● ● ● ● ● ● ● ● ● ● ● ● ● ● ● ● ● ● ● ● ● ● ● ● ● ● ● ● ● ● ● ● ● ● ● ● ● ● ● ● ● ● ● ● ● ● ● ● ● ● ● ● ● ● ● ● ● ● ● ● ● ● ● ● ● ● ● ● ● ● ● ● ● ● ● ● ● ● ● ● ● ● ● ● ● ● ● ● ● ● ● ● ● ● ● ● ● ● ● ● ● ● ● ● ● ● ● ● ● ● ● ● ● ● ● ● ● ● ● ● ● ● ● ● ● ● ● ● ● ● ● ● ● ● ● ● ● ● ● ● ● ● ● ● ● ● ● ● ● ● ● ● ● ● ● ● ● ● ● ● ● ● ● ● ● ● ● ● ● ● ● ● ● ● ● ● ● ● ● ● ● ● ● ● ● ● ● ● ● ● ● ● ● ● ● ● ● ● ● ● ● ● ● ● ● ● ● ● ● ● ● ● ● ● ● ● ● ● ● ● ● ● ● ● ● ● ● ● ● ● ● ● ● ● ● ● ● ● ● ● ● ● ● ● ● ● ● ● ● ● ● ● ● ● ● ● ● ● ● ● ● ● ● ● ● ● ● ● ● ● ● ● ● ● ● ● ● ● ● ● ● ● ● ● ● ● ● ● ● ● ● ● ● ● ● ● ● ● ● ● ● ● ● ● ● ● ● ● ● ● ● ● ● ● ● ● ● ● ● ● ● ● ● ● ● ● ● ● ● ● ● ● ● ● ● ● ● ● ● ● ● ● ● ● ● ● ● ● ● ● ● ● ● ● ● ● ● ● ● ● ● ● ● ● ● ● ● ● ● ● ● ● ● ● ● ● ● ● ● ● ● ● ● ● ● ● ● ● ● ● ● ● ● ● ● ● ● ● ● ● ● ● ● ● ● ● ● ● ● ● ● ● ● ● ● ● ● ● ● ● ● ● ● ● ● ● ● ● ● ● ● ● ● ● ● ● ● ● ● ● ● ● ● ● ● ● ● ● ● ● ● ● ● ● ● ● ● ● ● ● ● ● ● ● ● ● ● ● ● ● ● ● ● ● ● ● ● ● ● ● ● ● ● ● ● ● ● ● ● ● ●● ● ● ● ● ● ● ● ● ● ● ● ● ● ● ● ● ● ● ● ● ● ● ● ● ● ● ● ● ● ● ● ● ● ● ● ● ● ● ● ● ● ● ● ● ● ● ● ● ● ● ● ● ● ● ● ● ● ● ● ● ● ● ● ● ● ● ● ● ● ● ● ● ● ● ● ● ● ● ● ● ● ● ● ● ● ● ● ● ● ● ● ● ● ● ● ● ● ● ● ● ● ● ● ● ● ● ● ● ● ● ● ● ● ● ● ● ● ● ● ● ● ● ● ● ● ● ● ● ● ● ● ● ● ● ● ● ● ● ● ● ● ● ● ● ● ● ● ● ● ● ● ● ● ● ● ● ● ● ● ● ● ● ● ● ● ● ● ● ● ● ● ● ● ● ● ● ● ● ● ● ● ● ● ● c 0 20 40 60 80 100 Movies Time to Release (Weeks) ModelFit 0.4 0.5 0.6 0.7 0.8 0.9 ddddddd −6 −5 −4 −3 −2 −1 0 Video Games Time to Release (Weeks) ModelFit 0.4 0.5 0.6 0.7 0.8 0.9 eeeeeee −6 −5 −4 −3 −2 −1 0 Music Time to Release (Weeks)ModelFit 0.4 0.5 0.6 0.7 0.8 0.9 fffffff −6 −5 −4 −3 −2 −1 0 Jake Hofman (Columbia University) Introduction and Overview January 20, 2017 21 / 53
  • 25.
    Search predictions Baseline models Formovies, use budget, number of opening screens and Hollywood Stock Exchange: log(revenue) = β0 + β1 log(budget) + β2 log(screens) + β3 log(hsx) + Jake Hofman (Columbia University) Introduction and Overview January 20, 2017 22 / 53
  • 26.
    Search predictions Baseline models Forvideo games, use critic ratings and predecessor sales (sequels only): log(revenue) = β0 + β1rating + β2 log(predecessor) + Jake Hofman (Columbia University) Introduction and Overview January 20, 2017 22 / 53
  • 27.
    Search predictions Baseline models Formusic, use an autoregressive model with the previously available rank: billboardt+1 = β0 + β1billboardt−1 + Jake Hofman (Columbia University) Introduction and Overview January 20, 2017 22 / 53
  • 28.
    Search predictions Baseline +combined models Baseline models are often surprisingly good Movies (Baseline) Predicted Revenue (Dollars) ActualRevenue(Dollars) 103 104 105 106 107 108 109 ● ● ● ● ● ● ● ● ● ● ● ● ● ● ● ● ● ● ● ● ● ● ● ● ● ● ● ● ● ● ● ● ● ● ● ● ● ● ● ● ● ● ● ● ● ● ● ● ● ● ● ● ● ● ● ● ● ● ● ● ● ● ● ● ● ● ● ● ● ● ● ● ● ● ● ● ● ● ● ● ● ● ● ● ● ● ●● ● ● ● ● ●● ● ● ● ● ● ● ● ● ● ● ● ● ● ● ● ● ● ● ● ● ● ● ● ● aaaaaaaaaaaaaaaaaaaaaaaaaaaaaaaaaaaaaaaaaaaaaaaaaaaaaaaaaaaaaaaaaaaaaaaaaaaaaaaaaaaaaaaaaaaaaaaaaaaaaaaaaaaaaaaaaaaaaaa 103 104 105 106 107 108 109 Video Games (Baseline) Predicted Revenue (Dollars) ActualRevenue(Dollars) 103 104 105 106 107 ● ● ● ● ● ● ● ● ● ● ● ● ● ● ● ● ● ● ● ● ● ● ● ● ● ● ● ● ● ● ● ● ● ● ● ● ● ● ●● ● ● ● ● ● ● ● ● ● ● ● ● ●● ● ● ● ● ● ● ● ● ● ● ● ● ● ● bbbbbbbbbbbbbbbbbbbbbbbbbbbbbbbbbbbbbbbbbbbbbbbbbbbbbbbbbbbbbbbbbbbbbbbbbbbbbbbbbbbbbbbbbbbbbbbbbbbbbbbbbb 103 104 105 106 107 ● Non−Sequel Sequel Music (Baseline) Predicted Billboard Rank ActualBillboardRank 0 20 40 60 80 100 ● ● ● ● ● ● ● ● ● ● ● ● ● ● ● ● ● ● ● ● ● ● ● ● ● ● ● ● ● ● ● ● ● ● ● ● ● ● ● ● ● ● ● ● ● ● ● ● ● ● ● ● ● ● ● ● ● ● ● ● ● ● ● ● ● ● ● ● ● ● ● ● ● ● ● ● ● ● ● ● ● ● ● ● ● ● ● ● ● ● ● ● ● ● ● ● ● ● ● ● ● ● ● ● ● ● ● ● ● ● ● ● ● ● ● ● ● ● ● ● ● ● ● ● ● ● ● ● ● ● ● ● ● ● ● ● ● ● ● ● ● ● ● ● ● ● ● ● ● ● ● ● ● ● ● ● ● ● ● ● ● ● ● ● ● ● ● ● ● ● ● ● ● ● ● ● ● ● ● ● ● ● ● ● ● ● ● ● ● ● ● ● ● ● ● ● ● ● ● ● ● ● ● ● ● ● ● ● ● ● ● ● ● ● ● ● ● ● ● ● ● ● ● ● ● ● ● ● ● ● ● ● ● ● ● ● ● ● ● ● ● ● ● ● ● ● ● ● ● ● ● ● ● ● ● ● ● ● ● ● ● ● ● ● ● ● ● ● ● ● ● ● ● ● ● ● ● ● ● ● ● ● ● ● ● ● ● ● ●● ● ● ● ● ● ● ● ● ● ● ● ● ● ● ● ● ● ● ● ● ● ● ● ● ● ● ● ● ● ● ● ● ● ● ● ● ● ● ● ● ● ● ● ● ● ● ● ● ● ● ● ● ● ● ● ● ● ● ● ● ● ● ● ● ● ● ● ● ● ● ● ● ● ● ● ● ● ● ● ● ● ● ● ● ● ● ● ● ● ● ● ● ● ● ● ● ● ● ● ● ● ● ● ● ● ● ● ● ● ● ● ● ● ● ● ● ● ● ● ● ● ● ● ● ● ● ● ● ● ● ● ● ● ● ● ● ● ● ● ● ● ● ● ● ● ● ● ● ● ● ● ● ● ● ● ● ● ● ● ● ● ● ● ● ● ● ● ● ● ● ● ● ● ● ● ● ● ● ● ● ● ● ● ● ● ● ● ● ● ● ● ● ● ● ● ● ● ● ● ● ● ● ● ● ● ● ●● ● ● ● ● ● ● ● ● ● ● ● ● ● ● ● ● ● ● ● ● ● ● ● ● ● ● ● ● ● ● ● ● ● ● ● ● ● ● ● ● ● ● ● ● ● ● ● ● ● ● ● ● ● ● ● ● ● ● ● ● ● ● ● ● ● ● ● ● ● ● ● ● ● ● ● ● ● ● ● ● ● ● ● ● ● ● ● ● ● ● ● ● ● ● ● ● ● ● ● ● ● ● ● ● ● ● ● ● ● ● ● ● ● ● ● ● ● ● ● ● ● ● ● ● ● ● ● ● ● ● ● ● ● ● ● ● ● ● ● ● ● ● ● ● ● ● ● ● ● ● ● ● ● ● ● ● ● ● ● ● ● ● ● ● ● ● ● ● ● ● ● ● ● ● ● ● ● ● ● ● ● ● ● ● ● ● ● ● ● ● ● ● ● ● ● ● ● ● ● ● ● ● ● ● ● ● ● ● ● ● ● ● ● ● ● ● ● ● ● ● ● ● ● ● ● ● ● ● ● ● ● ● ● ● ● ● ● ● ● ● ● ● ● ● ● ● ● ● ● ● ● ● ● ● ● ● ● ● ● ● ● ● ● ● ● ● ● ● ● ● ● ● ● ● ● ● ● ● ● ● ● ● ● ● ● ● ● ● ● ● ● ● ● ● ● ● ● ● ● ● ● ● ● ● ● ● ● ● ● ● ● ● ● ● ● ● ● ● ● ● ● ● ● ● ● ● ● ● ● ● ● ● ● ● ● ● ● ● ● ● ● ● ● ● ● ●● ● ● ● ● ● ● ● ● ● ● ● ● ● ● ● ● ● ● ● ● ● ● ● ● ● ● ● ● ● ● ● ● ● ● ● ● ● ● ● ● ● ● ● ● ● ● ●● ● ● ● ● ● ● ● ● ● ● ● ● ● ● ● ● ● ● ● ● ● ● ● ● ● ● ● ● ● ● ● ● ● ● ● ● ● ● ● ● ● ● ● ● ● ● ● ● ● ● ● ● ● ● ● ● ● ● ● ● ● ● ● ● ● ● ● ● ● ● ● ● ● ● ● ● ● ● ● ● ● ● ●● ● ● ● ● ● ● ● ● ● ● ● ● ● ● ● ●● ● ● ● ● ● ● ● ● ● ● ● ● ● ● ● ● ● ● ● ● ● ● ● ● ● ● ● ● ● ● ● ● ● ● ● ● ● ● ● ● ● ● ● ● ● ● ● ● ● ● ● ● ● ● ● ● ● ● ● ● ● ● ● ● ● ● ● ● ● ● ● ● ● ● ● ● ● ● ● ● ● ● ● ● ● ● ● ● ● ● ● ● ● ● ● ● ● ● ● ● ● ● ● ● ● ● c 0 20 40 60 80 100 Movies (Combined) Predicted Revenue (Dollars) ActualRevenue(Dollars) 103 104 105 106 107 108 109 ● ● ● ● ● ● ● ● ● ● ● ● ● ● ● ● ● ● ● ● ● ● ● ● ● ● ● ● ● ● ● ● ● ● ● ● ● ● ● ● ● ● ● ● ● ● ● ● ● ● ● ● ● ● ● ● ● ● ● ● ● ●● ● ● ● ● ● ● ● ● ● ● ● ● ● ● ● ● ● ● ● ● ● ● ● ●● ● ● ● ● ●● ● ● ● ● ● ● ● ● ● ● ● ● ● ● ● ● ● ● ● ● ● ● ● ● ddddddddddddddddddddddddddddddddddddddddddddddddddddddddddddddddddddddddddddddddddddddddddddddddddddddddddddddddddddddd 103 104 105 106 107 108 109 Video Games (Combined) Predicted Revenue (Dollars) ActualRevenue(Dollars) 103 104 105 106 107 ● ● ● ● ● ● ● ● ● ● ● ● ● ● ● ● ● ● ● ● ● ● ● ● ● ● ● ● ● ● ● ● ● ● ● ● ● ● ●● ● ● ● ● ● ● ● ● ● ● ● ● ●● ● ● ● ● ● ● ● ● ● ● ● ● ● ● eeeeeeeeeeeeeeeeeeeeeeeeeeeeeeeeeeeeeeeeeeeeeeeeeeeeeeeeeeeeeeeeeeeeeeeeeeeeeeeeeeeeeeeeeeeeeeeeeeeeeeeeee 103 104 105 106 107 ● Non−Sequel Sequel Music (Combined) Predicted Billboard Rank ActualBillboardRank 0 20 40 60 80 100 ● ● ● ● ● ● ● ● ● ● ● ● ● ● ● ● ● ● ● ● ● ● ● ● ● ● ● ● ● ● ● ● ● ● ● ● ● ● ● ● ● ● ● ● ● ● ● ● ● ● ● ● ● ● ● ● ● ● ● ● ● ● ● ● ● ● ● ● ● ● ● ● ● ● ● ● ● ● ● ● ● ● ● ● ● ● ● ● ● ● ● ● ● ● ● ● ● ● ● ● ● ● ● ● ● ● ● ● ● ● ● ● ● ● ● ● ● ● ● ● ● ● ● ● ● ● ● ● ● ● ● ● ● ● ● ● ● ● ● ● ● ● ● ● ● ● ● ● ● ● ● ● ● ● ● ● ● ● ● ● ● ● ● ● ● ● ● ● ● ● ● ● ● ● ● ● ● ● ● ● ● ● ● ● ● ● ● ● ● ● ● ● ● ● ● ● ● ● ● ● ● ● ● ● ● ● ● ● ● ● ● ● ● ● ● ● ● ● ● ● ●● ● ● ● ● ● ● ● ● ● ● ● ● ● ● ● ● ● ● ● ● ● ● ● ● ● ● ● ● ● ● ● ● ● ● ● ● ● ● ● ● ● ● ● ● ● ● ● ● ● ● ● ● ● ● ● ● ● ● ● ● ● ● ● ● ● ● ● ● ● ● ● ● ● ● ● ● ● ● ● ● ● ● ● ● ● ● ● ● ● ● ● ● ● ● ● ● ● ● ● ● ● ● ● ● ● ● ● ● ● ● ● ● ● ● ● ● ● ● ● ● ● ● ● ● ● ● ● ● ● ● ● ● ● ● ● ● ● ● ● ● ● ● ● ● ● ● ● ● ● ● ● ● ●● ● ● ● ● ● ● ● ● ● ● ● ● ● ● ● ● ● ● ● ● ● ● ● ● ● ● ● ● ● ● ● ● ● ● ● ● ● ● ● ● ● ● ● ● ● ● ● ● ● ● ● ● ● ● ● ● ● ● ● ● ● ● ● ● ● ● ● ● ● ● ● ● ● ● ● ●● ● ● ● ● ● ● ● ● ● ● ● ● ● ● ● ● ● ● ● ● ● ● ● ● ● ● ● ● ● ● ● ● ● ● ● ● ● ● ● ● ● ● ● ● ● ● ● ● ● ● ● ● ● ● ● ● ● ● ● ● ● ● ● ● ● ● ● ● ● ● ● ● ● ● ● ● ● ● ● ● ● ● ● ● ● ● ● ● ● ● ● ● ● ● ● ● ● ● ● ● ● ● ● ● ● ● ● ● ● ● ● ● ● ● ● ● ● ● ● ● ● ● ● ● ● ● ● ● ● ● ● ● ● ● ● ● ● ● ● ● ● ● ● ● ● ● ● ● ● ● ● ● ● ● ● ● ● ● ● ● ● ● ● ● ● ● ● ● ● ● ● ● ● ● ● ● ● ● ● ● ● ● ● ● ● ● ● ● ● ● ● ● ● ● ● ● ● ● ● ● ● ● ● ● ● ● ● ● ● ● ● ● ● ● ● ● ● ● ● ● ● ● ● ● ● ● ● ● ● ● ● ● ● ● ● ● ● ● ● ● ● ● ● ● ● ● ● ● ● ● ● ● ● ● ● ● ● ● ● ● ● ● ● ● ● ● ● ● ● ● ● ● ● ● ● ● ● ● ● ● ● ● ● ● ● ● ● ● ● ● ● ● ● ● ● ● ● ● ● ● ● ● ● ● ● ● ● ● ● ● ● ● ● ● ● ● ● ● ● ● ● ● ● ● ● ● ● ● ● ● ● ● ● ● ● ● ● ● ● ● ● ● ● ● ● ● ● ● ● ● ● ● ● ● ● ● ● ● ●● ● ● ● ● ● ● ● ● ● ● ● ● ● ● ● ● ● ● ● ● ● ● ● ● ● ● ● ● ● ● ● ● ● ● ● ● ● ● ● ● ● ● ● ● ● ● ● ● ● ● ● ● ● ● ● ● ● ● ● ● ● ● ● ● ● ● ● ● ● ● ● ● ● ● ● ● ● ● ● ● ● ● ● ● ● ● ● ● ● ● ● ● ● ● ● ● ● ● ● ● ● ● ● ● ● ● ● ● ● ● ● ● ● ● ● ● ● ● ● ● ● ● ● ● ● ● ● ● ● ● ● ● ● ● ● ● ● ● ● ● ● ● ● ● ● ● ● ● ● ● ● ● ● ● ● ● ● ● ● ● ● ● ● ● ● ● ● ● ● ● ● ● ● ● ● ● ● ● ● ● ● ● ● ● f 0 20 40 60 80 100 Jake Hofman (Columbia University) Introduction and Overview January 20, 2017 23 / 53
  • 29.
    Search predictions Model comparison Formovies, search is outperformed by the baseline and of little marginal value ModelFit 0.4 0.5 0.6 0.7 0.8 0.9 1.0 CombinedCombinedCombinedCombinedCombinedCombinedCombinedCombinedCombinedCombinedCombinedCombinedCombinedCombinedCombined SearchSearchSearchSearchSearchSearchSearchSearchSearchSearchSearchSearchSearchSearchSearch BaselineBaselineBaselineBaselineBaselineBaselineBaselineBaselineBaselineBaselineBaselineBaselineBaselineBaselineBaseline N onsequelG am es SequelG am es M usic M ovies Flu Jake Hofman (Columbia University) Introduction and Overview January 20, 2017 24 / 53
  • 30.
    Search predictions Model comparison Forvideo games, search helps substantially for non-sequels, less so for sequels ModelFit 0.4 0.5 0.6 0.7 0.8 0.9 1.0 CombinedCombinedCombinedCombinedCombinedCombinedCombinedCombinedCombinedCombinedCombinedCombinedCombinedCombinedCombined SearchSearchSearchSearchSearchSearchSearchSearchSearchSearchSearchSearchSearchSearchSearch BaselineBaselineBaselineBaselineBaselineBaselineBaselineBaselineBaselineBaselineBaselineBaselineBaselineBaselineBaseline N onsequelG am es SequelG am es M usic M ovies Flu Jake Hofman (Columbia University) Introduction and Overview January 20, 2017 24 / 53
  • 31.
    Search predictions Model comparison Formusic, the addition of search yields a substantially better combined model ModelFit 0.4 0.5 0.6 0.7 0.8 0.9 1.0 CombinedCombinedCombinedCombinedCombinedCombinedCombinedCombinedCombinedCombinedCombinedCombinedCombinedCombinedCombined SearchSearchSearchSearchSearchSearchSearchSearchSearchSearchSearchSearchSearchSearchSearch BaselineBaselineBaselineBaselineBaselineBaselineBaselineBaselineBaselineBaselineBaselineBaselineBaselineBaselineBaseline N onsequelG am es SequelG am es M usic M ovies Flu Jake Hofman (Columbia University) Introduction and Overview January 20, 2017 24 / 53
  • 32.
    Search predictions Summary • Relativeperformance and value of search varies across domains • Search provides a fast, convenient, and flexible signal across domains • “Predicting consumer activity with Web search” Goel, Hofman, Lahaie, Pennock & Watts, PNAS 2010 Jake Hofman (Columbia University) Introduction and Overview January 20, 2017 25 / 53
  • 33.
    Demographic diversity onthe Web with Irmak Sirer and Sharad Goel (ICWSM 2012) DailyPer−CapitaPageviews 0 10 20 30 40 50 60 70 q q q q q Over $25k Under $25k Black & Hispanic White No College Some College Over 65 Under 65 Female Male Income Race Education Age Sex Jake Hofman (Columbia University) Introduction and Overview January 20, 2017 26 / 53
  • 34.
    Motivation Previous work islargely survey-based and focuses and group-level differences in online access Jake Hofman (Columbia University) Introduction and Overview January 20, 2017 27 / 53
  • 35.
    Motivation “As of January1997, we estimate that 5.2 million African Americans and 40.8 million whites have ever used the Web, and that 1.4 million African Americans and 20.3 million whites used the Web in the past week.” -Hoffman & Novak (1998) Jake Hofman (Columbia University) Introduction and Overview January 20, 2017 27 / 53
  • 36.
    Motivation Focus on activityinstead of access How diverse is the Web? To what extent do online experiences vary across demographic groups? Jake Hofman (Columbia University) Introduction and Overview January 20, 2017 28 / 53
  • 37.
    Data • Representative sampleof 265,000 individuals in the US, paid via the Nielsen MegaPanel3 • Log of anonymized, complete browsing activity from June 2009 through May 2010 (URLs viewed, timestamps, etc.) • Detailed individual and household demographic information (age, education, income, race, sex, etc.) 3 Special thanks to Mainak Mazumdar Jake Hofman (Columbia University) Introduction and Overview January 20, 2017 29 / 53
  • 38.
    Data # ls -alhnielsen_megapanel.tar -rw-r--r-- 100G Jul 17 13:00 nielsen_megapanel.tar Jake Hofman (Columbia University) Introduction and Overview January 20, 2017 30 / 53
  • 39.
    Data # ls -alhnielsen_megapanel.tar -rw-r--r-- 100G Jul 17 13:00 nielsen_megapanel.tar • Normalize pageviews to at most three domain levels, sans www e.g. www.yahoo.com → yahoo.com, us.mg2.mail.yahoo.com/neo/launch → mail.yahoo.com Jake Hofman (Columbia University) Introduction and Overview January 20, 2017 30 / 53
  • 40.
    Data # ls -alhnielsen_megapanel.tar -rw-r--r-- 100G Jul 17 13:00 nielsen_megapanel.tar • Normalize pageviews to at most three domain levels, sans www e.g. www.yahoo.com → yahoo.com, us.mg2.mail.yahoo.com/neo/launch → mail.yahoo.com • Restrict to top 100k (out of 9M+ total) most popular sites (by unique visitors) Jake Hofman (Columbia University) Introduction and Overview January 20, 2017 30 / 53
  • 41.
    Data # ls -alhnielsen_megapanel.tar -rw-r--r-- 100G Jul 17 13:00 nielsen_megapanel.tar • Normalize pageviews to at most three domain levels, sans www e.g. www.yahoo.com → yahoo.com, us.mg2.mail.yahoo.com/neo/launch → mail.yahoo.com • Restrict to top 100k (out of 9M+ total) most popular sites (by unique visitors) • Aggregate activity at the site, group, and user levels Jake Hofman (Columbia University) Introduction and Overview January 20, 2017 30 / 53
  • 42.
    Aggregate usage patterns Howdo users distribute their time across different categories? Fractionoftotalpageviews 0.05 0.10 0.15 0.20 0.25 q q q q q SocialM edia E−m ail G am es Portals Search All groups spend the majority of their time in the top five most popular categories Jake Hofman (Columbia University) Introduction and Overview January 20, 2017 31 / 53
  • 43.
    Aggregate usage patterns Howdo users distribute their time across different categories? User Rank by Daily Activity FractionofPageviewsinCategory 0.05 0.10 0.15 0.20 0.25 0.30 q q q q q q q q q q 10% 30% 50% 70% 90% q Social Media E−mail Games Portals Search Highly active users devote nearly twice as much of their time to social media relative to typical individuals Jake Hofman (Columbia University) Introduction and Overview January 20, 2017 31 / 53
  • 44.
    Group-level activity How doesbrowsing activity vary at the group level? DailyPer−CapitaPageviews 0 10 20 30 40 50 60 70 q q q q q Over $25k Under $25k Black & Hispanic White No College Some College Over 65 Under 65 Female Male Income Race Education Age Sex Large differences exist even at the aggregate level (e.g. women on average generate 40% more pageviews than men) Jake Hofman (Columbia University) Introduction and Overview January 20, 2017 32 / 53
  • 45.
    Group-level activity How doesbrowsing activity vary at the group level? DailyPer−CapitaPageviews 0 10 20 30 40 50 60 70 q q q q q Over $25k Under $25k Black & Hispanic White No College Some College Over 65 Under 65 Female Male Income Race Education Age Sex Younger and more educated individuals are both more likely to access the Web and more active once they do Jake Hofman (Columbia University) Introduction and Overview January 20, 2017 32 / 53
  • 46.
    Group-level activity All demographicgroups spend the majority of their time in the same categories Age Fractionoftotalpageviews 0.0 0.1 0.2 0.3 0.4 0.5 q q q q q q q q q q q q q q q q 5 10 15 20 25 30 35 40 45 50 55 60 65 70 75 80 q Social Media E−mail Games Portals Search Fractionoftotalpageviews 0.0 0.1 0.2 0.3 0.4 Education ● ● ● ● ● ● ● G ram m arSchool Som e H ig h School H ig h SchoolG raduate Som e C ollege Associa te D egree Bachelo r's D egree PostG raduate D egree Sex ● ● Fem ale M ale Income ● ● ● ● ● ● $0−25k $25−50k $50−75k $75−100k $100−150k $150k+ Race ● ● ● ● ● O ther H is panic Bla ck W hite Asia n Jake Hofman (Columbia University) Introduction and Overview January 20, 2017 33 / 53
  • 47.
    Group-level activity Older, moreeducated, male, wealthier, and Asian Internet users spend a smaller fraction of their time on social media Age Fractionoftotalpageviews 0.0 0.1 0.2 0.3 0.4 0.5 q q q q q q q q q q q q q q q q 5 10 15 20 25 30 35 40 45 50 55 60 65 70 75 80 q Social Media E−mail Games Portals Search Fractionoftotalpageviews 0.0 0.1 0.2 0.3 0.4 Education ● ● ● ● ● ● ● G ram m arSchool Som e H ig h School H ig h SchoolG raduate Som e C ollege Associa te D egree Bachelo r's D egree PostG raduate D egree Sex ● ● Fem ale M ale Income ● ● ● ● ● ● $0−25k $25−50k $50−75k $75−100k $100−150k $150k+ Race ● ● ● ● ● O ther H is panic Bla ck W hite Asia n Jake Hofman (Columbia University) Introduction and Overview January 20, 2017 33 / 53
  • 48.
    Group-level activity Lower socialmedia use by these groups is often accompanied by higher e-mail volume Age Fractionoftotalpageviews 0.0 0.1 0.2 0.3 0.4 0.5 q q q q q q q q q q q q q q q q 5 10 15 20 25 30 35 40 45 50 55 60 65 70 75 80 q Social Media E−mail Games Portals Search Fractionoftotalpageviews 0.0 0.1 0.2 0.3 0.4 Education ● ● ● ● ● ● ● G ram m arSchool Som e H ig h School H ig h SchoolG raduate Som e C ollege Associa te D egree Bachelo r's D egree PostG raduate D egree Sex ● ● Fem ale M ale Income ● ● ● ● ● ● $0−25k $25−50k $50−75k $75−100k $100−150k $150k+ Race ● ● ● ● ● O ther H is panic Bla ck W hite Asia n Jake Hofman (Columbia University) Introduction and Overview January 20, 2017 33 / 53
  • 49.
    Revisiting the digitaldivide How does usage of news, health, and reference vary with demographics? Averagepageviewspermonth 0 2 4 6 8 10 12 Education ● ● ● ● ● ● ● G ram m arSchool Som e H ig h School H ig h SchoolG raduate Som e C ollege Associa te D egree Bachelo r's D egree PostG raduate D egree Sex ● ● Fem ale M ale Income ● ● ● ● ● ● $0−25k $25−50k $50−75k $75−100k $100−150k $150k+ Race ● ● ● ● ● O ther H is panic Bla ck W hite Asia n ● News Health Reference Post-graduates spend three times as much time on health sites than adults with only some high school education Jake Hofman (Columbia University) Introduction and Overview January 20, 2017 34 / 53
  • 50.
    Revisiting the digitaldivide How does usage of news, health, and reference vary with demographics? Averagepageviewspermonth 0 2 4 6 8 10 12 Education ● ● ● ● ● ● ● G ram m arSchool Som e H ig h School H ig h SchoolG raduate Som e C ollege Associa te D egree Bachelo r's D egree PostG raduate D egree Sex ● ● Fem ale M ale Income ● ● ● ● ● ● $0−25k $25−50k $50−75k $75−100k $100−150k $150k+ Race ● ● ● ● ● O ther H is panic Bla ck W hite Asia n ● News Health Reference Asians spend more than 50% more time browsing online news than do other race groups Jake Hofman (Columbia University) Introduction and Overview January 20, 2017 34 / 53
  • 51.
    Revisiting the digitaldivide How does usage of news, health, and reference vary with demographics? Averagepageviewspermonth 0 2 4 6 8 10 12 Education ● ● ● ● ● ● ● G ram m arSchool Som e H ig h School H ig h SchoolG raduate Som e C ollege Associa te D egree Bachelo r's D egree PostG raduate D egree Sex ● ● Fem ale M ale Income ● ● ● ● ● ● $0−25k $25−50k $50−75k $75−100k $100−150k $150k+ Race ● ● ● ● ● O ther H is panic Bla ck W hite Asia n ● News Health Reference Even when less educated and less wealthy groups gain access to the Web, they utilize these resources relatively infrequently Jake Hofman (Columbia University) Introduction and Overview January 20, 2017 34 / 53
  • 52.
    Revisiting the digitaldivide How does usage of news, health, and reference vary with demographics? Averagepageviewspermonth 0 2 4 6 8 10 12 News q q q q q H ig h SchoolG raduate Som e C ollege Associa te D egree Bachelo r's D egreePostG raduate D egree Health q q q q q H ig h SchoolG raduate Som e C ollege Associa te D egree Bachelo r's D egreePostG raduate D egree Reference q q q q q H ig h SchoolG raduate Som e C ollege Associa te D egree Bachelo r's D egreePostG raduate D egree Asian Black Hispanic White Controlling for other variables, effects of race and gender largely disappear, while education continues to have large effect pi = j αj xij + j k βjkxij xik + j γj x2 ij + i Jake Hofman (Columbia University) Introduction and Overview January 20, 2017 35 / 53
  • 53.
    Revisiting the digitaldivide How does usage of news, health, and reference vary with demographics? Averagepageviewspermonth 0 2 4 6 8 10 12 Health q q q q q H igh SchoolG raduate Som e C ollegeAssociate D egreeBachelor's D egree PostG raduate D egree Female Male However, women spend considerably more time on health sites compared to men Jake Hofman (Columbia University) Introduction and Overview January 20, 2017 36 / 53
  • 54.
    Revisiting the digitaldivide How does usage of news, health, and reference vary with demographics? Monthly pageviews on health sites 20 40 60 80 100 Female Male However, women spend considerably more time on health sites compared to men, although means can be misleading Jake Hofman (Columbia University) Introduction and Overview January 20, 2017 36 / 53
  • 55.
    Summary • Highly activeusers spend disproportionately more of their time on social media and less on e-mail relative to the overall population • Access to research, news, and healthcare is strongly related to education, not as closely to ethnicity • User demographics can be inferred from browsing activity with reasonable accuracy • “Who Does What on the Web”, Goel, Hofman & Sirer, ICWSM 2012 Jake Hofman (Columbia University) Introduction and Overview January 20, 2017 37 / 53
  • 56.
    The structural viralityof online diffusion with Ashton Anderson, Sharad Goel, Duncan Watts (Management Science 2015) Jake Hofman (Columbia University) Introduction and Overview January 20, 2017 38 / 53
  • 57.
    “Going Viral”? Jake Hofman(Columbia University) Introduction and Overview January 20, 2017 39 / 53
  • 58.
    “Going Viral”? Jake Hofman(Columbia University) Introduction and Overview January 20, 2017 40 / 53
  • 59.
    “Going Viral”? “Therefore we... wish to proceed with great care as is proper, and to cut off the advance of this plague and cancerous disease so it will not spread any further ...”4 -Pope Leo X Exsurge Domine (1520) 4 http://www.economist.com/node/21541719 Jake Hofman (Columbia University) Introduction and Overview January 20, 2017 40 / 53
  • 60.
    “Going Viral”? Rogers (1962),Bass (1969) Jake Hofman (Columbia University) Introduction and Overview January 20, 2017 41 / 53
  • 61.
    “Going viral”? Jake Hofman(Columbia University) Introduction and Overview January 20, 2017 42 / 53
  • 62.
    “Going viral”? Jake Hofman(Columbia University) Introduction and Overview January 20, 2017 42 / 53
  • 63.
    “Going viral”? How dopopular things become popular? Jake Hofman (Columbia University) Introduction and Overview January 20, 2017 43 / 53
  • 64.
    Data • Examined oneyear of tweets from July 2011 to July 2012 Jake Hofman (Columbia University) Introduction and Overview January 20, 2017 44 / 53
  • 65.
    Data • Examined oneyear of tweets from July 2011 to July 2012 • Restricted to 1.4 billion tweets containing links to top news, videos, images, and petitions sites Jake Hofman (Columbia University) Introduction and Overview January 20, 2017 44 / 53
  • 66.
    Data • Examined oneyear of tweets from July 2011 to July 2012 • Restricted to 1.4 billion tweets containing links to top news, videos, images, and petitions sites • Aggregated tweets by URL, resulting in 1 billion distinct “events” Jake Hofman (Columbia University) Introduction and Overview January 20, 2017 44 / 53
  • 67.
    Data • Examined oneyear of tweets from July 2011 to July 2012 • Restricted to 1.4 billion tweets containing links to top news, videos, images, and petitions sites • Aggregated tweets by URL, resulting in 1 billion distinct “events” • Crawled friend list of each adopter Jake Hofman (Columbia University) Introduction and Overview January 20, 2017 44 / 53
  • 68.
    Data • Examined oneyear of tweets from July 2011 to July 2012 • Restricted to 1.4 billion tweets containing links to top news, videos, images, and petitions sites • Aggregated tweets by URL, resulting in 1 billion distinct “events” • Crawled friend list of each adopter • Inferred “who got what from whom” to construct diffusion trees Jake Hofman (Columbia University) Introduction and Overview January 20, 2017 44 / 53
  • 69.
    Data • Examined oneyear of tweets from July 2011 to July 2012 • Restricted to 1.4 billion tweets containing links to top news, videos, images, and petitions sites • Aggregated tweets by URL, resulting in 1 billion distinct “events” • Crawled friend list of each adopter • Inferred “who got what from whom” to construct diffusion trees • Characterized size and structure of trees Jake Hofman (Columbia University) Introduction and Overview January 20, 2017 44 / 53
  • 70.
    The Structural Viralityof Online Diffusion A B D C E Time Jake Hofman (Columbia University) Introduction and Overview January 20, 2017 45 / 53
  • 71.
    Information diffusion Cascade sizedistribution 0.00001% 0.0001% 0.001% 0.01% 0.1% 1% 10% 1 10 100 1,000 10,000 Cascade Size CCDF Focus on the rare hits that get at least 100 adoptions Jake Hofman (Columbia University) Introduction and Overview January 20, 2017 46 / 53
  • 72.
    Quantifying structure Measure theaverage distance between all pairs of nodes5 5 Weiner (1947); correlated with other possible metrics Jake Hofman (Columbia University) Introduction and Overview January 20, 2017 47 / 53
  • 73.
    Information diffusion Size andvirality by category Remarkable structural diversity across across categories 0.001% 0.01% 0.1% 1% 10% 100% 100 1,000 10,000 Cascade Size CCDF Videos Pictures News Petitions 0.001% 0.01% 0.1% 1% 10% 100% 3 10 30 Structural Virality CCDF Videos Pictures News Petitions Jake Hofman (Columbia University) Introduction and Overview January 20, 2017 48 / 53
  • 74.
    Information diffusion Structural diversity 050 100 150 time size 0 5 10 15 20 time size 0 20 40 60 80 100 120 140 time size 0 20 40 60 80 100 120 time size 0.0 0.5 1.0 1.5 time size 0 10 20 30 40 50 60 70 time size Jake Hofman (Columbia University) Introduction and Overview January 20, 2017 49 / 53
  • 75.
    Information diffusion Structural diversity Sizeis relatively poor predictive of structure Jake Hofman (Columbia University) Introduction and Overview January 20, 2017 50 / 53
  • 76.
    Summary Popular = Viral JakeHofman (Columbia University) Introduction and Overview January 20, 2017 51 / 53
  • 77.
    Information diffusion Summary • Mostcascades fail, resulting in fewer than two adoptions, on average • Of the hits that do succeed, we observe a wide range of diverse diffusion structures • It’s difficult to say how something spread given only its popularity • “The structural virality of online diffusion”, Anderson, Goel, Hofman & Watts (Management Science 2015) Jake Hofman (Columbia University) Introduction and Overview January 20, 2017 52 / 53
  • 78.
    1. Ask goodquestions There’s nothing interesting in the data without them Jake Hofman (Columbia University) Introduction and Overview January 20, 2017 53 / 53
  • 79.
    2. Think beforeyou code 5 minutes at the whiteboard is worth an hour at the keyboard Jake Hofman (Columbia University) Introduction and Overview January 20, 2017 53 / 53
  • 80.
    3. Keep theanswers simple Exploratory data analysis and linear models go a long way Jake Hofman (Columbia University) Introduction and Overview January 20, 2017 53 / 53