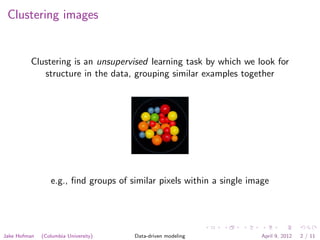
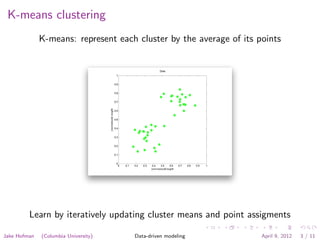
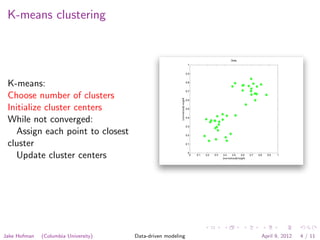
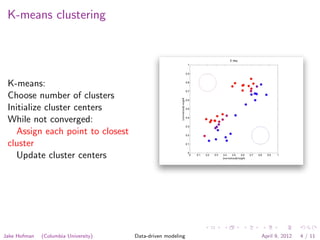
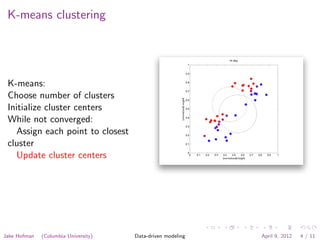
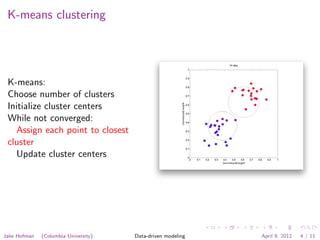
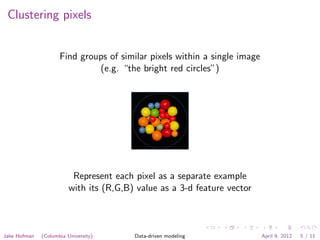
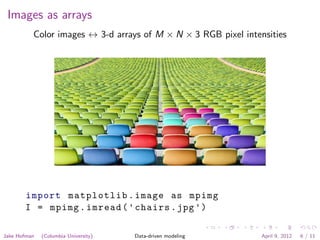
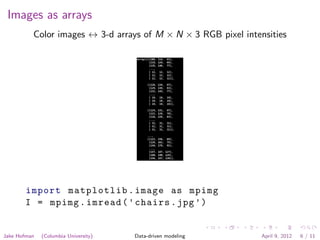
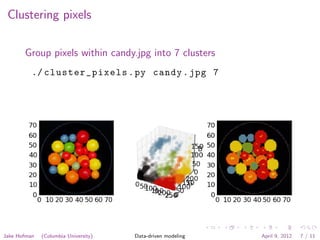
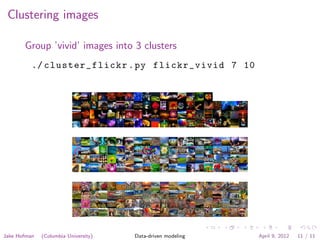
Data-driven modeling
                                           APAM E4990


                                           Jake Hofman

                                          Columbia University


                                           April 9, 2012


Jake Hofman   (Columbia University)        Data-driven modeling   April 9, 2012   1 / 11
Clustering images


         Clustering is an unsupervised learning task by which we look for
            structure in the data, grouping similar examples together


                 e.g., find groups of similar pixels within a single image


Jake Hofman   (Columbia University)   Data-driven modeling             April 9, 2012   2 / 11
Clustering images


         Clustering is an unsupervised learning task by which we look for
            structure in the data, grouping similar examples together


          e.g., find groups of similar images across a collection of images


Jake Hofman   (Columbia University)   Data-driven modeling         April 9, 2012   2 / 11
K-means clustering
              K-means: represent each cluster by the average of its points


         Learn by iteratively updating cluster means and point assigments

Jake Hofman   (Columbia University)   Data-driven modeling           April 9, 2012   3 / 11
K-means clustering


 K-means:
 Choose number of clusters
 Initialize cluster centers
 While not converged:
   Assign each point to closest
 cluster
   Update cluster centers


Jake Hofman   (Columbia University)   Data-driven modeling   April 9, 2012   4 / 11
K-means clustering


 K-means:
 Choose number of clusters
 Initialize cluster centers
 While not converged:
   Assign each point to closest
 cluster
   Update cluster centers


Jake Hofman   (Columbia University)   Data-driven modeling   April 9, 2012   4 / 11
K-means clustering


 K-means:
 Choose number of clusters
 Initialize cluster centers
 While not converged:
   Assign each point to closest
 cluster
   Update cluster centers


Jake Hofman   (Columbia University)   Data-driven modeling   April 9, 2012   4 / 11
K-means clustering


 K-means:
 Choose number of clusters
 Initialize cluster centers
 While not converged:
   Assign each point to closest
 cluster
   Update cluster centers


Jake Hofman   (Columbia University)   Data-driven modeling   April 9, 2012   4 / 11
K-means clustering


 K-means:
 Choose number of clusters
 Initialize cluster centers
 While not converged:
   Assign each point to closest
 cluster
   Update cluster centers


Jake Hofman   (Columbia University)   Data-driven modeling   April 9, 2012   4 / 11
Clustering pixels


                     Find groups of similar pixels within a single image
                              (e.g. “the bright red circles”)


                          Represent each pixel as a separate example
                         with its (R,G,B) value as a 3-d feature vector


Jake Hofman   (Columbia University)      Data-driven modeling              April 9, 2012   5 / 11
Images as arrays
          Color images ↔ 3-d arrays of M × N × 3 RGB pixel intensities


       import matplotlib . image as mpimg
       I = mpimg . imread ( ' chairs . jpg ')

Jake Hofman   (Columbia University)   Data-driven modeling      April 9, 2012   6 / 11
Images as arrays
          Color images ↔ 3-d arrays of M × N × 3 RGB pixel intensities


       import matplotlib . image as mpimg
       I = mpimg . imread ( ' chairs . jpg ')


Jake Hofman   (Columbia University)   Data-driven modeling      April 9, 2012   6 / 11
Clustering pixels

       Group pixels within candy.jpg into 7 clusters
          ./ cluster_pixels . py candy . jpg 7


Jake Hofman   (Columbia University)   Data-driven modeling   April 9, 2012   7 / 11
Clustering images


               Find groups of similar images within a collection of images
                                 (e.g. “warm” photos)


              Represent each image with a binned RGB intensity histogram


Jake Hofman    (Columbia University)   Data-driven modeling          April 9, 2012   8 / 11
Intensity histograms

        Disregard all spatial information, simply count pixels by intensities
               (e.g. lots of pixels with bright green and dark blue)


Jake Hofman   (Columbia University)   Data-driven modeling          April 9, 2012   9 / 11
Intensity histograms


                                How many bins for pixel intensities?


        Too many bins gives a noisy, overly complex representation of
       the data, while using too few bins results in an overly simple one


Jake Hofman   (Columbia University)        Data-driven modeling        April 9, 2012   10 / 11
Clustering images

       Group ’vivid’ images into 3 clusters
          ./ cluster_flickr . py flickr_vivid 7 10


Jake Hofman   (Columbia University)   Data-driven modeling   April 9, 2012   11 / 11

Data-driven modeling: Lecture 10

  • 1.
    Data-driven modeling APAM E4990 Jake Hofman Columbia University April 9, 2012 Jake Hofman (Columbia University) Data-driven modeling April 9, 2012 1 / 11
  • 2.
    Clustering images Clustering is an unsupervised learning task by which we look for structure in the data, grouping similar examples together e.g., find groups of similar pixels within a single image Jake Hofman (Columbia University) Data-driven modeling April 9, 2012 2 / 11
  • 3.
    Clustering images Clustering is an unsupervised learning task by which we look for structure in the data, grouping similar examples together e.g., find groups of similar images across a collection of images Jake Hofman (Columbia University) Data-driven modeling April 9, 2012 2 / 11
  • 4.
    K-means clustering K-means: represent each cluster by the average of its points Learn by iteratively updating cluster means and point assigments Jake Hofman (Columbia University) Data-driven modeling April 9, 2012 3 / 11
  • 5.
    K-means clustering K-means: Choose number of clusters Initialize cluster centers While not converged: Assign each point to closest cluster Update cluster centers Jake Hofman (Columbia University) Data-driven modeling April 9, 2012 4 / 11
  • 6.
    K-means clustering K-means: Choose number of clusters Initialize cluster centers While not converged: Assign each point to closest cluster Update cluster centers Jake Hofman (Columbia University) Data-driven modeling April 9, 2012 4 / 11
  • 7.
    K-means clustering K-means: Choose number of clusters Initialize cluster centers While not converged: Assign each point to closest cluster Update cluster centers Jake Hofman (Columbia University) Data-driven modeling April 9, 2012 4 / 11
  • 8.
    K-means clustering K-means: Choose number of clusters Initialize cluster centers While not converged: Assign each point to closest cluster Update cluster centers Jake Hofman (Columbia University) Data-driven modeling April 9, 2012 4 / 11
  • 9.
    K-means clustering K-means: Choose number of clusters Initialize cluster centers While not converged: Assign each point to closest cluster Update cluster centers Jake Hofman (Columbia University) Data-driven modeling April 9, 2012 4 / 11
  • 10.
    Clustering pixels Find groups of similar pixels within a single image (e.g. “the bright red circles”) Represent each pixel as a separate example with its (R,G,B) value as a 3-d feature vector Jake Hofman (Columbia University) Data-driven modeling April 9, 2012 5 / 11
  • 11.
    Images as arrays Color images ↔ 3-d arrays of M × N × 3 RGB pixel intensities import matplotlib . image as mpimg I = mpimg . imread ( ' chairs . jpg ') Jake Hofman (Columbia University) Data-driven modeling April 9, 2012 6 / 11
  • 12.
    Images as arrays Color images ↔ 3-d arrays of M × N × 3 RGB pixel intensities import matplotlib . image as mpimg I = mpimg . imread ( ' chairs . jpg ') Jake Hofman (Columbia University) Data-driven modeling April 9, 2012 6 / 11
  • 13.
    Clustering pixels Group pixels within candy.jpg into 7 clusters ./ cluster_pixels . py candy . jpg 7 Jake Hofman (Columbia University) Data-driven modeling April 9, 2012 7 / 11
  • 14.
    Clustering images Find groups of similar images within a collection of images (e.g. “warm” photos) Represent each image with a binned RGB intensity histogram Jake Hofman (Columbia University) Data-driven modeling April 9, 2012 8 / 11
  • 15.
    Intensity histograms Disregard all spatial information, simply count pixels by intensities (e.g. lots of pixels with bright green and dark blue) Jake Hofman (Columbia University) Data-driven modeling April 9, 2012 9 / 11
  • 16.
    Intensity histograms How many bins for pixel intensities? Too many bins gives a noisy, overly complex representation of the data, while using too few bins results in an overly simple one Jake Hofman (Columbia University) Data-driven modeling April 9, 2012 10 / 11
  • 17.
    Clustering images Group ’vivid’ images into 3 clusters ./ cluster_flickr . py flickr_vivid 7 10 Jake Hofman (Columbia University) Data-driven modeling April 9, 2012 11 / 11