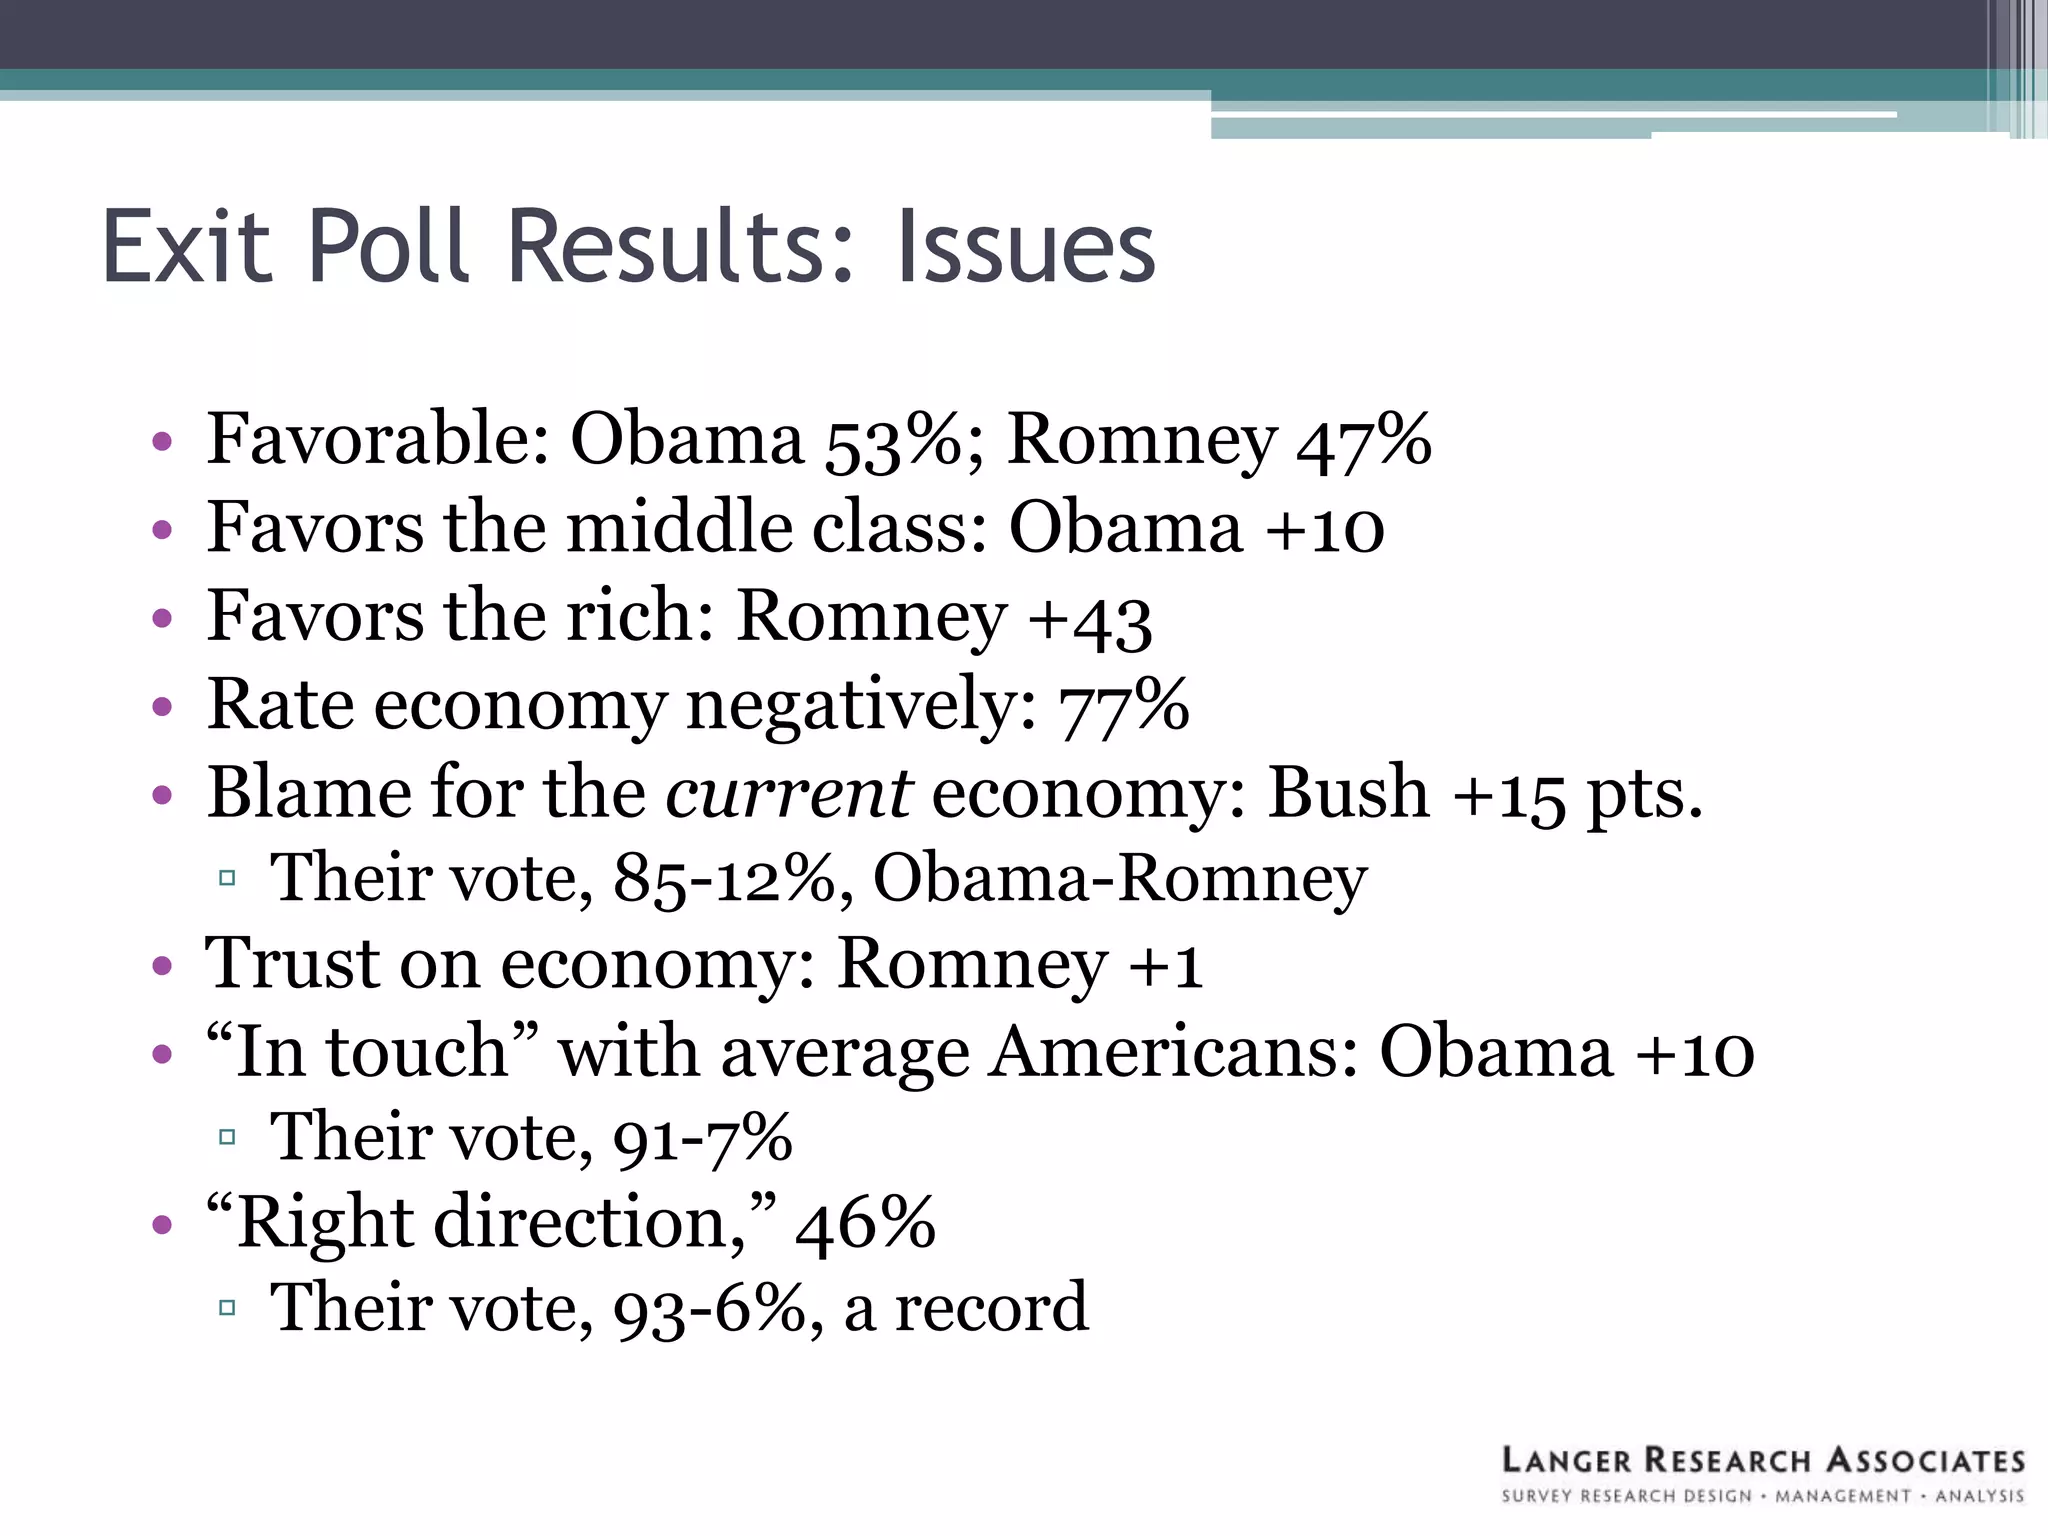
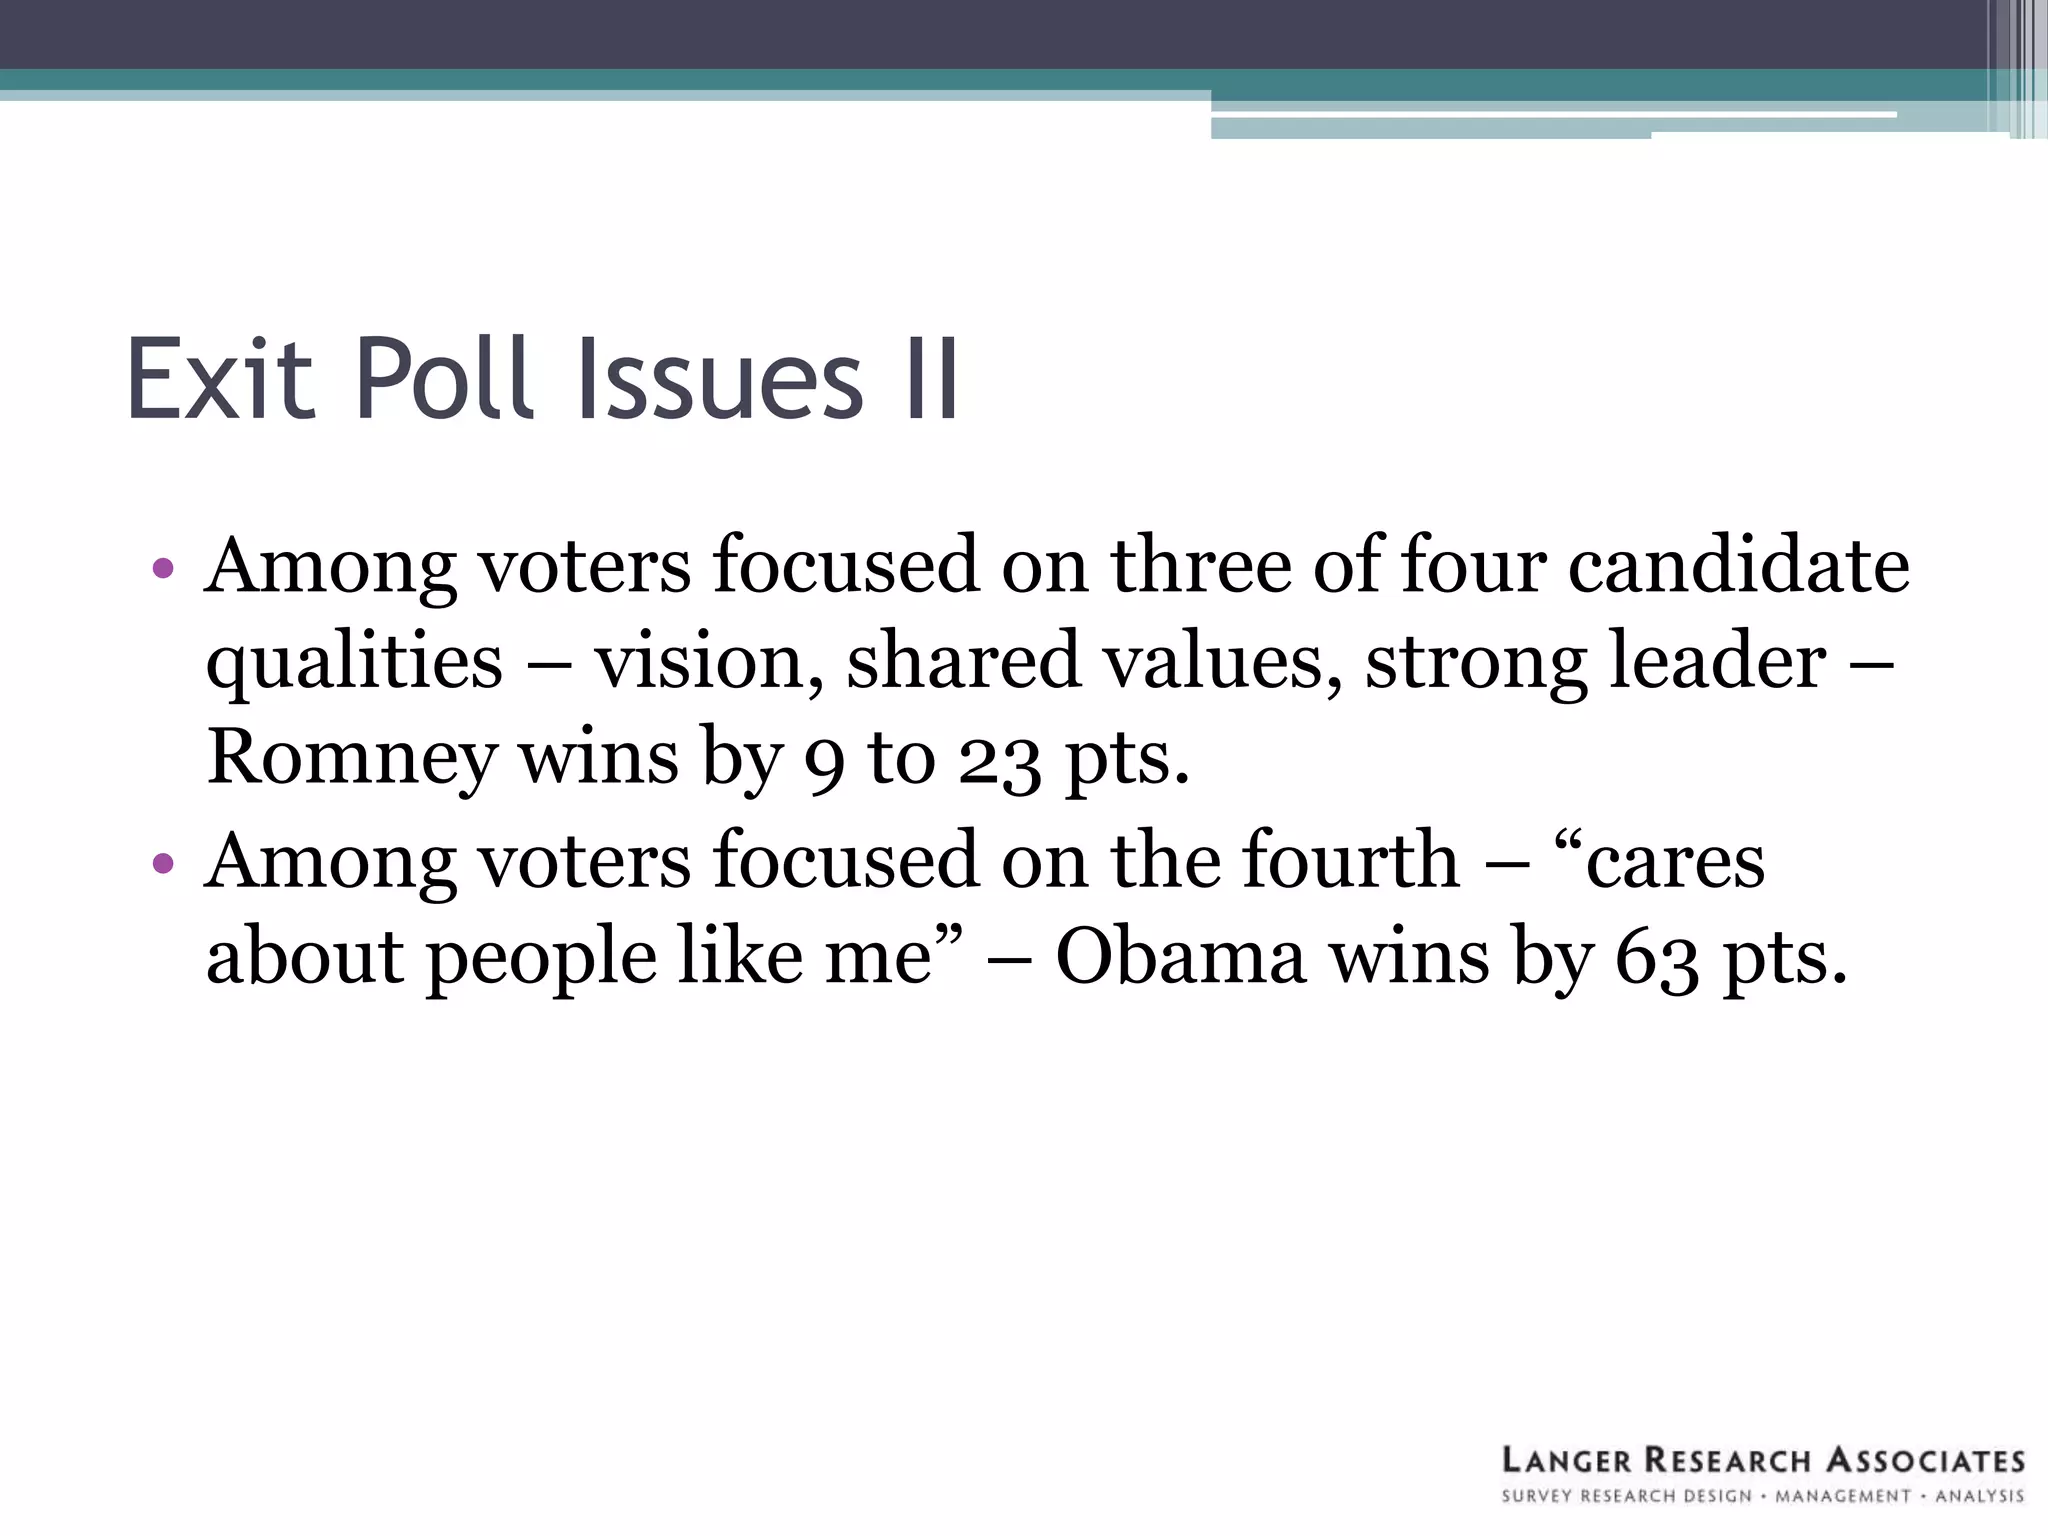
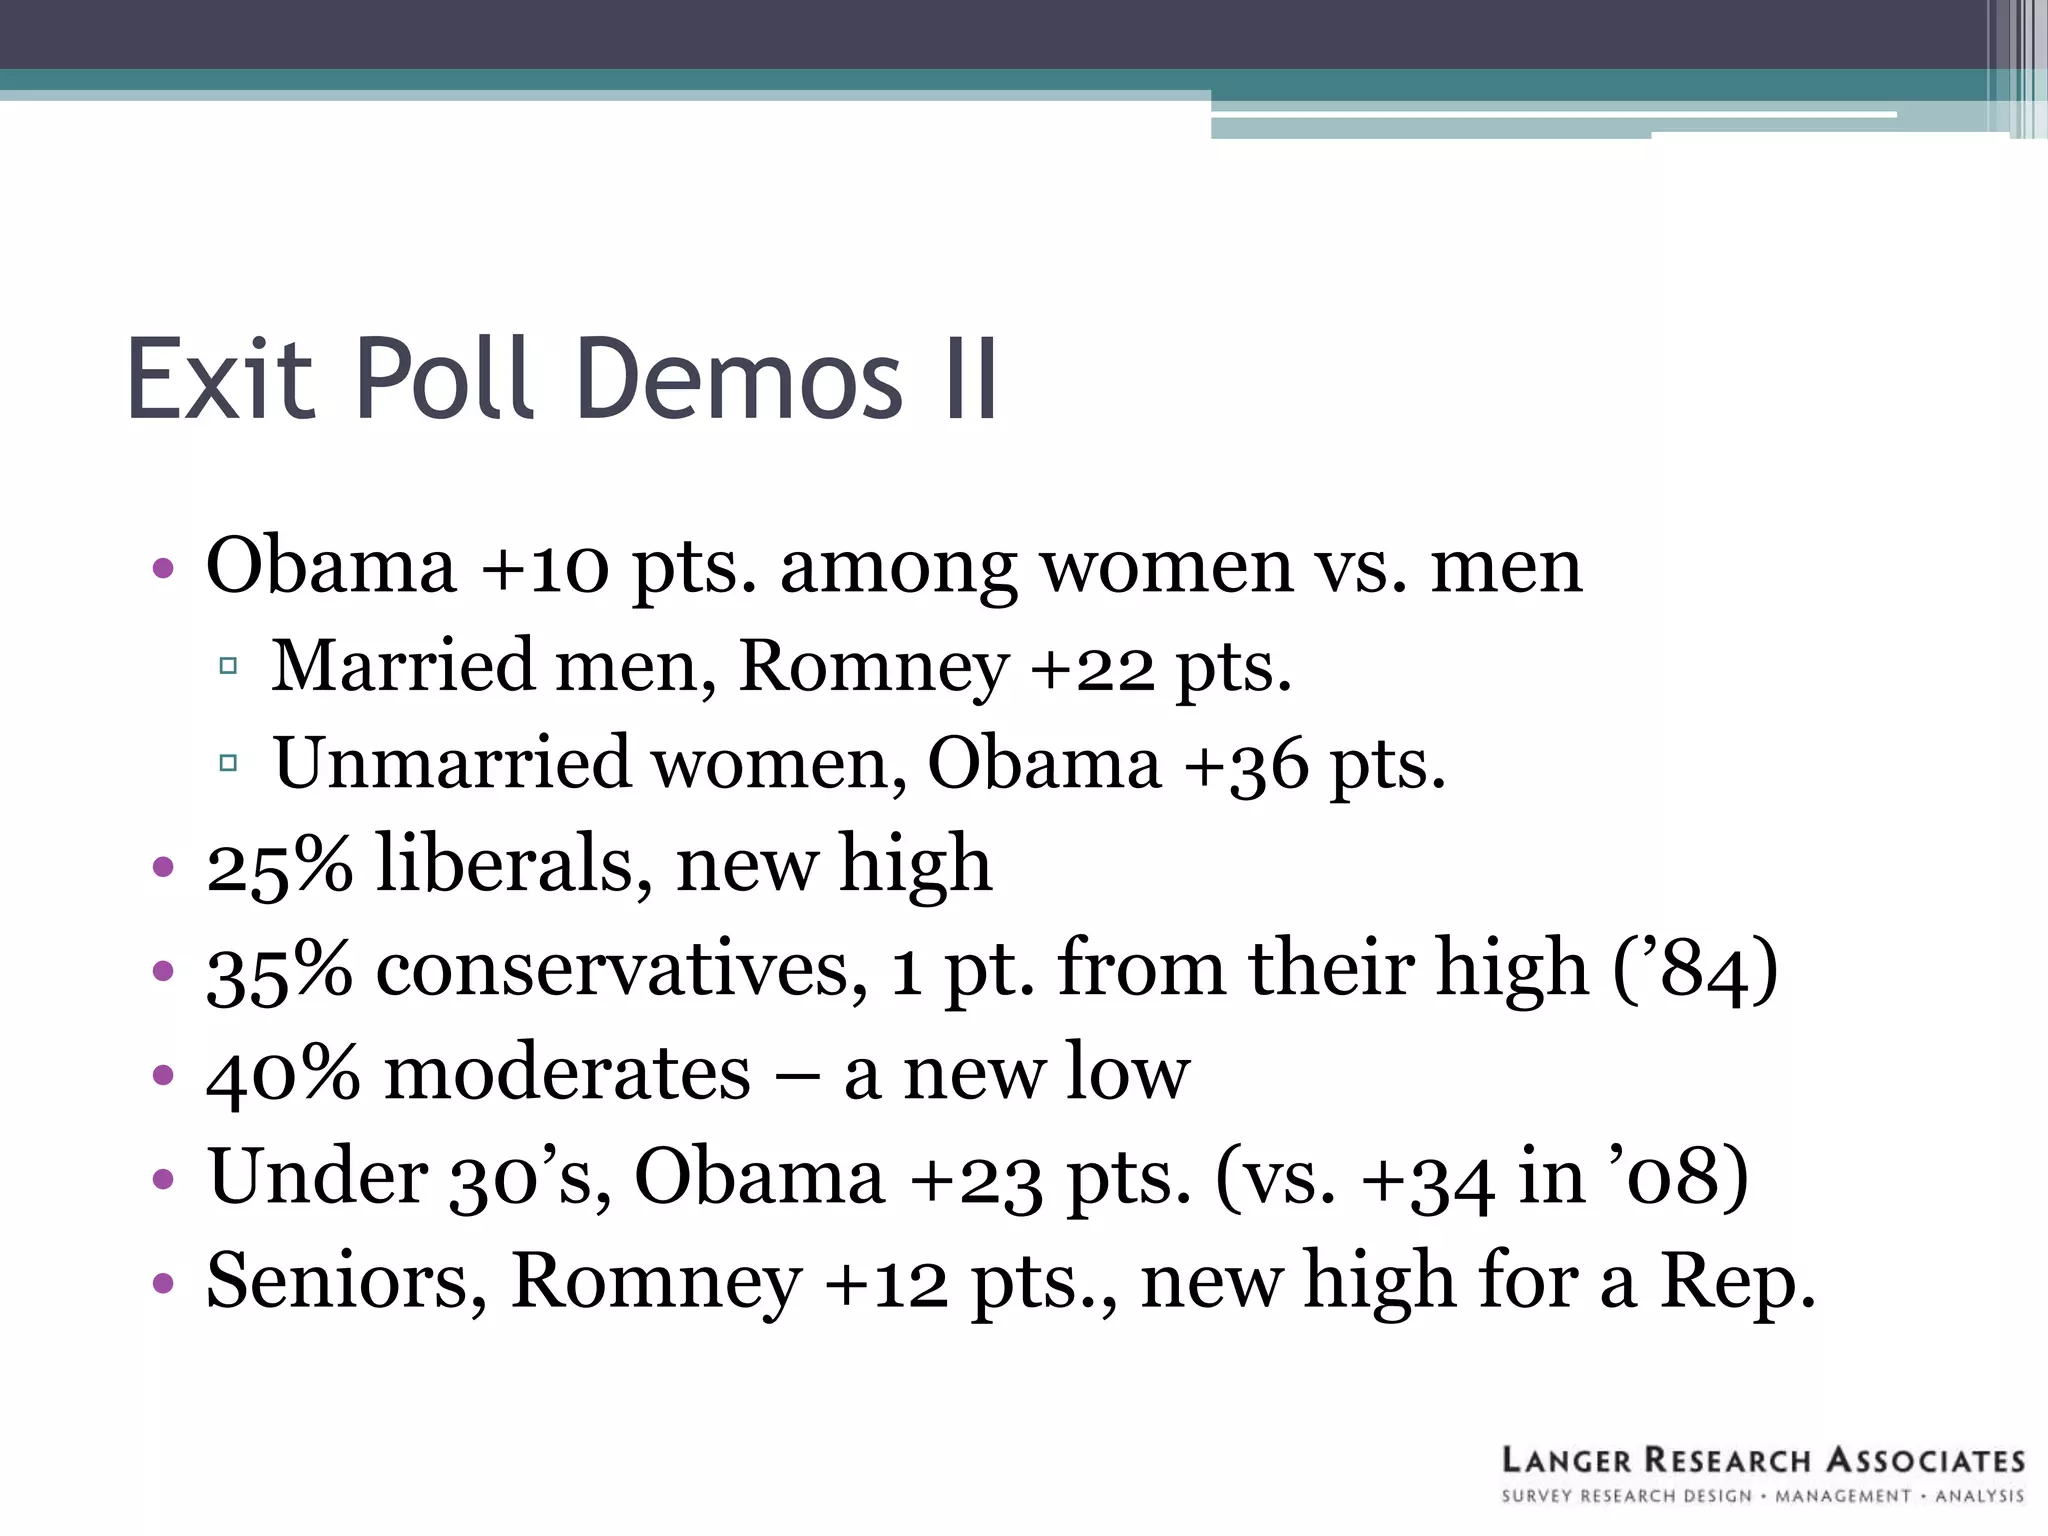
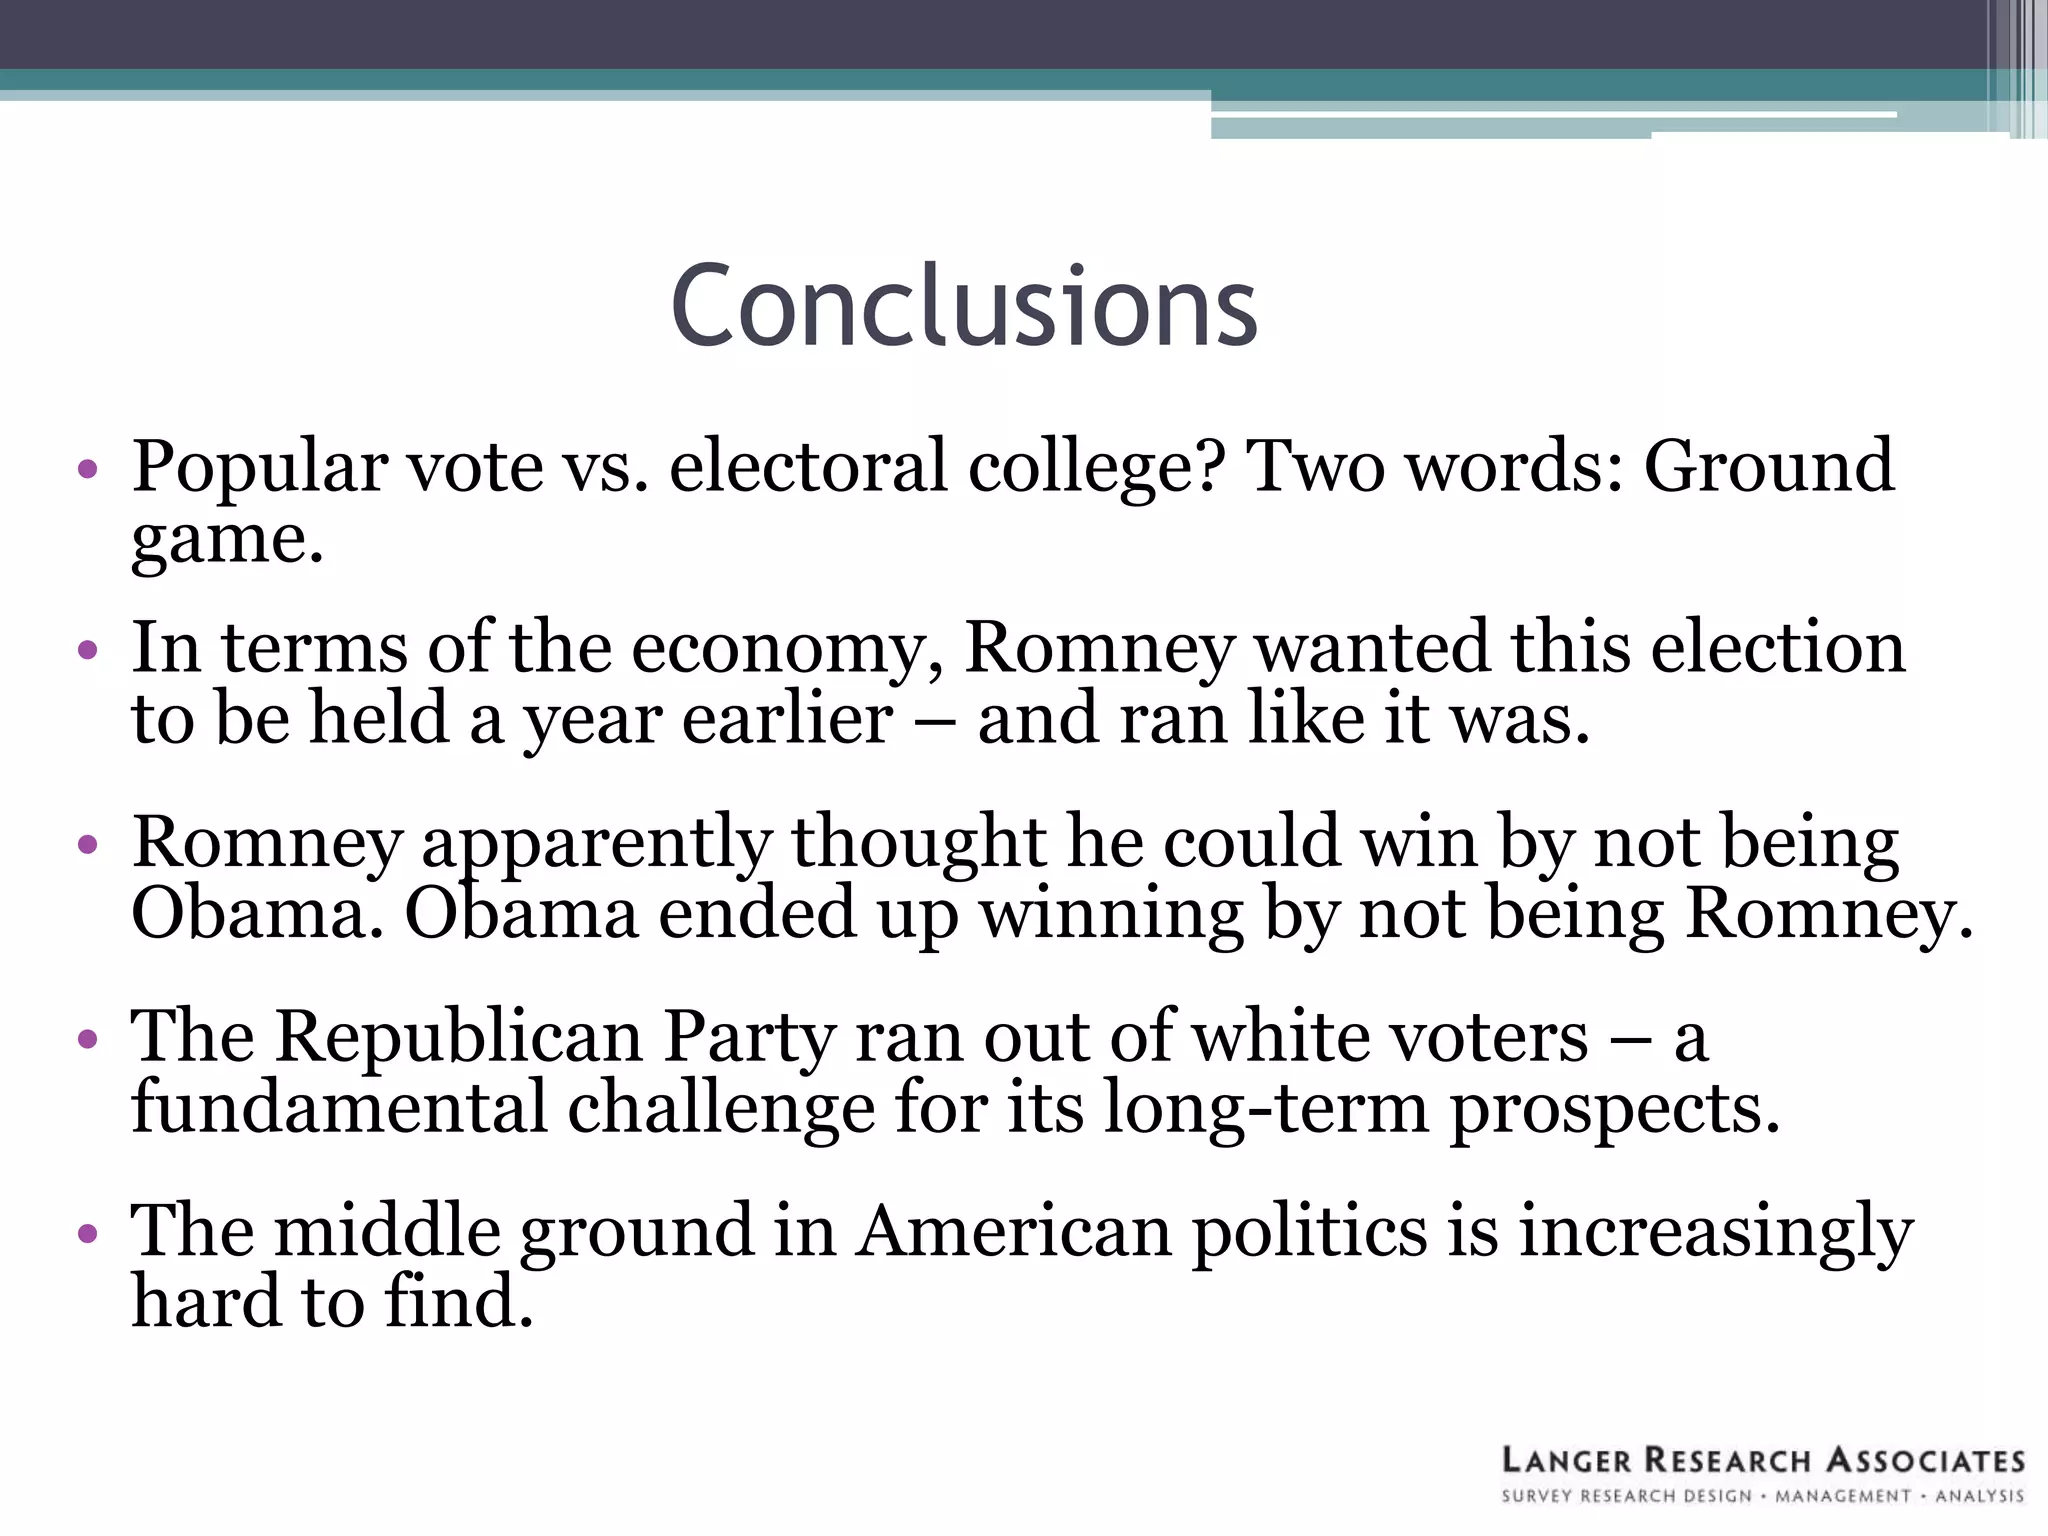
The 2012 Election:
A Different Kind of Country
Gary Langer, Julie Phelan, Greg Holyk & Damla Ergun
Langer Research Associates
@LangerResearch
Backstory 1: Partisanship
Democrats Republicans Independents
The economy
Backstory 2:
Unemployment Rate
Aug. 2008 - present
Bureau of Labor Statistics
10.0
6.1
7.9
U6 Rate
Percent unemployed or marginally attached
Bureau of Labor Statistics
Long-term Unemployment
Average number unemployed for 27 weeks or more, in thousands
Bureau of Labor Statistics
Real median weekly earnings
1979-2009
Bureau of Labor Statistics
No college degree
Bachelor’s degree and higher
71.5% of the U.S.
Population
The peeve it produces
0%
10%
20%
30%
40%
50%
60%
70%
80%
90%
100%
Dissatisfied Angry NET Negative
Feelings Toward Government
ABC News/Washington Post polls
-55
-45
-35
-25
-15
-5
5
15
25
35
45
2010200820062004200220001998199619941992199019881986
CCI yearly average
Re-election rate
Yearly CCI and House Re-election Rate
Correlation: .75
Backstory 3:
Who comes to the party?
90% 89% 88%
85%
87%
83%
81%
77%
74%
10% 11% 12%
15%
13%
17%
19%
23%
26%
1976 1980 1984 1988 1992 1996 2000 2004 2008
Racial Composition of the Electorate
National exit poll data
White Nonwhite
90%
8%
2%
1976 Election
White Black Latino
74%
13%
9%
2%
2008 Election
White Black Latino Asian
The Changing Electorate
National exit poll data
43%-55%
47%-52%
51%
66%
47%
32%
20%
30%
40%
50%
60%
70%
80%
1976 1980 1984 1988 1992 1996 2000 2004 2008
Dem. candidate GOP candidate
Vote Choice Among Young Voters (18-29)
National exit poll data
50% 49%
50%
56%
20%
30%
40%
50%
60%
70%
80%
1976 1980 1984 1988 1992 1996 2000 2004 2008
Men Women
Gender Gap: % Vote for Democrat
National exit poll data
Average Dem gender gap: +8% pts.
41%
39%
25%
32%
20%
25%
30%
35%
40%
45%
50%
1976 1980 1984 1988 1992 1996 2000 2004 2008
Democrat Republican
Partisan Affiliation
National exit poll data
So, let’s have an election.
The perplex: Why not worse?
• A strong base in partisan times
• Personal popularity
• What came before
• The comparative nature of election politics
49% 49%50% 51%
0%
10%
20%
30%
40%
50%
60%
70%
80%
90%
100%
If Obama is re-elected If Romney is elected
Confident Not confident
Confident the Economy Will Get Back on Track
Among registered voters
ABC News/Washington Post poll
The zeitgeist and the gaffe
• Son of a former chairman of General Motors and
governor of Michigan
• Attained vast wealth as a buyout specialist
• Estates, car elevator, Swiss account, 14% tax rate
• And the gaffe…
"There are 47 percent of the people who will vote
for the president no matter what. All right, there
are 47 percent who are with him, who are
dependent upon government, who believe that
they are victims, who believe the government has
a responsibility to care for them, who believe that
they are entitled to health care, to food, to
housing, to you-name-it. ... My job is not to worry
about those people. I'll never convince them they
should take personal responsibility and care for
their lives."
56%
34%
0%
10%
20%
30%
40%
50%
60%
70%
80%
Unfairness in the economic system that favors the wealthyOver-regulation of the free market that interferes with growth and pros
Bigger Problem: Unfairness or Over-Regulation
ABC News/Washington Post poll
Romney:
Additional challenges…
55%
47%
41%
47%
0%
10%
20%
30%
40%
50%
60%
70%
80%
Obama Romney
Yes No
Honest and Trustworthy?
Among likely voters
ABC News/Washington Post poll
43%
32%
53%
63%
0%
10%
20%
30%
40%
50%
60%
70%
80%
90%
100%
Obama Romney
Has done enough Has not done enough
Has Provided Enough Policy Details
Among registered voters
ABC News/Washington Post poll
…and opportunities
59%
69%
16%
35%
18%
73%
0%
10%
20%
30%
40%
50%
60%
70%
80%
90%
100%
110%
What you prefer What you think Romney
prefers
What you think Obama
prefers
Smaller government with fewer services
Larger government with more services
Views on Size of Government
Among registered voters
ABC News/Washington Post poll
69%
84%
0%
10%
20%
30%
40%
50%
60%
70%
80%
90%
100%
Plenty of jobs available
Jobs are difficult to find
Job Opportunities In Your Area
ABC News/Washington Post, Pew, and U.S. News & World Reports polls
Jobs very difficult to find:
49% in July ’11; 32% in Oct. ’12
72%
52%
26%
23%
45%
69%
0%
10%
20%
30%
40%
50%
60%
70%
80%
90%
100%
Plenty available Somewhat difficult to find Very difficult to find
Obama Romney
Vote Preference
by Job Availability
Among likely voters
ABC News/Washington Post poll
Debates and dynamics
Early contact - efficiency
• Aug. 25
▫ Obama supporters contacted by Obama campaign:
31%
▫ Romney supporters contacted by Romney campaign:
18%
• By Nov. 5
▫ Even, at just fewer than four in 10 apiece
Oct. 29, 2012
Blowin’ in the Wind?
• Approval of Obama’s response: 79%
• Trust Obama more to handle a major crisis
▫ Oct. 13: 52%; Nov. 3: 52%
• Obama, “stronger leader”
▫ Oct. 13: 49%; Nov. 4: 50%
• Obama job performance: “Strongly” approve
▫ Oct. 30: 30%; Nov. 4: 35%
• Average gap closest in data since 1936
• First contest since 1960 in which
neither candidate exceeded 50%
Nu?
Exit Poll Results: Issues
• Favorable: Obama 53%; Romney 47%
• Favors the middle class: Obama +10
• Favors the rich: Romney +43
• Rate economy negatively: 77%
• Blame for the current economy: Bush +15 pts.
▫ Their vote, 85-12%, Obama-Romney
• Trust on economy: Romney +1
• “In touch” with average Americans: Obama +10
▫ Their vote, 91-7%
• “Right direction,” 46%
▫ Their vote, 93-6%, a record
Exit Poll Issues II
• Among voters focused on three of four candidate
qualities – vision, shared values, strong leader –
Romney wins by 9 to 23 pts.
• Among voters focused on the fourth – “cares
about people like me” – Obama wins by 63 pts.
Exit Poll Results - Demographics
• Whites: 72% of the electorate, a new low
▫ Romney +20 pts.
• Blacks 13%, as ’08. Hispanics 10%, 1st double-digit
▫ Obama +87 pts. among blacks
▫ Obama +44 pts. among Hispanics
• Democrats +6 pts. vs. Republicans
▫ 92% of Dems for Obama, record
▫ 93% of Reps for Romney, ties record
▫ Independents +5 for Romney; no swing
Exit Poll Demos II
• Obama +10 pts. among women vs. men
▫ Married men, Romney +22 pts.
▫ Unmarried women, Obama +36 pts.
• 25% liberals, new high
• 35% conservatives, 1 pt. from their high (’84)
• 40% moderates – a new low
• Under 30’s, Obama +23 pts. (vs. +34 in ’08)
• Seniors, Romney +12 pts., new high for a Rep.
Conclusions
• Popular vote vs. electoral college? Two words: Ground
game.
• In terms of the economy, Romney wanted this election
to be held a year earlier – and ran like it was.
• Romney apparently thought he could win by not being
Obama. Obama ended up winning by not being Romney.
• The Republican Party ran out of white voters – a
fundamental challenge for its long-term prospects.
• The middle ground in American politics is increasingly
hard to find.
Thank you!
Gary Langer
Langer Research Associates
glanger@langerresearch.com

AAPOR 2013 Langer Research: Election

Editor's Notes

  • #2 Logos, layout
  • #18 note these are annual averages.peak monthly value was 17.4% in Oct. 2009
  • #19 again, annual averages.
  • #20 No update available, right? right.
  • #40 Thought you might want to add in this one somewhere too. The air of inevitability.Also could note that a fifth (20%) of Republicans thought Obama was going to win, as did nearly three in 10 conservatives (28%). – this from the last data point in the chart.
  • #41 Cut or move up?
  • #48 Added 10/16/12 JP.
  • #55 First debate: Oct 3. Second debate: Oct 16. Third debate: Oct 22.