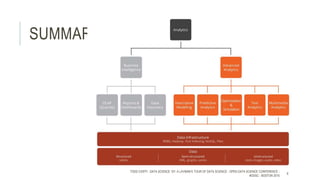
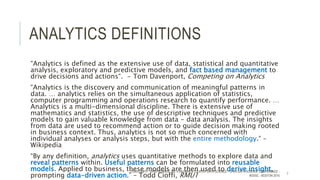
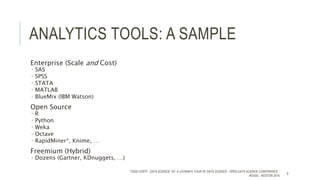
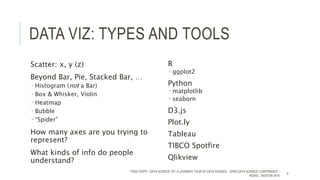
DATA SCIENCE 101 A Layman’s Tour of Data
Science with Todd Cioffi
O P E N
D A T A
S C I E N C E
C O N F E R E N C E_
BOSTON 2015
@opendatasci
opendatascicon.com
GOALS FOR THE SESSION:
 Introduce Terminology
 Explain Concepts
 Get You Comfortable
– Understand the conversation
– Even if you don’t know how to do it
TODD CIOFFI - DATA SCIENCE 101: A LAYMAN’S TOUR OF DATA SCIENCE - OPEN DATA SCIENCE CONFERENCE -
#ODSC - BOSTON 2015
2
BIG PICTURE
Infrastructure
Big Data: “The 3 (or 4…) Vs”
 Volume
 Velocity
 Variety
Internet of Things (IoT)
Cloud
 NIST in a nutshell
 Requestable
 Available
 Shareable
 Scalable
 Measurable
 IaaS / PaaS / SaaS (vs. SAS) / *aaS
 Plan for Failure
Math
Business Intelligence (BI)
Business Analytics
Data Analytics
xxx Analytics**
Code
Machine Learning
Data Mining
Deep Learning
Data Visualization
: A Business Model, not a
Technology
TODD CIOFFI - DATA SCIENCE 101: A LAYMAN’S TOUR OF DATA SCIENCE - OPEN DATA SCIENCE CONFERENCE -
#ODSC - BOSTON 2015
3
DATA
Traditional (‘70s) - RDBMS
 Controlled Input
 Controlled Structure
 SQL: Structured Query Language
 ACID
 Atomic
 Consistent
 Isolated
 Durable
 “Real Time”
 A fiction
Today
 Democratized Input
 Flexible Structure
 NoSQL
 MongoDB / Cassandra / …
 Text
 XML /JSON / XBRL / …
 Multimedia: Images, Audio, Video
 Hadoop: MapReduce^ / Pig / Hive / Flume / …
 Spark / Storm / Kafka / …
 Graph DBs, Semantic Web, …
 CAP Theorem
 Consistency, Availability, Partition tolerance
 BASE
 Basically Available, Soft state, Eventually consistent
 Idempotence: once or many = same resultant state
 Plan for FailureTODD CIOFFI - DATA SCIENCE 101: A LAYMAN’S TOUR OF DATA SCIENCE - OPEN DATA SCIENCE CONFERENCE -
#ODSC - BOSTON 2015
4
STAGES OF ANALYTICS
Descriptive
 What happened?
Predictive
 What is going to happen?
Prescriptive
 How do we influence what is going to happen?
 What do we do?
TODD CIOFFI - DATA SCIENCE 101: A LAYMAN’S TOUR OF DATA SCIENCE - OPEN DATA SCIENCE CONFERENCE -
#ODSC - BOSTON 2015
5
SUMMARY
TODD CIOFFI - DATA SCIENCE 101: A LAYMAN’S TOUR OF DATA SCIENCE - OPEN DATA SCIENCE CONFERENCE -
#ODSC - BOSTON 2015
6
ANALYTICS DEFINITIONS
“Analytics is defined as the extensive use of data, statistical and quantitative
analysis, exploratory and predictive models, and fact based management to
drive decisions and actions“. - Tom Davenport, Competing on Analytics
“Analytics is the discovery and communication of meaningful patterns in
data. … analytics relies on the simultaneous application of statistics,
computer programming and operations research to quantify performance. …
Analytics is a multi-dimensional discipline. There is extensive use of
mathematics and statistics, the use of descriptive techniques and predictive
models to gain valuable knowledge from data - data analysis. The insights
from data are used to recommend action or to guide decision making rooted
in business context. Thus, analytics is not so much concerned with
individual analyses or analysis steps, but with the entire methodology.“ –
Wikipedia
“By any definition, analytics uses quantitative methods to explore data and
reveal patterns within. Useful patterns can be formulated into reusable
models. Applied to business, these models are then used to derive insight,
prompting data-driven action.” – Todd Cioffi, RMU1
TODD CIOFFI - DATA SCIENCE 101: A LAYMAN’S TOUR OF DATA SCIENCE - OPEN DATA SCIENCE CONFERENCE -
#ODSC - BOSTON 2015
7
ANALYTICS TOOLS: A SAMPLE
Enterprise (Scale and Cost)
 SAS
 SPSS
 STATA
 MATLAB
 BlueMix (IBM Watson)
Open Source
 R
 Python
 Weka
 Octave
 RapidMiner*, Knime, …
Freemium (Hybrid)
 Dozens (Gartner, KDnuggets, …)
TODD CIOFFI - DATA SCIENCE 101: A LAYMAN’S TOUR OF DATA SCIENCE - OPEN DATA SCIENCE CONFERENCE -
#ODSC - BOSTON 2015
8
DATA VIZ: TYPES AND TOOLS
Scatter: x, y (z)
Beyond Bar, Pie, Stacked Bar, …
 Histogram (not a Bar)
 Box & Whisker, Violin
 Heatmap
 Bubble
 “Spider”
How many axes are you trying to
represent?
What kinds of info do people
understand?
R
 ggplot2
Python
 matplotlib
 seaborn
D3.js
Plot.ly
Tableau
TIBCO Spotfire
Qlikview
TODD CIOFFI - DATA SCIENCE 101: A LAYMAN’S TOUR OF DATA SCIENCE - OPEN DATA SCIENCE CONFERENCE -
#ODSC - BOSTON 2015
9
FAMOUS DATA VIZ THRU HISTORY
Snow and Cholera
Nightingale and the Crimea
Minard and Napoleon
Edward Tufte
TODD CIOFFI - DATA SCIENCE 101: A LAYMAN’S TOUR OF DATA SCIENCE - OPEN DATA SCIENCE CONFERENCE -
#ODSC - BOSTON 2015
10
CRISP-DM
CRoss
Industry
Standard
Process for
Data
Mining
“CRISP”
TODD CIOFFI - DATA SCIENCE 101: A LAYMAN’S TOUR OF DATA SCIENCE - OPEN DATA SCIENCE CONFERENCE -
#ODSC - BOSTON 2015
11
CRISP: DRILL DOWN
Business Understanding:
 Business Objectives
Why are we doing this?
What are we trying to achieve?
 Data Mining Goals
 Definition of success criteria
TODD CIOFFI - DATA SCIENCE 101: A LAYMAN’S TOUR OF DATA SCIENCE - OPEN DATA SCIENCE CONFERENCE -
#ODSC - BOSTON 2015
12
CRISP: DRILL DOWN
Data Understanding:
We need to understand the data that we will be using:
 EDA: Exploratory Data Analysis
 What attributes did we collect as data? Customers? Patients?
Events? …
 How are those attributes coded? What do our data points mean?
 How is our data quality?
 How, where, why, and by whom our data was collected may be
important.
 The data that we didn’t collect may also be relevant.
 Data exploration might reveal unexpected, even surprising,
properties.
 Relative importance of various attributesTODD CIOFFI - DATA SCIENCE 101: A LAYMAN’S TOUR OF DATA SCIENCE - OPEN DATA SCIENCE CONFERENCE -
#ODSC - BOSTON 2015
13
CRISP: DRILL DOWN
Data Preparation:
Once we have a handle on our data, we need to prepare it for the
Modeling step. This is where we shape and transform our data into
the appropriate usable format. This includes: selecting columns,
sampling rows, deriving new or compound variables, filtering data,
and merging data sources.
• The representation of data is a key to success. The wrong
representation can hide important patterns.
• Different Modeling approaches need different data representations.
• As we learn more, and/or try new models, we might come back to
this step.
• Expect to spend time on this phase - almost always more than half,
and sometimes even 90%, of total analysis time should be allocatedTODD CIOFFI - DATA SCIENCE 101: A LAYMAN’S TOUR OF DATA SCIENCE - OPEN DATA SCIENCE CONFERENCE -
#ODSC - BOSTON 2015
14
CRISP: DRILL DOWN
Modeling:
This is where we search for patterns in our data. These patterns
winnow out unnecessary data and characterize the influence of
attributes that matter.
From these patterns, we can create a model that is not only
descriptive, but predictive.
• There are many different kinds of models, each looking at the data
from a different perspective.
• We may want to try different models, and different parameters
within algorithms, to find our best results.
TODD CIOFFI - DATA SCIENCE 101: A LAYMAN’S TOUR OF DATA SCIENCE - OPEN DATA SCIENCE CONFERENCE -
#ODSC - BOSTON 2015
15
CRISP: DRILL DOWN
The Evaluation phase looks in two directions:
We need to validate our model from the prior CRISP-DM step.
 Precision, applicability, and understandability are all parts of a trade-off
 Understandable models giving deeper insights are often preferred over more
accurate models.
We also need to evaluate our progress towards our business goals.
 Does this model help us meet our success criteria?
 Does new insight here funnel back into our business understanding?
 Should we loop through CRISP-DM again with our new information?
TODD CIOFFI - DATA SCIENCE 101: A LAYMAN’S TOUR OF DATA SCIENCE - OPEN DATA SCIENCE CONFERENCE -
#ODSC - BOSTON 2015
16
CRISP: DRILL DOWN
Deployment:
Once we have results that meet our goals, we need to put them into
use, otherwise the effort is lost.
• At any point in the process, we could take our results and gain new
Business Understanding, creating an opportunity to cycle through the
CRISP-DM model again, gaining even more value from our data
Models age…
TODD CIOFFI - DATA SCIENCE 101: A LAYMAN’S TOUR OF DATA SCIENCE - OPEN DATA SCIENCE CONFERENCE -
#ODSC - BOSTON 2015
17
MODELING: THE FUN BITS
We want to find patterns in our data, then use these patterns to predict outcomes.
How does that happen?
By analyzing our data, we can derive a set of “rules” or a “formula” that describes
some behavior.
 Examples like “this” tended to fall into this pile. Examples like “that” tended to fall into that pile..
Collectively, the rules we assemble are called a model.
The process of finding and deriving the model is called training.
The data used for training is called training data.
Once we have established our pattern - or model - we can run similar examples
through our rules and predict where they would fall. This is called model application
or applying the model.
Example: based on this customer’s profile, knowing what we know, do we expect
churn or no churn? We could then take that answer and decide whether to take
action in order to hold them.
There are many different approaches used to search for patterns in data. We will see
a handful of them in this session.
When any approach gets developed to the point where it can be described with a
TODD CIOFFI - DATA SCIENCE 101: A LAYMAN’S TOUR OF DATA SCIENCE - OPEN DATA SCIENCE CONFERENCE -
#ODSC - BOSTON 2015
18
SO LET’S GET STARTED WITH
MODELING…
TODD CIOFFI - DATA SCIENCE 101: A LAYMAN’S TOUR OF DATA SCIENCE - OPEN DATA SCIENCE CONFERENCE -
#ODSC - BOSTON 2015
19
WHAT IS A COYOTE?
Your six-year old nephew thinks that there are only five kinds of
animals:
1) Kitty
2) Puppy
3) Horsey
4) Birdie
5) Fishie
What does he think a coyote is?
Why?
TODD CIOFFI - DATA SCIENCE 101: A LAYMAN’S TOUR OF DATA SCIENCE - OPEN DATA SCIENCE CONFERENCE -
#ODSC - BOSTON 2015
20
K-NEAREST NEIGHBOR
k-Nearest Neighbor (k-NN) is a very intuitive approach:
 To find out what something is like, see what the things closest to it are like.
Two key questions:
What is “near”?
 Euclidean Distance
 Cosine Similarity
 Manhattan Distance
Which neighbors? How many?
 K many…
TODD CIOFFI - DATA SCIENCE 101: A LAYMAN’S TOUR OF DATA SCIENCE - OPEN DATA SCIENCE CONFERENCE -
#ODSC - BOSTON 2015
21
WHICH DOT IS CLOSER?
10-3
106TODD CIOFFI - DATA SCIENCE 101: A LAYMAN’S TOUR OF DATA SCIENCE - OPEN DATA SCIENCE CONFERENCE -
#ODSC - BOSTON 2015
22
How about
now?
NORMALIZATION
Orders of Magnitude
 Also consider significant digits
Range
Z-Transform
Leaking data: Norm is also a model
TODD CIOFFI - DATA SCIENCE 101: A LAYMAN’S TOUR OF DATA SCIENCE - OPEN DATA SCIENCE CONFERENCE -
#ODSC - BOSTON 2015
23
K-NN IN YOUR HEAD…
K = 1
Train on full data set
How accurate?
What did we learn?
Why?
TODD CIOFFI - DATA SCIENCE 101: A LAYMAN’S TOUR OF DATA SCIENCE - OPEN DATA SCIENCE CONFERENCE -
#ODSC - BOSTON 2015
24
OVERFIT
The purpose of modeling is
to find a generalizable
pattern that will tell you
about new data.
If your model fits your
current data too closely, it
loses general utility.
Kaggle Titanic
 what about “new” passengers?
TODD CIOFFI - DATA SCIENCE 101: A LAYMAN’S TOUR OF DATA SCIENCE - OPEN DATA SCIENCE CONFERENCE -
#ODSC - BOSTON 2015
25
TESTING & VALIDATION
So how do we plan for “new” data when we’re working with one set of
current data?
Hold-Out or Split validation
Cross-Validation
Leave One Out
TODD CIOFFI - DATA SCIENCE 101: A LAYMAN’S TOUR OF DATA SCIENCE - OPEN DATA SCIENCE CONFERENCE -
#ODSC - BOSTON 2015
26
CONFUSION MATRIX
Performance Measures
 Accuracy / Error
 What is the value of knowing the ratio of the number right (or wrong) of the total?
 Precision / Recall
 “You have cancer...”
 Precision: how many with positive tests actually have cancer?
 Recall: how many with cancer tested positive?
 Sensitivity / Specificity
 “You have cancer...”
 Sensitivity: how many with cancer tested positive? (see: recall)
 Specificity: how many without cancer tested negative?
 Here is a handy URL to know:
http://www.damienfrancois.be/blog/files/modelperfcheatsheet.pdf
+ -
+’ A B
-’ C D
TODD CIOFFI - DATA SCIENCE 101: A LAYMAN’S TOUR OF DATA SCIENCE - OPEN DATA SCIENCE CONFERENCE -
#ODSC - BOSTON 2015
27
TODD CIOFFI - DATA SCIENCE 101: A LAYMAN’S TOUR OF DATA SCIENCE - OPEN DATA SCIENCE CONFERENCE -
#ODSC - BOSTON 2015
28
CONFUSION MATRIX, ARRANGED
Reality
Predicted
+ -
+’ A B
-’ C D
Accuracy = (A+D) / (A+B+C+D)
Error = (B+C) / (A+B+C+D)
or 1 – ( (A+D) / (A+B+C+D) )
Precision = A / (A+B)
Recall = A / (A+C)
Specificity = D / (D+B)
= Sensitivity
You have Cancer...
HTTP://WWW.DAMIENFRANCOIS.BE/BLOG/FILES/MODELPERFCHEATSHEET.PDFTODD CIOFFI - DATA SCIENCE 101: A LAYMAN’S TOUR OF DATA SCIENCE - OPEN DATA SCIENCE CONFERENCE -
#ODSC - BOSTON 2015
29
CORRELATION
Meaning:
 Do things tend to move together?
Range
 To what degree?
 Same or opposite?
 -1 … 1
Not meaning
 “Correlation does not equal Causation”
 http://www.tylervigen.com/
TODD CIOFFI - DATA SCIENCE 101: A LAYMAN’S TOUR OF DATA SCIENCE - OPEN DATA SCIENCE CONFERENCE -
#ODSC - BOSTON 2015
30
LINEAR REGRESSION AND OTHER
“LINES”
Y = MX + B
Height / Weight of Dog
y = m1x1 + m2x2 + ... + mnxn + b
Dependent / independent variable
 Cigs / cancer, but not cancer v cigs
SVM: Support Vector Machine
 Line > Plane > Hyperplane
TODD CIOFFI - DATA SCIENCE 101: A LAYMAN’S TOUR OF DATA SCIENCE - OPEN DATA SCIENCE CONFERENCE -
#ODSC - BOSTON 2015
31
FUNNY THING ABOUT LINES:
ANSCOMBE’S QUARTET
I II III IV
x y x y x y x y
10.0 8.04 10.0 9.14 10.0 7.46 8.0 6.58
8.0 6.95 8.0 8.14 8.0 6.77 8.0 5.76
13.0 7.58 13.0 8.74 13.0 12.74 8.0 7.71
9.0 8.81 9.0 8.77 9.0 7.11 8.0 8.84
11.0 8.33 11.0 9.26 11.0 7.81 8.0 8.47
14.0 9.96 14.0 8.10 14.0 8.84 8.0 7.04
6.0 7.24 6.0 6.13 6.0 6.08 8.0 5.25
4.0 4.26 4.0 3.10 4.0 5.39 19.0 12.50
12.0 10.84 12.0 9.13 12.0 8.15 8.0 5.56
7.0 4.82 7.0 7.26 7.0 6.42 8.0 7.91
5.0 5.68 5.0 4.74 5.0 5.73 8.0 6.89
Property (in each case) Value
Mean of x 9 (exact)
Sample variance of x 11 (exact)
Mean of y 7.50 (to 2 places)
Sample variance of y
4.122 or 4.127 (to 3
places)
Correlation between x
and y
0.816 (to 3 places)
Linear regression line
y = 3.00 + 0.500x (to
2 and 3 places,
respectively)
TODD CIOFFI - DATA SCIENCE 101: A LAYMAN’S TOUR OF DATA SCIENCE - OPEN DATA SCIENCE CONFERENCE -
#ODSC - BOSTON 2015
32
ANSCOMBE’S
QUARTET
TODD CIOFFI - DATA SCIENCE 101: A LAYMAN’S TOUR OF DATA SCIENCE - OPEN DATA SCIENCE CONFERENCE -
#ODSC - BOSTON 2015
33
DATA TYPES
Numerical
 Integer
 Real
 Date-time
Nominal
 Binominal (either / or)
 Polynominal (categorical)
 Corpus
Scalar, Ordinal, Categorical
Dummy coding
TODD CIOFFI - DATA SCIENCE 101: A LAYMAN’S TOUR OF DATA SCIENCE - OPEN DATA SCIENCE CONFERENCE -
#ODSC - BOSTON 2015
34
NAIVE BAYES
Bayes: Simple probabilistic counting
Smoke Pop
Men 0.65 0.12 0.0780 +
0.88 0.5720 -
Women 0.35 0.07 0.0245 +
0.93 0.3255 -
1 1 1
Smokers 0.1025
P(W|+) 0.2390
Mor N/S 0.9755
Sun, Wind, Precip > play outside
Example contains a given word
What does that mean about future
examples with same word (or word
combo)?
TODD CIOFFI - DATA SCIENCE 101: A LAYMAN’S TOUR OF DATA SCIENCE - OPEN DATA SCIENCE CONFERENCE -
#ODSC - BOSTON 2015
35
RULES AND TREES
Rule Induction
 +++++++ ------
 ++-- + ++ -+ ---
Decision Trees
Random Forest TODD CIOFFI - DATA SCIENCE 101: A LAYMAN’S TOUR OF DATA SCIENCE - OPEN DATA SCIENCE CONFERENCE -
#ODSC - BOSTON 2015
36
SAMPLING
Rows, Records, Documents, Examples
Spreadsheets think of data in rows. They are using a two-dimensional ledger
(worksheets = 3-D).
Databases use the term records (or documents) to identify the storage of one
item. The display might seem linear, but the metaphor relating to real life is
capturing more. Think of a medical record, a personnel file, or other such
documents. These are even potentially multi-dimensional.
Data Scientists uses the term examples. Whether a research biologist, a
marketer, or political scientist, they are thinking in terms of populations –
cohorts, customers, voters. Out of a given population, each individual is an
example. From those examples, we find patterns.
Linear, Shuffled, Stratified
Kennard-Stone
Over / Under
TODD CIOFFI - DATA SCIENCE 101: A LAYMAN’S TOUR OF DATA SCIENCE - OPEN DATA SCIENCE CONFERENCE -
#ODSC - BOSTON 2015
37
TODD CIOFFI - DATA SCIENCE 101: A LAYMAN’S TOUR OF DATA SCIENCE - OPEN DATA SCIENCE CONFERENCE -
#ODSC - BOSTON 2015
38
CHECKERBOARD SET
TODD CIOFFI - DATA SCIENCE 101: A LAYMAN’S TOUR OF DATA SCIENCE - OPEN DATA SCIENCE CONFERENCE -
#ODSC - BOSTON 2015
39
CHECKERBOARD SET: SAMPLE 0.05
TODD CIOFFI - DATA SCIENCE 101: A LAYMAN’S TOUR OF DATA SCIENCE - OPEN DATA SCIENCE CONFERENCE -
#ODSC - BOSTON 2015
40
CHECKERBOARD SET: SAMPLE 0.05
K-S
TODD CIOFFI - DATA SCIENCE 101: A LAYMAN’S TOUR OF DATA SCIENCE - OPEN DATA SCIENCE CONFERENCE -
#ODSC - BOSTON 2015
41
CHECKERBOARD SET : OVER-
/UNDER-SAMPLE
TODD CIOFFI - DATA SCIENCE 101: A LAYMAN’S TOUR OF DATA SCIENCE - OPEN DATA SCIENCE CONFERENCE -
#ODSC - BOSTON 2015
42
FEATURE SELECTION
In the same way that spreadsheets use 2-
D columns, and databases use data fields
to make up a record, each example in our
population is described by some number
of attributes - also called properties,
variables, or features.
Forward Selection
Backward Elimination
Evolutionary
TODD CIOFFI - DATA SCIENCE 101: A LAYMAN’S TOUR OF DATA SCIENCE - OPEN DATA SCIENCE CONFERENCE -
#ODSC - BOSTON 2015
43
DIMENSIONALITY REDUCTION
Ht/Wt graph
 Food/mo (lbs)
 Toy purchases ($)
 Leash width (mm)
 Property damage ($)
 Stool volume (ml?)
Helmets
Clothes
TODD CIOFFI - DATA SCIENCE 101: A LAYMAN’S TOUR OF DATA SCIENCE - OPEN DATA SCIENCE CONFERENCE -
#ODSC - BOSTON 2015
44
SUPERVISED LEARNING
What does it mean?
Target variable / feature / attribute / label
What else could one do?
Unsupervised learning
AKA Classification and Clustering
Not the same thing, but one can feed the other
TODD CIOFFI - DATA SCIENCE 101: A LAYMAN’S TOUR OF DATA SCIENCE - OPEN DATA SCIENCE CONFERENCE -
#ODSC - BOSTON 2015
45
K-MEANS CLUSTERING
Clustering modeler
Iterative distance-based assessment
• Start w/ Random Seeds
• Assign each point to closest seed
• Move seed to center of cluster
• Lather, rinse, repeat until mean doesn’t move (or oscillates) and clusters don’t
change.
How many clusters?
 k many
Then what happens?
• Could turn cluster assignments into classification labels
TODD CIOFFI - DATA SCIENCE 101: A LAYMAN’S TOUR OF DATA SCIENCE - OPEN DATA SCIENCE CONFERENCE -
#ODSC - BOSTON 2015
46
OUTLIER DETECTION
Distance
Density
LOF: Localized Density
TODD CIOFFI - DATA SCIENCE 101: A LAYMAN’S TOUR OF DATA SCIENCE - OPEN DATA SCIENCE CONFERENCE -
#ODSC - BOSTON 2015
47
SCALE
Began with Big Data
PA at scale – how are algorithms impacted?
Memory and Calculation constraints
TODD CIOFFI - DATA SCIENCE 101: A LAYMAN’S TOUR OF DATA SCIENCE - OPEN DATA SCIENCE CONFERENCE -
#ODSC - BOSTON 2015
48
NO FREE LUNCH
No single algorithm is the “best” for all data sets
Different algorithms are often used in different situations
 Naïve Bayes is common in Spam filters
 Outlier Detection is helpful with Fraud
 Clustering works well for Recommendation engines and identifying other marketing
demos
TODD CIOFFI - DATA SCIENCE 101: A LAYMAN’S TOUR OF DATA SCIENCE - OPEN DATA SCIENCE CONFERENCE -
#ODSC - BOSTON 2015
49

Data Science 101

  • 1.
    DATA SCIENCE 101A Layman’s Tour of Data Science with Todd Cioffi O P E N D A T A S C I E N C E C O N F E R E N C E_ BOSTON 2015 @opendatasci opendatascicon.com
  • 2.
    GOALS FOR THESESSION:  Introduce Terminology  Explain Concepts  Get You Comfortable – Understand the conversation – Even if you don’t know how to do it TODD CIOFFI - DATA SCIENCE 101: A LAYMAN’S TOUR OF DATA SCIENCE - OPEN DATA SCIENCE CONFERENCE - #ODSC - BOSTON 2015 2
  • 3.
    BIG PICTURE Infrastructure Big Data:“The 3 (or 4…) Vs”  Volume  Velocity  Variety Internet of Things (IoT) Cloud  NIST in a nutshell  Requestable  Available  Shareable  Scalable  Measurable  IaaS / PaaS / SaaS (vs. SAS) / *aaS  Plan for Failure Math Business Intelligence (BI) Business Analytics Data Analytics xxx Analytics** Code Machine Learning Data Mining Deep Learning Data Visualization : A Business Model, not a Technology TODD CIOFFI - DATA SCIENCE 101: A LAYMAN’S TOUR OF DATA SCIENCE - OPEN DATA SCIENCE CONFERENCE - #ODSC - BOSTON 2015 3
  • 4.
    DATA Traditional (‘70s) -RDBMS  Controlled Input  Controlled Structure  SQL: Structured Query Language  ACID  Atomic  Consistent  Isolated  Durable  “Real Time”  A fiction Today  Democratized Input  Flexible Structure  NoSQL  MongoDB / Cassandra / …  Text  XML /JSON / XBRL / …  Multimedia: Images, Audio, Video  Hadoop: MapReduce^ / Pig / Hive / Flume / …  Spark / Storm / Kafka / …  Graph DBs, Semantic Web, …  CAP Theorem  Consistency, Availability, Partition tolerance  BASE  Basically Available, Soft state, Eventually consistent  Idempotence: once or many = same resultant state  Plan for FailureTODD CIOFFI - DATA SCIENCE 101: A LAYMAN’S TOUR OF DATA SCIENCE - OPEN DATA SCIENCE CONFERENCE - #ODSC - BOSTON 2015 4
  • 5.
    STAGES OF ANALYTICS Descriptive What happened? Predictive  What is going to happen? Prescriptive  How do we influence what is going to happen?  What do we do? TODD CIOFFI - DATA SCIENCE 101: A LAYMAN’S TOUR OF DATA SCIENCE - OPEN DATA SCIENCE CONFERENCE - #ODSC - BOSTON 2015 5
  • 6.
    SUMMARY TODD CIOFFI -DATA SCIENCE 101: A LAYMAN’S TOUR OF DATA SCIENCE - OPEN DATA SCIENCE CONFERENCE - #ODSC - BOSTON 2015 6
  • 7.
    ANALYTICS DEFINITIONS “Analytics isdefined as the extensive use of data, statistical and quantitative analysis, exploratory and predictive models, and fact based management to drive decisions and actions“. - Tom Davenport, Competing on Analytics “Analytics is the discovery and communication of meaningful patterns in data. … analytics relies on the simultaneous application of statistics, computer programming and operations research to quantify performance. … Analytics is a multi-dimensional discipline. There is extensive use of mathematics and statistics, the use of descriptive techniques and predictive models to gain valuable knowledge from data - data analysis. The insights from data are used to recommend action or to guide decision making rooted in business context. Thus, analytics is not so much concerned with individual analyses or analysis steps, but with the entire methodology.“ – Wikipedia “By any definition, analytics uses quantitative methods to explore data and reveal patterns within. Useful patterns can be formulated into reusable models. Applied to business, these models are then used to derive insight, prompting data-driven action.” – Todd Cioffi, RMU1 TODD CIOFFI - DATA SCIENCE 101: A LAYMAN’S TOUR OF DATA SCIENCE - OPEN DATA SCIENCE CONFERENCE - #ODSC - BOSTON 2015 7
  • 8.
    ANALYTICS TOOLS: ASAMPLE Enterprise (Scale and Cost)  SAS  SPSS  STATA  MATLAB  BlueMix (IBM Watson) Open Source  R  Python  Weka  Octave  RapidMiner*, Knime, … Freemium (Hybrid)  Dozens (Gartner, KDnuggets, …) TODD CIOFFI - DATA SCIENCE 101: A LAYMAN’S TOUR OF DATA SCIENCE - OPEN DATA SCIENCE CONFERENCE - #ODSC - BOSTON 2015 8
  • 9.
    DATA VIZ: TYPESAND TOOLS Scatter: x, y (z) Beyond Bar, Pie, Stacked Bar, …  Histogram (not a Bar)  Box & Whisker, Violin  Heatmap  Bubble  “Spider” How many axes are you trying to represent? What kinds of info do people understand? R  ggplot2 Python  matplotlib  seaborn D3.js Plot.ly Tableau TIBCO Spotfire Qlikview TODD CIOFFI - DATA SCIENCE 101: A LAYMAN’S TOUR OF DATA SCIENCE - OPEN DATA SCIENCE CONFERENCE - #ODSC - BOSTON 2015 9
  • 10.
    FAMOUS DATA VIZTHRU HISTORY Snow and Cholera Nightingale and the Crimea Minard and Napoleon Edward Tufte TODD CIOFFI - DATA SCIENCE 101: A LAYMAN’S TOUR OF DATA SCIENCE - OPEN DATA SCIENCE CONFERENCE - #ODSC - BOSTON 2015 10
  • 11.
    CRISP-DM CRoss Industry Standard Process for Data Mining “CRISP” TODD CIOFFI- DATA SCIENCE 101: A LAYMAN’S TOUR OF DATA SCIENCE - OPEN DATA SCIENCE CONFERENCE - #ODSC - BOSTON 2015 11
  • 12.
    CRISP: DRILL DOWN BusinessUnderstanding:  Business Objectives Why are we doing this? What are we trying to achieve?  Data Mining Goals  Definition of success criteria TODD CIOFFI - DATA SCIENCE 101: A LAYMAN’S TOUR OF DATA SCIENCE - OPEN DATA SCIENCE CONFERENCE - #ODSC - BOSTON 2015 12
  • 13.
    CRISP: DRILL DOWN DataUnderstanding: We need to understand the data that we will be using:  EDA: Exploratory Data Analysis  What attributes did we collect as data? Customers? Patients? Events? …  How are those attributes coded? What do our data points mean?  How is our data quality?  How, where, why, and by whom our data was collected may be important.  The data that we didn’t collect may also be relevant.  Data exploration might reveal unexpected, even surprising, properties.  Relative importance of various attributesTODD CIOFFI - DATA SCIENCE 101: A LAYMAN’S TOUR OF DATA SCIENCE - OPEN DATA SCIENCE CONFERENCE - #ODSC - BOSTON 2015 13
  • 14.
    CRISP: DRILL DOWN DataPreparation: Once we have a handle on our data, we need to prepare it for the Modeling step. This is where we shape and transform our data into the appropriate usable format. This includes: selecting columns, sampling rows, deriving new or compound variables, filtering data, and merging data sources. • The representation of data is a key to success. The wrong representation can hide important patterns. • Different Modeling approaches need different data representations. • As we learn more, and/or try new models, we might come back to this step. • Expect to spend time on this phase - almost always more than half, and sometimes even 90%, of total analysis time should be allocatedTODD CIOFFI - DATA SCIENCE 101: A LAYMAN’S TOUR OF DATA SCIENCE - OPEN DATA SCIENCE CONFERENCE - #ODSC - BOSTON 2015 14
  • 15.
    CRISP: DRILL DOWN Modeling: Thisis where we search for patterns in our data. These patterns winnow out unnecessary data and characterize the influence of attributes that matter. From these patterns, we can create a model that is not only descriptive, but predictive. • There are many different kinds of models, each looking at the data from a different perspective. • We may want to try different models, and different parameters within algorithms, to find our best results. TODD CIOFFI - DATA SCIENCE 101: A LAYMAN’S TOUR OF DATA SCIENCE - OPEN DATA SCIENCE CONFERENCE - #ODSC - BOSTON 2015 15
  • 16.
    CRISP: DRILL DOWN TheEvaluation phase looks in two directions: We need to validate our model from the prior CRISP-DM step.  Precision, applicability, and understandability are all parts of a trade-off  Understandable models giving deeper insights are often preferred over more accurate models. We also need to evaluate our progress towards our business goals.  Does this model help us meet our success criteria?  Does new insight here funnel back into our business understanding?  Should we loop through CRISP-DM again with our new information? TODD CIOFFI - DATA SCIENCE 101: A LAYMAN’S TOUR OF DATA SCIENCE - OPEN DATA SCIENCE CONFERENCE - #ODSC - BOSTON 2015 16
  • 17.
    CRISP: DRILL DOWN Deployment: Oncewe have results that meet our goals, we need to put them into use, otherwise the effort is lost. • At any point in the process, we could take our results and gain new Business Understanding, creating an opportunity to cycle through the CRISP-DM model again, gaining even more value from our data Models age… TODD CIOFFI - DATA SCIENCE 101: A LAYMAN’S TOUR OF DATA SCIENCE - OPEN DATA SCIENCE CONFERENCE - #ODSC - BOSTON 2015 17
  • 18.
    MODELING: THE FUNBITS We want to find patterns in our data, then use these patterns to predict outcomes. How does that happen? By analyzing our data, we can derive a set of “rules” or a “formula” that describes some behavior.  Examples like “this” tended to fall into this pile. Examples like “that” tended to fall into that pile.. Collectively, the rules we assemble are called a model. The process of finding and deriving the model is called training. The data used for training is called training data. Once we have established our pattern - or model - we can run similar examples through our rules and predict where they would fall. This is called model application or applying the model. Example: based on this customer’s profile, knowing what we know, do we expect churn or no churn? We could then take that answer and decide whether to take action in order to hold them. There are many different approaches used to search for patterns in data. We will see a handful of them in this session. When any approach gets developed to the point where it can be described with a TODD CIOFFI - DATA SCIENCE 101: A LAYMAN’S TOUR OF DATA SCIENCE - OPEN DATA SCIENCE CONFERENCE - #ODSC - BOSTON 2015 18
  • 19.
    SO LET’S GETSTARTED WITH MODELING… TODD CIOFFI - DATA SCIENCE 101: A LAYMAN’S TOUR OF DATA SCIENCE - OPEN DATA SCIENCE CONFERENCE - #ODSC - BOSTON 2015 19
  • 20.
    WHAT IS ACOYOTE? Your six-year old nephew thinks that there are only five kinds of animals: 1) Kitty 2) Puppy 3) Horsey 4) Birdie 5) Fishie What does he think a coyote is? Why? TODD CIOFFI - DATA SCIENCE 101: A LAYMAN’S TOUR OF DATA SCIENCE - OPEN DATA SCIENCE CONFERENCE - #ODSC - BOSTON 2015 20
  • 21.
    K-NEAREST NEIGHBOR k-Nearest Neighbor(k-NN) is a very intuitive approach:  To find out what something is like, see what the things closest to it are like. Two key questions: What is “near”?  Euclidean Distance  Cosine Similarity  Manhattan Distance Which neighbors? How many?  K many… TODD CIOFFI - DATA SCIENCE 101: A LAYMAN’S TOUR OF DATA SCIENCE - OPEN DATA SCIENCE CONFERENCE - #ODSC - BOSTON 2015 21
  • 22.
    WHICH DOT ISCLOSER? 10-3 106TODD CIOFFI - DATA SCIENCE 101: A LAYMAN’S TOUR OF DATA SCIENCE - OPEN DATA SCIENCE CONFERENCE - #ODSC - BOSTON 2015 22 How about now?
  • 23.
    NORMALIZATION Orders of Magnitude Also consider significant digits Range Z-Transform Leaking data: Norm is also a model TODD CIOFFI - DATA SCIENCE 101: A LAYMAN’S TOUR OF DATA SCIENCE - OPEN DATA SCIENCE CONFERENCE - #ODSC - BOSTON 2015 23
  • 24.
    K-NN IN YOURHEAD… K = 1 Train on full data set How accurate? What did we learn? Why? TODD CIOFFI - DATA SCIENCE 101: A LAYMAN’S TOUR OF DATA SCIENCE - OPEN DATA SCIENCE CONFERENCE - #ODSC - BOSTON 2015 24
  • 25.
    OVERFIT The purpose ofmodeling is to find a generalizable pattern that will tell you about new data. If your model fits your current data too closely, it loses general utility. Kaggle Titanic  what about “new” passengers? TODD CIOFFI - DATA SCIENCE 101: A LAYMAN’S TOUR OF DATA SCIENCE - OPEN DATA SCIENCE CONFERENCE - #ODSC - BOSTON 2015 25
  • 26.
    TESTING & VALIDATION Sohow do we plan for “new” data when we’re working with one set of current data? Hold-Out or Split validation Cross-Validation Leave One Out TODD CIOFFI - DATA SCIENCE 101: A LAYMAN’S TOUR OF DATA SCIENCE - OPEN DATA SCIENCE CONFERENCE - #ODSC - BOSTON 2015 26
  • 27.
    CONFUSION MATRIX Performance Measures Accuracy / Error  What is the value of knowing the ratio of the number right (or wrong) of the total?  Precision / Recall  “You have cancer...”  Precision: how many with positive tests actually have cancer?  Recall: how many with cancer tested positive?  Sensitivity / Specificity  “You have cancer...”  Sensitivity: how many with cancer tested positive? (see: recall)  Specificity: how many without cancer tested negative?  Here is a handy URL to know: http://www.damienfrancois.be/blog/files/modelperfcheatsheet.pdf + - +’ A B -’ C D TODD CIOFFI - DATA SCIENCE 101: A LAYMAN’S TOUR OF DATA SCIENCE - OPEN DATA SCIENCE CONFERENCE - #ODSC - BOSTON 2015 27
  • 28.
    TODD CIOFFI -DATA SCIENCE 101: A LAYMAN’S TOUR OF DATA SCIENCE - OPEN DATA SCIENCE CONFERENCE - #ODSC - BOSTON 2015 28
  • 29.
    CONFUSION MATRIX, ARRANGED Reality Predicted +- +’ A B -’ C D Accuracy = (A+D) / (A+B+C+D) Error = (B+C) / (A+B+C+D) or 1 – ( (A+D) / (A+B+C+D) ) Precision = A / (A+B) Recall = A / (A+C) Specificity = D / (D+B) = Sensitivity You have Cancer... HTTP://WWW.DAMIENFRANCOIS.BE/BLOG/FILES/MODELPERFCHEATSHEET.PDFTODD CIOFFI - DATA SCIENCE 101: A LAYMAN’S TOUR OF DATA SCIENCE - OPEN DATA SCIENCE CONFERENCE - #ODSC - BOSTON 2015 29
  • 30.
    CORRELATION Meaning:  Do thingstend to move together? Range  To what degree?  Same or opposite?  -1 … 1 Not meaning  “Correlation does not equal Causation”  http://www.tylervigen.com/ TODD CIOFFI - DATA SCIENCE 101: A LAYMAN’S TOUR OF DATA SCIENCE - OPEN DATA SCIENCE CONFERENCE - #ODSC - BOSTON 2015 30
  • 31.
    LINEAR REGRESSION ANDOTHER “LINES” Y = MX + B Height / Weight of Dog y = m1x1 + m2x2 + ... + mnxn + b Dependent / independent variable  Cigs / cancer, but not cancer v cigs SVM: Support Vector Machine  Line > Plane > Hyperplane TODD CIOFFI - DATA SCIENCE 101: A LAYMAN’S TOUR OF DATA SCIENCE - OPEN DATA SCIENCE CONFERENCE - #ODSC - BOSTON 2015 31
  • 32.
    FUNNY THING ABOUTLINES: ANSCOMBE’S QUARTET I II III IV x y x y x y x y 10.0 8.04 10.0 9.14 10.0 7.46 8.0 6.58 8.0 6.95 8.0 8.14 8.0 6.77 8.0 5.76 13.0 7.58 13.0 8.74 13.0 12.74 8.0 7.71 9.0 8.81 9.0 8.77 9.0 7.11 8.0 8.84 11.0 8.33 11.0 9.26 11.0 7.81 8.0 8.47 14.0 9.96 14.0 8.10 14.0 8.84 8.0 7.04 6.0 7.24 6.0 6.13 6.0 6.08 8.0 5.25 4.0 4.26 4.0 3.10 4.0 5.39 19.0 12.50 12.0 10.84 12.0 9.13 12.0 8.15 8.0 5.56 7.0 4.82 7.0 7.26 7.0 6.42 8.0 7.91 5.0 5.68 5.0 4.74 5.0 5.73 8.0 6.89 Property (in each case) Value Mean of x 9 (exact) Sample variance of x 11 (exact) Mean of y 7.50 (to 2 places) Sample variance of y 4.122 or 4.127 (to 3 places) Correlation between x and y 0.816 (to 3 places) Linear regression line y = 3.00 + 0.500x (to 2 and 3 places, respectively) TODD CIOFFI - DATA SCIENCE 101: A LAYMAN’S TOUR OF DATA SCIENCE - OPEN DATA SCIENCE CONFERENCE - #ODSC - BOSTON 2015 32
  • 33.
    ANSCOMBE’S QUARTET TODD CIOFFI -DATA SCIENCE 101: A LAYMAN’S TOUR OF DATA SCIENCE - OPEN DATA SCIENCE CONFERENCE - #ODSC - BOSTON 2015 33
  • 34.
    DATA TYPES Numerical  Integer Real  Date-time Nominal  Binominal (either / or)  Polynominal (categorical)  Corpus Scalar, Ordinal, Categorical Dummy coding TODD CIOFFI - DATA SCIENCE 101: A LAYMAN’S TOUR OF DATA SCIENCE - OPEN DATA SCIENCE CONFERENCE - #ODSC - BOSTON 2015 34
  • 35.
    NAIVE BAYES Bayes: Simpleprobabilistic counting Smoke Pop Men 0.65 0.12 0.0780 + 0.88 0.5720 - Women 0.35 0.07 0.0245 + 0.93 0.3255 - 1 1 1 Smokers 0.1025 P(W|+) 0.2390 Mor N/S 0.9755 Sun, Wind, Precip > play outside Example contains a given word What does that mean about future examples with same word (or word combo)? TODD CIOFFI - DATA SCIENCE 101: A LAYMAN’S TOUR OF DATA SCIENCE - OPEN DATA SCIENCE CONFERENCE - #ODSC - BOSTON 2015 35
  • 36.
    RULES AND TREES RuleInduction  +++++++ ------  ++-- + ++ -+ --- Decision Trees Random Forest TODD CIOFFI - DATA SCIENCE 101: A LAYMAN’S TOUR OF DATA SCIENCE - OPEN DATA SCIENCE CONFERENCE - #ODSC - BOSTON 2015 36
  • 37.
    SAMPLING Rows, Records, Documents,Examples Spreadsheets think of data in rows. They are using a two-dimensional ledger (worksheets = 3-D). Databases use the term records (or documents) to identify the storage of one item. The display might seem linear, but the metaphor relating to real life is capturing more. Think of a medical record, a personnel file, or other such documents. These are even potentially multi-dimensional. Data Scientists uses the term examples. Whether a research biologist, a marketer, or political scientist, they are thinking in terms of populations – cohorts, customers, voters. Out of a given population, each individual is an example. From those examples, we find patterns. Linear, Shuffled, Stratified Kennard-Stone Over / Under TODD CIOFFI - DATA SCIENCE 101: A LAYMAN’S TOUR OF DATA SCIENCE - OPEN DATA SCIENCE CONFERENCE - #ODSC - BOSTON 2015 37
  • 38.
    TODD CIOFFI -DATA SCIENCE 101: A LAYMAN’S TOUR OF DATA SCIENCE - OPEN DATA SCIENCE CONFERENCE - #ODSC - BOSTON 2015 38
  • 39.
    CHECKERBOARD SET TODD CIOFFI- DATA SCIENCE 101: A LAYMAN’S TOUR OF DATA SCIENCE - OPEN DATA SCIENCE CONFERENCE - #ODSC - BOSTON 2015 39
  • 40.
    CHECKERBOARD SET: SAMPLE0.05 TODD CIOFFI - DATA SCIENCE 101: A LAYMAN’S TOUR OF DATA SCIENCE - OPEN DATA SCIENCE CONFERENCE - #ODSC - BOSTON 2015 40
  • 41.
    CHECKERBOARD SET: SAMPLE0.05 K-S TODD CIOFFI - DATA SCIENCE 101: A LAYMAN’S TOUR OF DATA SCIENCE - OPEN DATA SCIENCE CONFERENCE - #ODSC - BOSTON 2015 41
  • 42.
    CHECKERBOARD SET :OVER- /UNDER-SAMPLE TODD CIOFFI - DATA SCIENCE 101: A LAYMAN’S TOUR OF DATA SCIENCE - OPEN DATA SCIENCE CONFERENCE - #ODSC - BOSTON 2015 42
  • 43.
    FEATURE SELECTION In thesame way that spreadsheets use 2- D columns, and databases use data fields to make up a record, each example in our population is described by some number of attributes - also called properties, variables, or features. Forward Selection Backward Elimination Evolutionary TODD CIOFFI - DATA SCIENCE 101: A LAYMAN’S TOUR OF DATA SCIENCE - OPEN DATA SCIENCE CONFERENCE - #ODSC - BOSTON 2015 43
  • 44.
    DIMENSIONALITY REDUCTION Ht/Wt graph Food/mo (lbs)  Toy purchases ($)  Leash width (mm)  Property damage ($)  Stool volume (ml?) Helmets Clothes TODD CIOFFI - DATA SCIENCE 101: A LAYMAN’S TOUR OF DATA SCIENCE - OPEN DATA SCIENCE CONFERENCE - #ODSC - BOSTON 2015 44
  • 45.
    SUPERVISED LEARNING What doesit mean? Target variable / feature / attribute / label What else could one do? Unsupervised learning AKA Classification and Clustering Not the same thing, but one can feed the other TODD CIOFFI - DATA SCIENCE 101: A LAYMAN’S TOUR OF DATA SCIENCE - OPEN DATA SCIENCE CONFERENCE - #ODSC - BOSTON 2015 45
  • 46.
    K-MEANS CLUSTERING Clustering modeler Iterativedistance-based assessment • Start w/ Random Seeds • Assign each point to closest seed • Move seed to center of cluster • Lather, rinse, repeat until mean doesn’t move (or oscillates) and clusters don’t change. How many clusters?  k many Then what happens? • Could turn cluster assignments into classification labels TODD CIOFFI - DATA SCIENCE 101: A LAYMAN’S TOUR OF DATA SCIENCE - OPEN DATA SCIENCE CONFERENCE - #ODSC - BOSTON 2015 46
  • 47.
    OUTLIER DETECTION Distance Density LOF: LocalizedDensity TODD CIOFFI - DATA SCIENCE 101: A LAYMAN’S TOUR OF DATA SCIENCE - OPEN DATA SCIENCE CONFERENCE - #ODSC - BOSTON 2015 47
  • 48.
    SCALE Began with BigData PA at scale – how are algorithms impacted? Memory and Calculation constraints TODD CIOFFI - DATA SCIENCE 101: A LAYMAN’S TOUR OF DATA SCIENCE - OPEN DATA SCIENCE CONFERENCE - #ODSC - BOSTON 2015 48
  • 49.
    NO FREE LUNCH Nosingle algorithm is the “best” for all data sets Different algorithms are often used in different situations  Naïve Bayes is common in Spam filters  Outlier Detection is helpful with Fraud  Clustering works well for Recommendation engines and identifying other marketing demos TODD CIOFFI - DATA SCIENCE 101: A LAYMAN’S TOUR OF DATA SCIENCE - OPEN DATA SCIENCE CONFERENCE - #ODSC - BOSTON 2015 49