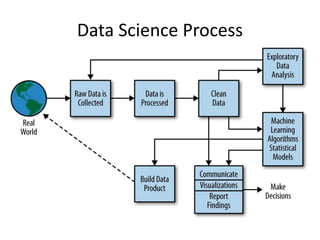
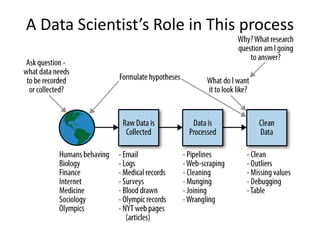
The document provides an overview of data science and what it entails. It discusses the hype around big data and data science, and how data science has evolved due to improvements in technology that allow for large-scale data processing. It defines data science as a process that involves collecting, cleaning, analyzing and extracting meaningful insights from data. Data scientists come from a variety of academic backgrounds and work in both industry and academia developing solutions to real-world problems using data-driven approaches.
In this presentation, I have talked about Big Data and its importance in brief. I have included the very basics of Data Science and its importance in the present day, through a case study. You can also get an idea about who a data scientist is and what all tasks he performs. A few applications of data science have been illustrated in the end.
What Is Data Science? | Introduction to Data Science | Data Science For Begin...Simplilearn
This Data Science Presentation will help you in understanding what is Data Science, why we need Data Science, prerequisites for learning Data Science, what does a Data Scientist do, Data Science lifecycle with an example and career opportunities in Data Science domain. You will also learn the differences between Data Science and Business intelligence. The role of a data scientist is one of the sexiest jobs of the century. The demand for data scientists is high, and the number of opportunities for certified data scientists is increasing. Every day, companies are looking out for more and more skilled data scientists and studies show that there is expected to be a continued shortfall in qualified candidates to fill the roles. So, let us dive deep into Data Science and understand what is Data Science all about.
This Data Science Presentation will cover the following topics:
1. Need for Data Science?
2. What is Data Science?
3. Data Science vs Business intelligence
4. Prerequisites for learning Data Science
5. What does a Data scientist do?
6. Data Science life cycle with use case
7. Demand for Data scientists
This Data Science with Python course will establish your mastery of data science and analytics techniques using Python. With this Python for Data Science Course, you’ll learn the essential concepts of Python programming and become an expert in data analytics, machine learning, data visualization, web scraping and natural language processing. Python is a required skill for many data science positions, so jumpstart your career with this interactive, hands-on course.
Why learn Data Science?
Data Scientists are being deployed in all kinds of industries, creating a huge demand for skilled professionals. Data scientist is the pinnacle rank in an analytics organization. Glassdoor has ranked data scientist first in the 25 Best Jobs for 2016, and good data scientists are scarce and in great demand. As a data you will be required to understand the business problem, design the analysis, collect and format the required data, apply algorithms or techniques using the correct tools, and finally make recommendations backed by data.
The Data Science with python is recommended for:
1. Analytics professionals who want to work with Python
2. Software professionals looking to get into the field of analytics
3. IT professionals interested in pursuing a career in analytics
4. Graduates looking to build a career in analytics and data science
5. Experienced professionals who would like to harness data science in their fields
Data Science Tutorial | Introduction To Data Science | Data Science Training ...Edureka!
This Edureka Data Science tutorial will help you understand in and out of Data Science with examples. This tutorial is ideal for both beginners as well as professionals who want to learn or brush up their Data Science concepts. Below are the topics covered in this tutorial:
1. Why Data Science?
2. What is Data Science?
3. Who is a Data Scientist?
4. How a Problem is Solved in Data Science?
5. Data Science Components
A short presentation for beginners on Introduction of Machine Learning, What it is, how it works, what all are the popular Machine Learning techniques and learning models (supervised, unsupervised, semi-supervised, reinforcement learning) and how they works with various Industry use-cases and popular examples.
My class presentation at USC. It gives an introduction about what is data science, machine learning, applications, recommendation system and infrastructure.
Introduction to Data Science and AnalyticsSrinath Perera
This webinar serves as an introduction to WSO2 Summer School. It will discuss how to build a pipeline for your organization and for each use case, and the technology and tooling choices that need to be made for the same.
This session will explore analytics under four themes:
Hindsight (what happened)
Oversight (what is happening)
Insight (why is it happening)
Foresight (what will happen)
Recording http://t.co/WcMFEAJHok
Data science is different from Data Analytics,Data Engineering,Big Data.
Presentation about Data Science.
What is Data Science its process future and scope.
Data Science Presentation By Amit Singh.
"Sexiest job of 21st century"
Data Science For Beginners | Who Is A Data Scientist? | Data Science Tutorial...Edureka!
** Data Science Certification using R: https://www.edureka.co/data-science **
This Edureka "Data Science for Beginners" PPT talks about the basic concepts of Data Science, which includes machine learning algorithms as well as the roles & responsibilities of a Data Scientist. It also includes a demo using R Studio, that attempts to make sense of all the Data generated in the real world. This PPT talks about the most crucial aspects of data science and covers the following topics:
Why Data Science?
What is Data Science?
Who is a Data Scientist?
What does a Data Scientist do?
How to solve a problem in Data Science?
Data Science Tools
Demo
Check out our Data Science Tutorial blog series: http://bit.ly/data-science-blogs
Check out our complete YouTube playlist here: http://bit.ly/data-science-playlist
Follow us to never miss an update in the future.
Instagram: https://www.instagram.com/edureka_learning/
Facebook: https://www.facebook.com/edurekaIN/
Twitter: https://twitter.com/edurekain
LinkedIn: https://www.linkedin.com/company/edureka
In this presentation, let's have a look at What is Data Science and it's applications. We discussed most common use cases of Data Science.
I presented this at LSPE-IN meetup happened on 10th March 2018 at Walmart Global Technology Services.
Data Science is a wonderful technology that has applications in almost every field. Let's learn the basics of this domain on 16th March at (time).
Agenda
1. What is Data Science? How is it different from ML, DL, and AI
2. Why is this skill in demand?
3. What are some popular applications of Data Science
4. Popular tools and frameworks used in Data Science
Being able to make data driven decisions is a crucial skill for any company. The requirements are growing tougher - the volume of collected data keeps increasing in orders of magnitude and the insights must be smarter and faster. Come learn more about why data science is important and what challenges the data teams need to face.
Data Science - An emerging Stream of Science with its Spreading Reach & ImpactDr. Sunil Kr. Pandey
This is my presentation on the Topic "Data Science - An emerging Stream of Science with its Spreading Reach & Impact". I have compiled and collected different statistics and data from different sources. This may be useful for students and those who might be interested in this field of Study.
Data science training presentation for high-quality education and training in...testingggg0101
https://nareshit.in/data-science-training/
We are a Data Science Training Institute, dedicated to providing comprehensive education and practical skills in the dynamic field of Data Science.
Here, we believe in empowering individuals with the knowledge and expertise to excel in the rapidly evolving world of data-driven decision-making.
Our Data Science Training Institute offers a wide range of courses, workshops, and hands-on projects designed to cater to learners of all levels, from beginners to advanced professionals.
About
Evolution of Data, Data Science , Business Analytics, Applications, AI, ML, DL, Data science – Relationship, Tools for Data Science, Life cycle of data science with case study,
Algorithms for Data Science, Data Science Research Areas,
Future of Data Science.
A brief information about the SCOP protein database used in bioinformatics.
The Structural Classification of Proteins (SCOP) database is a comprehensive and authoritative resource for the structural and evolutionary relationships of proteins. It provides a detailed and curated classification of protein structures, grouping them into families, superfamilies, and folds based on their structural and sequence similarities.
Observation of Io’s Resurfacing via Plume Deposition Using Ground-based Adapt...Sérgio Sacani
Since volcanic activity was first discovered on Io from Voyager images in 1979, changes
on Io’s surface have been monitored from both spacecraft and ground-based telescopes.
Here, we present the highest spatial resolution images of Io ever obtained from a groundbased telescope. These images, acquired by the SHARK-VIS instrument on the Large
Binocular Telescope, show evidence of a major resurfacing event on Io’s trailing hemisphere. When compared to the most recent spacecraft images, the SHARK-VIS images
show that a plume deposit from a powerful eruption at Pillan Patera has covered part
of the long-lived Pele plume deposit. Although this type of resurfacing event may be common on Io, few have been detected due to the rarity of spacecraft visits and the previously low spatial resolution available from Earth-based telescopes. The SHARK-VIS instrument ushers in a new era of high resolution imaging of Io’s surface using adaptive
optics at visible wavelengths.
Seminar of U.V. Spectroscopy by SAMIR PANDASAMIR PANDA
Spectroscopy is a branch of science dealing the study of interaction of electromagnetic radiation with matter.
Ultraviolet-visible spectroscopy refers to absorption spectroscopy or reflect spectroscopy in the UV-VIS spectral region.
Ultraviolet-visible spectroscopy is an analytical method that can measure the amount of light received by the analyte.
Richard's entangled aventures in wonderlandRichard Gill
Since the loophole-free Bell experiments of 2020 and the Nobel prizes in physics of 2022, critics of Bell's work have retreated to the fortress of super-determinism. Now, super-determinism is a derogatory word - it just means "determinism". Palmer, Hance and Hossenfelder argue that quantum mechanics and determinism are not incompatible, using a sophisticated mathematical construction based on a subtle thinning of allowed states and measurements in quantum mechanics, such that what is left appears to make Bell's argument fail, without altering the empirical predictions of quantum mechanics. I think however that it is a smoke screen, and the slogan "lost in math" comes to my mind. I will discuss some other recent disproofs of Bell's theorem using the language of causality based on causal graphs. Causal thinking is also central to law and justice. I will mention surprising connections to my work on serial killer nurse cases, in particular the Dutch case of Lucia de Berk and the current UK case of Lucy Letby.
Nutraceutical market, scope and growth: Herbal drug technologyLokesh Patil
As consumer awareness of health and wellness rises, the nutraceutical market—which includes goods like functional meals, drinks, and dietary supplements that provide health advantages beyond basic nutrition—is growing significantly. As healthcare expenses rise, the population ages, and people want natural and preventative health solutions more and more, this industry is increasing quickly. Further driving market expansion are product formulation innovations and the use of cutting-edge technology for customized nutrition. With its worldwide reach, the nutraceutical industry is expected to keep growing and provide significant chances for research and investment in a number of categories, including vitamins, minerals, probiotics, and herbal supplements.
Multi-source connectivity as the driver of solar wind variability in the heli...Sérgio Sacani
The ambient solar wind that flls the heliosphere originates from multiple
sources in the solar corona and is highly structured. It is often described
as high-speed, relatively homogeneous, plasma streams from coronal
holes and slow-speed, highly variable, streams whose source regions are
under debate. A key goal of ESA/NASA’s Solar Orbiter mission is to identify
solar wind sources and understand what drives the complexity seen in the
heliosphere. By combining magnetic feld modelling and spectroscopic
techniques with high-resolution observations and measurements, we show
that the solar wind variability detected in situ by Solar Orbiter in March
2022 is driven by spatio-temporal changes in the magnetic connectivity to
multiple sources in the solar atmosphere. The magnetic feld footpoints
connected to the spacecraft moved from the boundaries of a coronal hole
to one active region (12961) and then across to another region (12957). This
is refected in the in situ measurements, which show the transition from fast
to highly Alfvénic then to slow solar wind that is disrupted by the arrival of
a coronal mass ejection. Our results describe solar wind variability at 0.5 au
but are applicable to near-Earth observatories.
(May 29th, 2024) Advancements in Intravital Microscopy- Insights for Preclini...Scintica Instrumentation
Intravital microscopy (IVM) is a powerful tool utilized to study cellular behavior over time and space in vivo. Much of our understanding of cell biology has been accomplished using various in vitro and ex vivo methods; however, these studies do not necessarily reflect the natural dynamics of biological processes. Unlike traditional cell culture or fixed tissue imaging, IVM allows for the ultra-fast high-resolution imaging of cellular processes over time and space and were studied in its natural environment. Real-time visualization of biological processes in the context of an intact organism helps maintain physiological relevance and provide insights into the progression of disease, response to treatments or developmental processes.
In this webinar we give an overview of advanced applications of the IVM system in preclinical research. IVIM technology is a provider of all-in-one intravital microscopy systems and solutions optimized for in vivo imaging of live animal models at sub-micron resolution. The system’s unique features and user-friendly software enables researchers to probe fast dynamic biological processes such as immune cell tracking, cell-cell interaction as well as vascularization and tumor metastasis with exceptional detail. This webinar will also give an overview of IVM being utilized in drug development, offering a view into the intricate interaction between drugs/nanoparticles and tissues in vivo and allows for the evaluation of therapeutic intervention in a variety of tissues and organs. This interdisciplinary collaboration continues to drive the advancements of novel therapeutic strategies.
3. What is Data Science?
• Big Data and Data Science Hype
• Getting Past the Hype / Why Now?
• Datafication
• The Current Landscape (with a Little History)
• Data Science Jobs
• A Data Science Profile
• Thought Experiment: Meta-Definition
• OK, So What Is a Data Scientist, Really?
– In Academia
– In Industry
4. Big Data and Data Science Hype
• Big Data, how big?
• Data Science, who is doing it?
• Academia have been doing this for years
• Statisticians have been doing this work.
5. Getting Past the Hype / Why Now
• The Hype: Understanding the cultural phenomenon of data
science and how others were experiencing it. Study how
companies, and universities are “doing data science”.
• Why Now: Technology makes this possible: infrastructure for
large-scale data processing, increased memory, and
bandwidth, as well as a cultural acceptance of technology in
the fabric of our lives. This wasn't true a decade ago.
• Consideration should be to the ethical and technical
responsibilities for the people responsible for the process.
6. Datafication
• Definition: A process of "taking all aspects of
life and turning them into data:''
• For Example:
– "Google's augmented-reality glasses “datafy” the
gaze.
– Twitter “datafies” stray thoughts.
– Linkedin “datafies” professional networks:
7. Current Landscape of Data Science
• Drew Conway's Venn diagram of data science
from 20l0,
8. Data Science Jobs
Job descriptions:
• experts in computer science,
• statistics,
• communication,
• data visualization, and to have
• extensive domain expertise
Observation: Nobody is an expert in everything, which is
why it makes more sense to create teams of people who
have different profiles and different expertise-together, as
a team, they can specialize in all those things.
12. What is Data Science, Really?
• Data scientist in academia ?
• who in academia plans to become a data
scientist?
13. What is Data Science, Really?
• Data scientist in academia ?
• who in academia plans to become a data scientist?
• statisticians, applied mathematicians, and computer
scientists, sociologists, journalists, political scientists,
biomedical informatics students, students from
government agencies and social welfare, someone
from the architecture school, environmental
engineering, pure mathematicians, business marketing
students, and students who already worked as data
scientists.
14. What is Data Science, Really?
• Data scientist in academia ?
• who in academia plans to become a data scientist?
• statisticians, applied mathematicians, and computer
scientists, sociologists, journalists, political scientists,
biomedical informatics students, students from
government agencies and social welfare, someone
from the architecture school, environmental
engineering, pure mathematicians, business marketing
students, and students who already worked as data
scientists.
• They were all interested in figuring out ways to solve
important problems, often of social value, with data.
15. • In Academia: an academic data scientist is a
scientist, trained in anything from social
science to biology, who works with large
amounts of data, and must wrestle with
computational problems posed by the
structure, size, messiness, and the complexity
and nature of the data, while simultaneously
solving a real-world problem.
17. In Industry?
• What do data scientists look like in industry?
• It depends on the level of seniority
• A chief data scientist : setting everything up
from the engineering and infrastructure for
collecting data and logging, to privacy
concerns, to deciding what data will be user-
facing, how data is going to be used to make
decisions, and how it’s going to be built back
into the product.
18. • manage a team of engineers, scientists, and
analysts and should communicate with
leadership across the company, including the
CEO, CTO, and product leadership.
19. • In Industry: Someone who knows how to extract
meaning from and interpret data, which requires
both tools and methods from statistics and
machine learning, as well as being human.
He/She spends a lot of time in the process of
collecting, cleaning, and “munging” data,
because data is never clean. This process requires
persistence, statistics, and software engineering
skills that are also necessary for understanding
biases in the data, and for debugging logging
output from code.
21. Big Data Statistics (pages 17 -33)
• Statistical thinking in the Age of Big Data
• Statistical Inference
• Populations and Samples
• Big Data Examples
• Big Assumptions due to Big Data
• Modeling
22. Statistical Thinking in the Age of Big
Data
Big Data?.
• First, it is a bundle of technologies.
• Second, it is a potential revolution in
measurement.
• And third, it is a point of view, or philosophy,
about how decisions will be—and perhaps
should be—made in the future.
23. Statistical Thinking – Age of Big Data
• Prerequisites – massive skills!! (Pages 14 -16)
– Math/Comp Science: stats, linear algebra, coding.
– Analytical: Data preparation, modeling,
visualization, communication.
24. Statistical Inference
• The World – complex, random, uncertain. (Page 18)
• As we commute to work on subways and in cars,
• shopping, emailing, browsing the Internet and watching the stock
market,
• as we’re building things, eating things,
• talking to our friends and family about things,
• this all processes potentially produces data.
– Data are small traces of real-world processes.
– which traces we gather are decided by our data
collection or sampling method
25. …..
• Note: two forms of randomness exist: (Page 19)
– Underlying the process (system property)
– Collection methods (human errors)
• Need a solid method to extract meaning and
information from random, dubious data. ( Page
19)
– This is Statistical Inference!
26. • This overall process of going from the world to the data,
and then from the data back to the world, is the field of
statistical inference.
• More precisely, statistical inference is the discipline that
concerns itself with the development of procedures,
methods, and theorems that allow us to extract meaning
and information from data that has been generated by
stochastic (random) processes.
27. Populations and Samples
• Population : population of India or population
of world ?
• It could be any set of objects or units, such as
tweets or photographs or stars etc.
• If we could measure the characteristics of all
those objects : set of observations (N)
28. Big Data Domain - Sampling
• Scientific Validity Issues with “Big Data”
populations and samples. (Page 21 –
Engineering problems + Bias)
– Incompleteness Assumptions (Page 22)
• All statistics and analyses must assume that samples do
not represent the population and therefore scientifically-
tenable conclusions cannot be drawn.
• i.e. It’s a guess at best. These types of assertions will
stand-up better against academic/scientific scrutiny.
29. Big Data Domain - Assumptions
• Other Bad or Wrong Assumptions
– N = 1 vs. N = ALL (multiple layers) (Page 25 -26)
• Big Data introduces a 2nd degree to the data context.
• There are infinite levels of depth and breadth in the data.
• Individuals become populations. Populations become
populations of populations – to the nth degree. (meta-data)
– My Example:
• 1 billion Facebook posts (one from each user) vs. 1 billion
Facebook posts from one unique user.
• 1 billion tweets vs. 1 billion images from one unique user.
• Danger: Drawing conclusions from incomplete
populations. Understand the boundaries/context.
30. Modeling
• What’s a model? (bottom page 27 – middle 28)
– An attempt to understand the population of interest
and represent that in a compact form which can be
used to experiment/analyze/study and determine
cause-and-effect and similar relationships amongst
the variables under study IN THE POPULATION.
• Data model
• Statistical model – fitting?
• Mathematical model
32. Fitting a model
• estimate the parameters of the model using
the observed data.
Overfitting:
• model isn’t that good at capturing reality
beyond your sampled data.
34. Exploratory Data Analysis (EDT)
• “It is an attitude, a state of flexibility, a willingness
to look for those things that we believe are not
there, as well as those we believe to be there.”
-John Tukey
• Traditionally presented as a bunch of histograms
and stem-and-leaf plots.
35. Features
• EDT is a critical part of data science process.
• Represents a philosophy or way of doing
statistics.
• No hypotheses and there is no model.
• “Exploratory” aspect means that your
understanding of the problem you are
solving, or might solve, is changing as you go.
36. Basic Tools of EDA
• Plots, graphs and summary statistics.
• Method of systematically going through the
data, plotting distributions of all variables.
• EDA is a set of tools, it’s also a mindset.
• Mindset is about relationship with the data.
37. Philosophy of EDA
• Many reasons any one working with data
should do EDA.
• EDA helps with de-bugging the logging
process.
• EDA helps assuring the product is performing
as intended.
• EDA is done toward the beginning of the
analysis.
41. What is an algorithm?
• Series of steps or rules to accomplish a tasks
such as:
– Sorting
– Searching
– Graph-based computational problems
• Because one problem could be solved by
several algorithms, the “best” is the one that
can do it with most efficiency and least
computational time.
42. Three Categories of Algorithms
• Data munging, preparation, and processing
– Sorting, MapReduce, Pregel
– Considered data engineering
• Optimization
– Parameter estimation
– Gradient Descent, Newton’s Method, least
squares
• Machine learning
– Predict, classify, cluster
43. Data Scientists
• Good data scientists use both statistical
modeling and machine learning algorithms.
• Statisticians:
– Want to apply parameters
to real world scenarios.
– Provide confidence
intervals and have
uncertainty in these.
– Make explicit assumptions
about data generation.
• Software engineers:
– Want to create production
code into a model without
interpret parameters.
– Machine learning
algorithms don’t have
notions of uncertainty.
– Don’t make assumptions of
probability distribution –
implicit.
44. Linear Regression (supervised)
• Determine if there is causation and build a
model if we think so.
• Does X (explanatory var) cause Y (response
var)?
• Assumptions:
– Quantitative variables
– Linear form
45. Linear Regression (supervised)
• Steps:
– Create a scatterplot of data
– Ensure that data looks linear (maybe apply
transformation?)
– Find “line of least squares” or fit line.
• This is the line that has the lowest sum of all of the
residuals (actual values – expected values)
– Check your model for “goodness” with R-squared,
p-values, etc.
– Apply your model within reason.
46. Suppose you run a social networking site that
charges a monthly subscription fee of $25, and that
this is your only source of revenue.
Each month you collect data and count your number
of users and total revenue.
You’ve done this daily over the course of two years,
recording it all in a spreadsheet.
You could express this data as a series of points. Here
are the first four:
S= {(x, y) = (1,25) , (10,250) , (100,2500) ,(200,5000)}
47. The names of the columns are
total_num_friends,
total_new_friends_this_week, num_visits,
time_spent, number_apps_downloaded,
number_ads_shown, gender, age, and so on.
54. Extending beyond least squares
• We have a simple linear regression model
using least squares estimation to estimate your
βs.
• This model can also be build in three primary
ways
1. Adding in modeling assumptions about the errors
2. Adding in more predictors
3. Transforming the predictors
55. Adding in modeling assumptions about
the errors
• If you use your model to predict y for a given
value of x, your prediction is deterministic
(y = β0 +β1x)
• doesn’t capture the variability in the observed
data.
• to capture this variability in your model, so
you extend your model to:
y = β0 +β1x+ϵ
56. • the error term—ϵ represents the actual error.
• the difference between the observations and
the true regression line,
• which you’ll never know and can only
estimate with your .
• the noise is normally distributed, which is
denoted:
57. • the conditional distribution of y given x is
• Need to estimate your parameters β0, β1, σ (variance)
from the data
• Then you estimate the variance (σ2) of ϵ, as:
(mean squared error)
66. The intution behind k-NN
• is to consider the most similar other items
defined in terms of their attributes, look at
their labels, and give the unassigned item the
majority vote.
• If there’s a tie, you randomly select among the
labels that have tied for first.
67. • To automate it, two decisions must be made:
first, how do you define similarity or closeness?
• Once you define it, for a given unrated item, you
can say how similar all the labeled items are to it,
• and you can take the most similar items and call
them neighbors, who each have a “vote.”
• how many neighbors should you look at or “let
vote”? This value is k
68.
69.
70. overview of the process:
1. Decide on your similarity or distance metric.
2. Split the original labeled dataset into training and test
data.
3. Pick an evaluation metric. (Misclassification rate is a
good one. We’ll explain this more in a bit.)
4. Run k-NN a few times, changing k and checking the
evaluation measure.
5. Optimize k by picking the one with the best
evaluation measure.
6. Once you’ve chosen k, use the same training set and
now create a new test set with the people’s ages and
incomes that you have no
73. Pick an evaluation metric
• Sensitivity(true positive/recall) is defined as
the probability of correctly diagnosing an ill
patient as ill
• Specificity(true negative) is defined as the
probability of correctly diagnosing a well
patient as well.
74. Choosing k
• Run k-NN a few times, changing k, and
checking the evaluation metric each time.
75. k-Nearest Neighbor/k-NN (supervised)
• Used when you have many objects that are
classified into categories but have some
unclassified objects (e.g. movie ratings).
76. k-Nearest Neighbor/k-NN (supervised)
• Pick a k value (usually a low odd number, but
up to you to pick).
• Find the closest number of k points to the
unclassified point (using various distance
measurement techniques).
• Assign the new point to the class where the
majority of closest points lie.
• Run algorithm again and again using different
k’s.
77.
78. k-means (unsupervised)
• Goal is to segment data into clusters or strata
– Important for marketing research where you need
to determine your sample space.
• Assumptions:
– Labels are not known.
– You pick k (more of an art than a science).
79. k-means (unsupervised)
• Randomly pick k centroids (centers of data)
and place them near “clusters” of data.
• Assign each data point to a centroid.
• Move the centroids to the average location of
the data points assigned to it.
• Repeat the previous two steps until the data
point assignments don’t change.