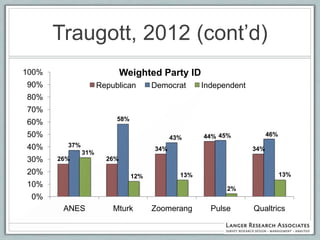
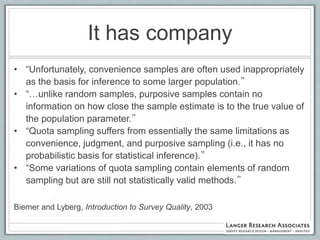
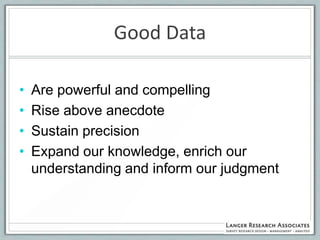
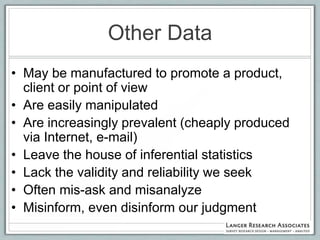
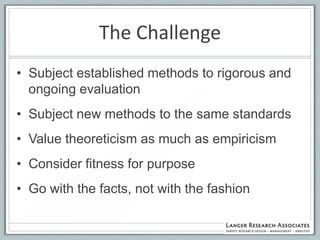
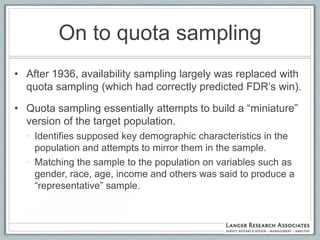
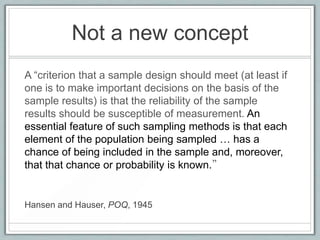
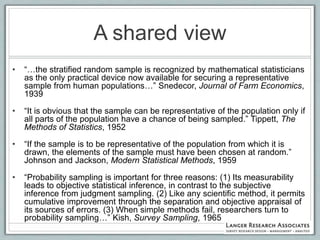
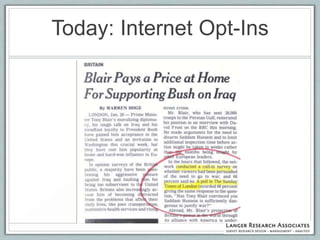
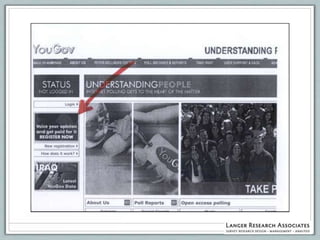
This document discusses the evolution of survey sampling methods, emphasizing the importance of probability sampling for reliable data collection and analysis. It contrasts traditional methods with newer opt-in online methodologies, highlighting the potential biases and inaccuracies associated with non-probability samples. The text concludes that probability sampling remains the gold standard for ensuring representative and accurate survey results.


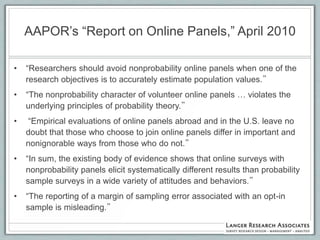
![-----Original Message-----
From: Students SM Team [mailto:alumteam@teams.com]
Sent: Wednesday, October 04, 2006 11:27 AM
Subject: New Job opening
Hi,
Going to school requires a serious commitment, but most students still need extra money for rent, food,
gas, books, tuition, clothes, pleasure and a whole list of other things.
So what do you do? "Find some sort of work", but the problem is that many jobs are boring, have low pay
and rigid/inflexible schedules. So you are in the middle of mid-terms and you need to study but you
have to be at work, so your grades and education suffer at the expense of your "College Job".
Now you can do flexible work that fits your schedule! Our company and several nationwide companies
want your help. We are looking to expand, by using independent workers we can do so without buying
additional buildings and equipment. You can START IMMEDIATELY!
This type of work is Great for College and University Students who are seriously looking for extra income!
We have compiled and researched hundreds of research companies that are willing to pay you
between $5 and $75 per hour simply to answer an online survey in the peacefulness of your
own home. That's all there is to it, and there's no catch or gimmicks! We've put together the most
reliable and reputable companies in the industry. Our list of research companies will allow you to earn
$5 to $75 filling out surveys on the internet from home. One hour focus groups will earn you $50 to
$150. It's as simple as that.
Our companies just want you to give them your opinion so that they can empower their own market
research. Since your time is valuable, they are willing to pay you for it.
If you want to apply for the job position, please email at:
job2@alum.com Students SM Team](https://image.slidesharecdn.com/probabilitynsflanger-121011113109-phpapp01/85/Probability-Sampling-and-Alternative-Methodologies-21-320.jpg)
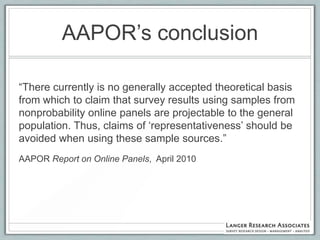
![-----Original Message-----
From: Ipsos News Alerts [mailto:newsalerts@ipsos-na.com]
Sent: Friday, March 27, 2009 5:12 PM
To: Langer, Gary
Subject: McLeansville Mother Wins a Car By Taking Surveys
McLeansville Mother Wins a Car By Taking Surveys
Toronto, ON- McLeansville, NC native, Jennifer Gattis beats the odds and
wins a car by answering online surveys. Gattis was one of over 105 300
North Americans eligible to win. Representatives from Ipsos i-Say, a
leading online market research panel will be in Greensboro on Tuesday,
March 31, 2009 to present Gattis with a 2009 Toyota Prius.
Access the full press release at:
http://www.ipsos-na.com/news/pressrelease.cfm?id=4331](https://image.slidesharecdn.com/probabilitynsflanger-121011113109-phpapp01/85/Probability-Sampling-and-Alternative-Methodologies-22-320.jpg)