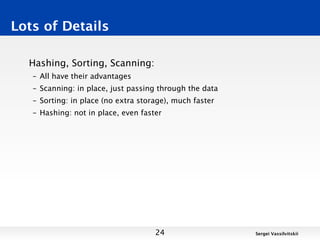
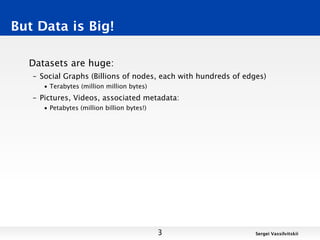
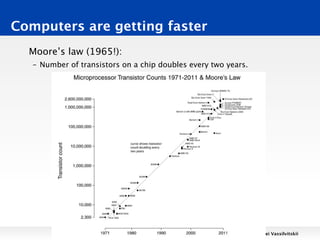
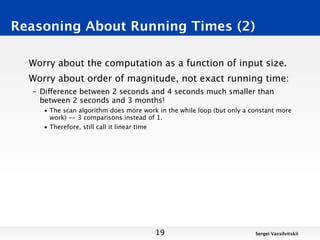
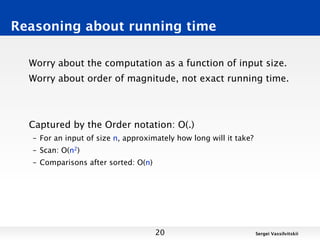
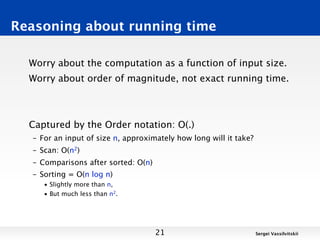
This document discusses techniques for finding the intersection between two large datasets efficiently. It begins by noting that while computers can perform billions of operations per second, datasets are huge, ranging from terabytes to petabytes in size. Two techniques for finding intersections are examined: scanning and sorting. Scanning has a runtime of O(n2) while sorting has a runtime of O(n log n), making sorting faster. Hashing is proposed as an even faster alternative with a runtime of O(n). Reasoning about algorithmic runtimes and how they scale with input size is discussed.
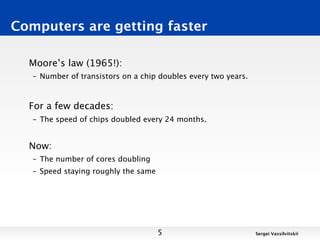
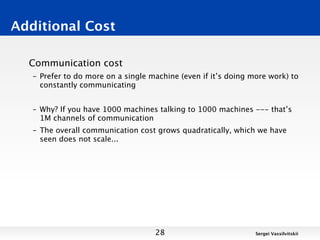
![Idea 2: Sorting
Suppose both sets are sorted
– Keep pointers to each
– Check for match, increase the smaller pointer
[Blackboard]
15 Sergei Vassilvitskii](https://image.slidesharecdn.com/lecture-130325093943-phpapp02/85/Computational-Social-Science-Lecture-07-Counting-Fast-Part-I-15-320.jpg)
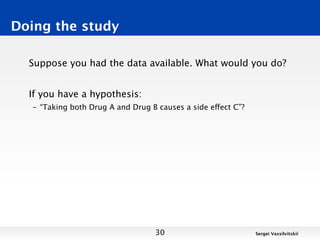
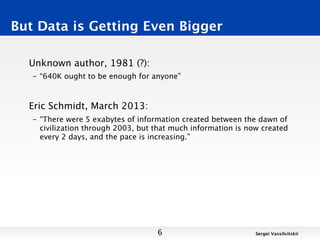
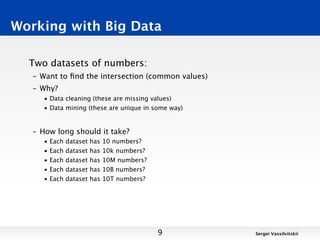
![Idea 2: Sorting
sorted1 = sorted(dataset1)
sorted2 = sorted(dataset2)
pointer1, pointer2 = 0
common_elements = 0
while pointer1 < size(dataset1) and pointer2 < size(dataset2):
if sorted[pointer1] == sorted[pointer2]:
common_elements+=1
pointer1+=1; pointer2+=1
else if sorted[pointer1] < sorted[pointer2]:
pointer1+=1
else:
pointer2+=1
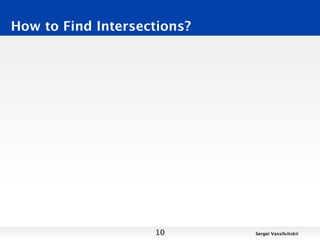
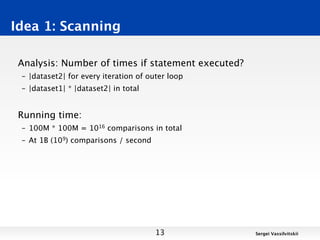
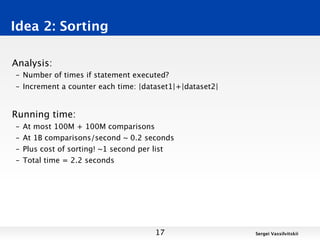
Analysis:
– Number of times if statement executed?
– Increment a counter each time: |dataset1|+|dataset2|
16 Sergei Vassilvitskii](https://image.slidesharecdn.com/lecture-130325093943-phpapp02/85/Computational-Social-Science-Lecture-07-Counting-Fast-Part-I-16-320.jpg)
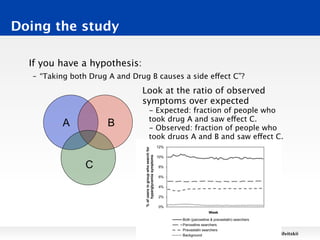
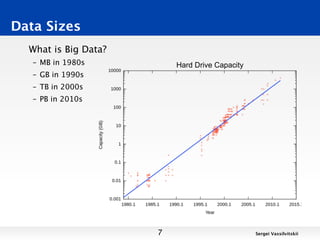
![Avoiding Sort: Hashing
Idea 3.
– Store each number in list1 in a location unique to it
– For each element in list2, check if its unique location is empty
[Blackboard]
22 Sergei Vassilvitskii](https://image.slidesharecdn.com/lecture-130325093943-phpapp02/85/Computational-Social-Science-Lecture-07-Counting-Fast-Part-I-22-320.jpg)
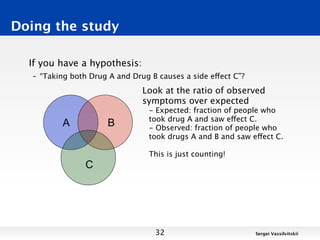
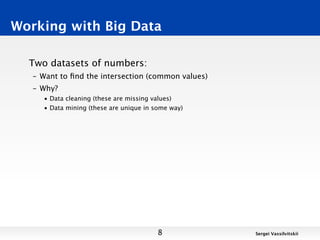
![Idea 3: Hashing
table = {}
for i in range(total):
table.add(dataset1[i])
common_elements = 0
for i in range(total):
if (table.has(dataset2[i])):
common_elements+=1
Analysis:
– Number of additions to the table: |dataset1|
– Number of comparisons: |dataset2|
– If Additions to the table and comparisons are 1B/second
– Total running time is: 0.2s
23 Sergei Vassilvitskii](https://image.slidesharecdn.com/lecture-130325093943-phpapp02/85/Computational-Social-Science-Lecture-07-Counting-Fast-Part-I-23-320.jpg)