
Download as PDF, PPTX


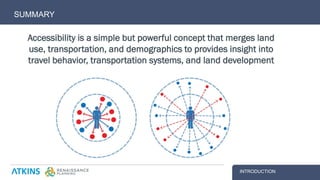
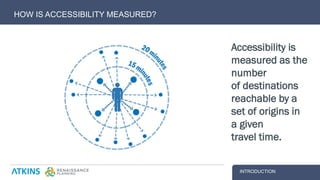

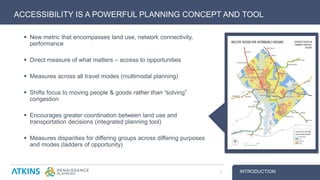
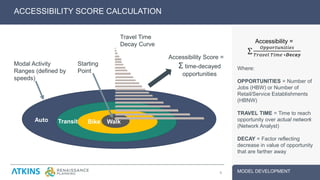

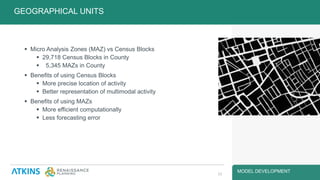
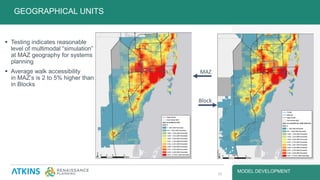
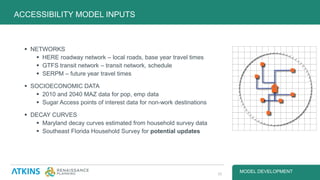

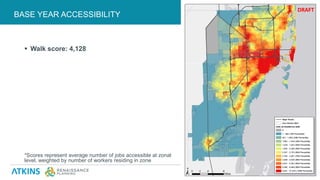
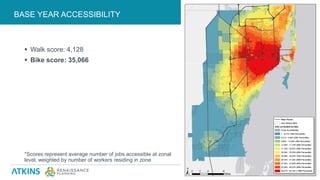
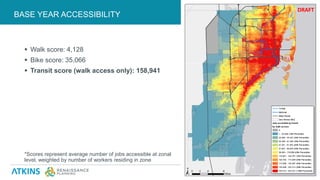
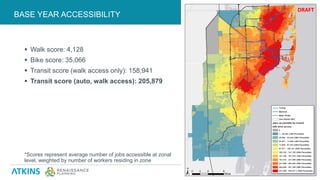
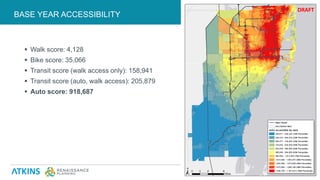

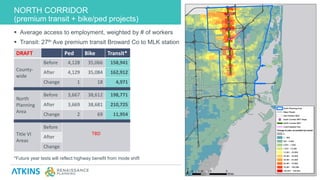
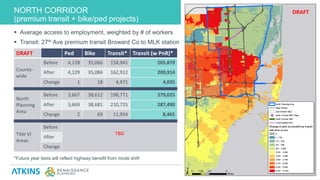
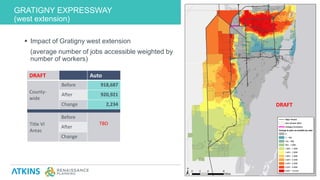

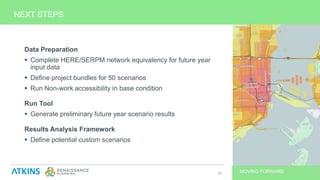


The Miami-Dade Accessibility Needs Assessment evaluates transportation accessibility, merging factors of land use, transportation, and demographics to analyze travel behaviors. It presents accessibility scores measured by the number of reachable destinations over specific travel times, aiming to improve mobility, safety, economic vitality, and connectivity. The document outlines methodologies for assessing accessibility, results from pilot projects, and plans for future improvements and scenario testing.


