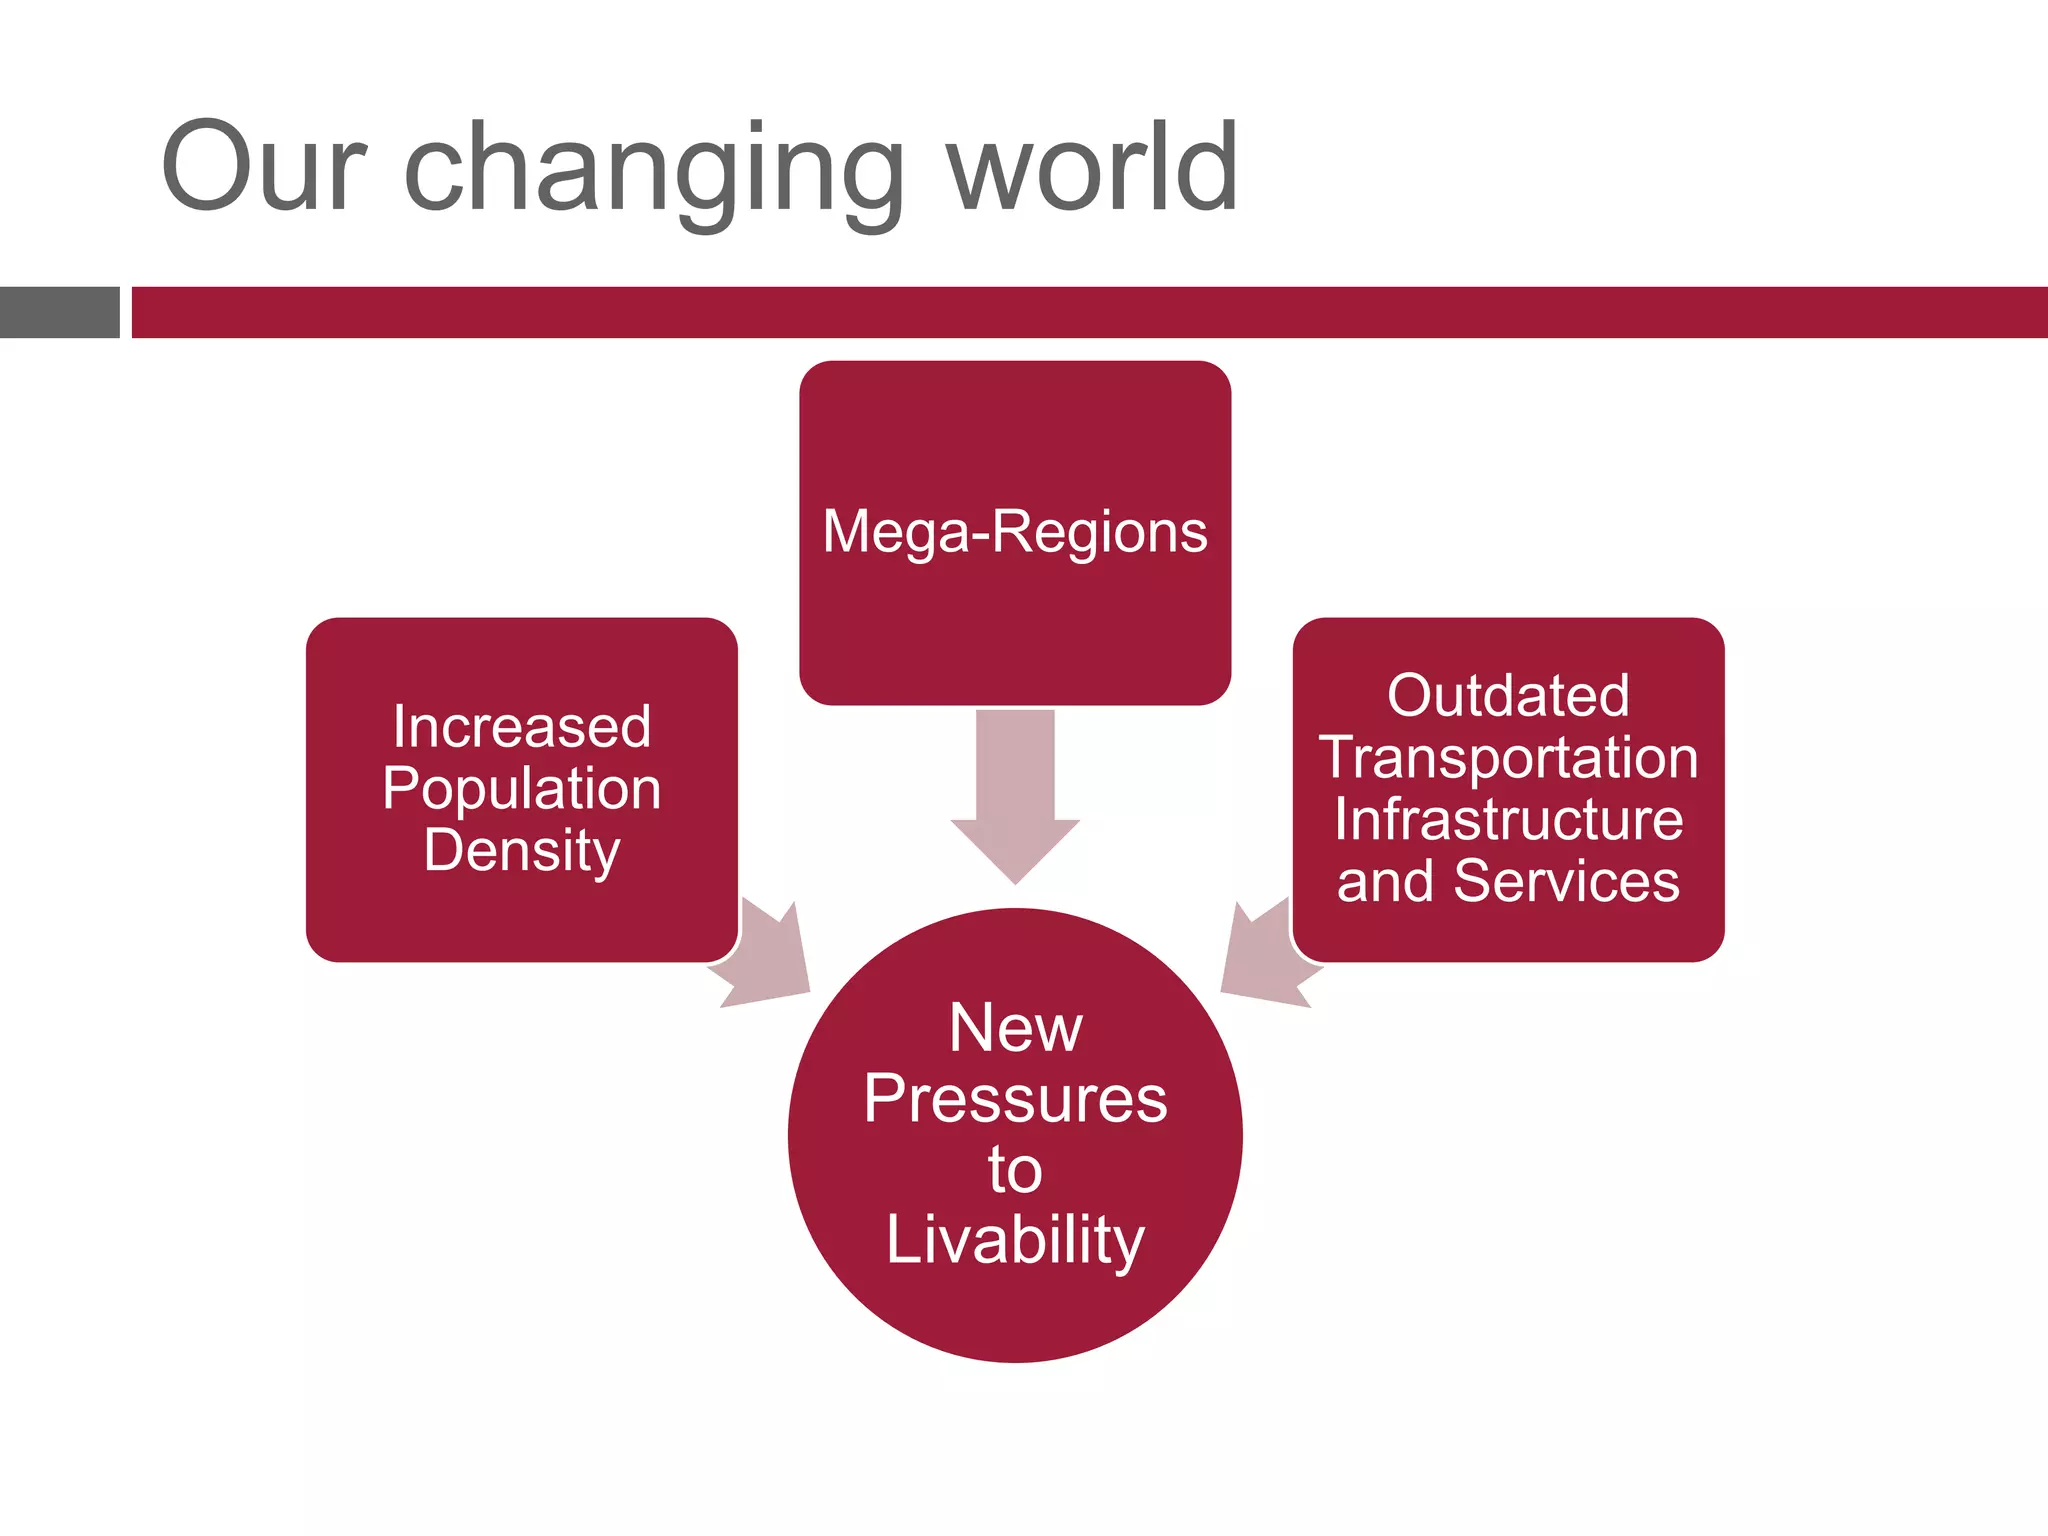
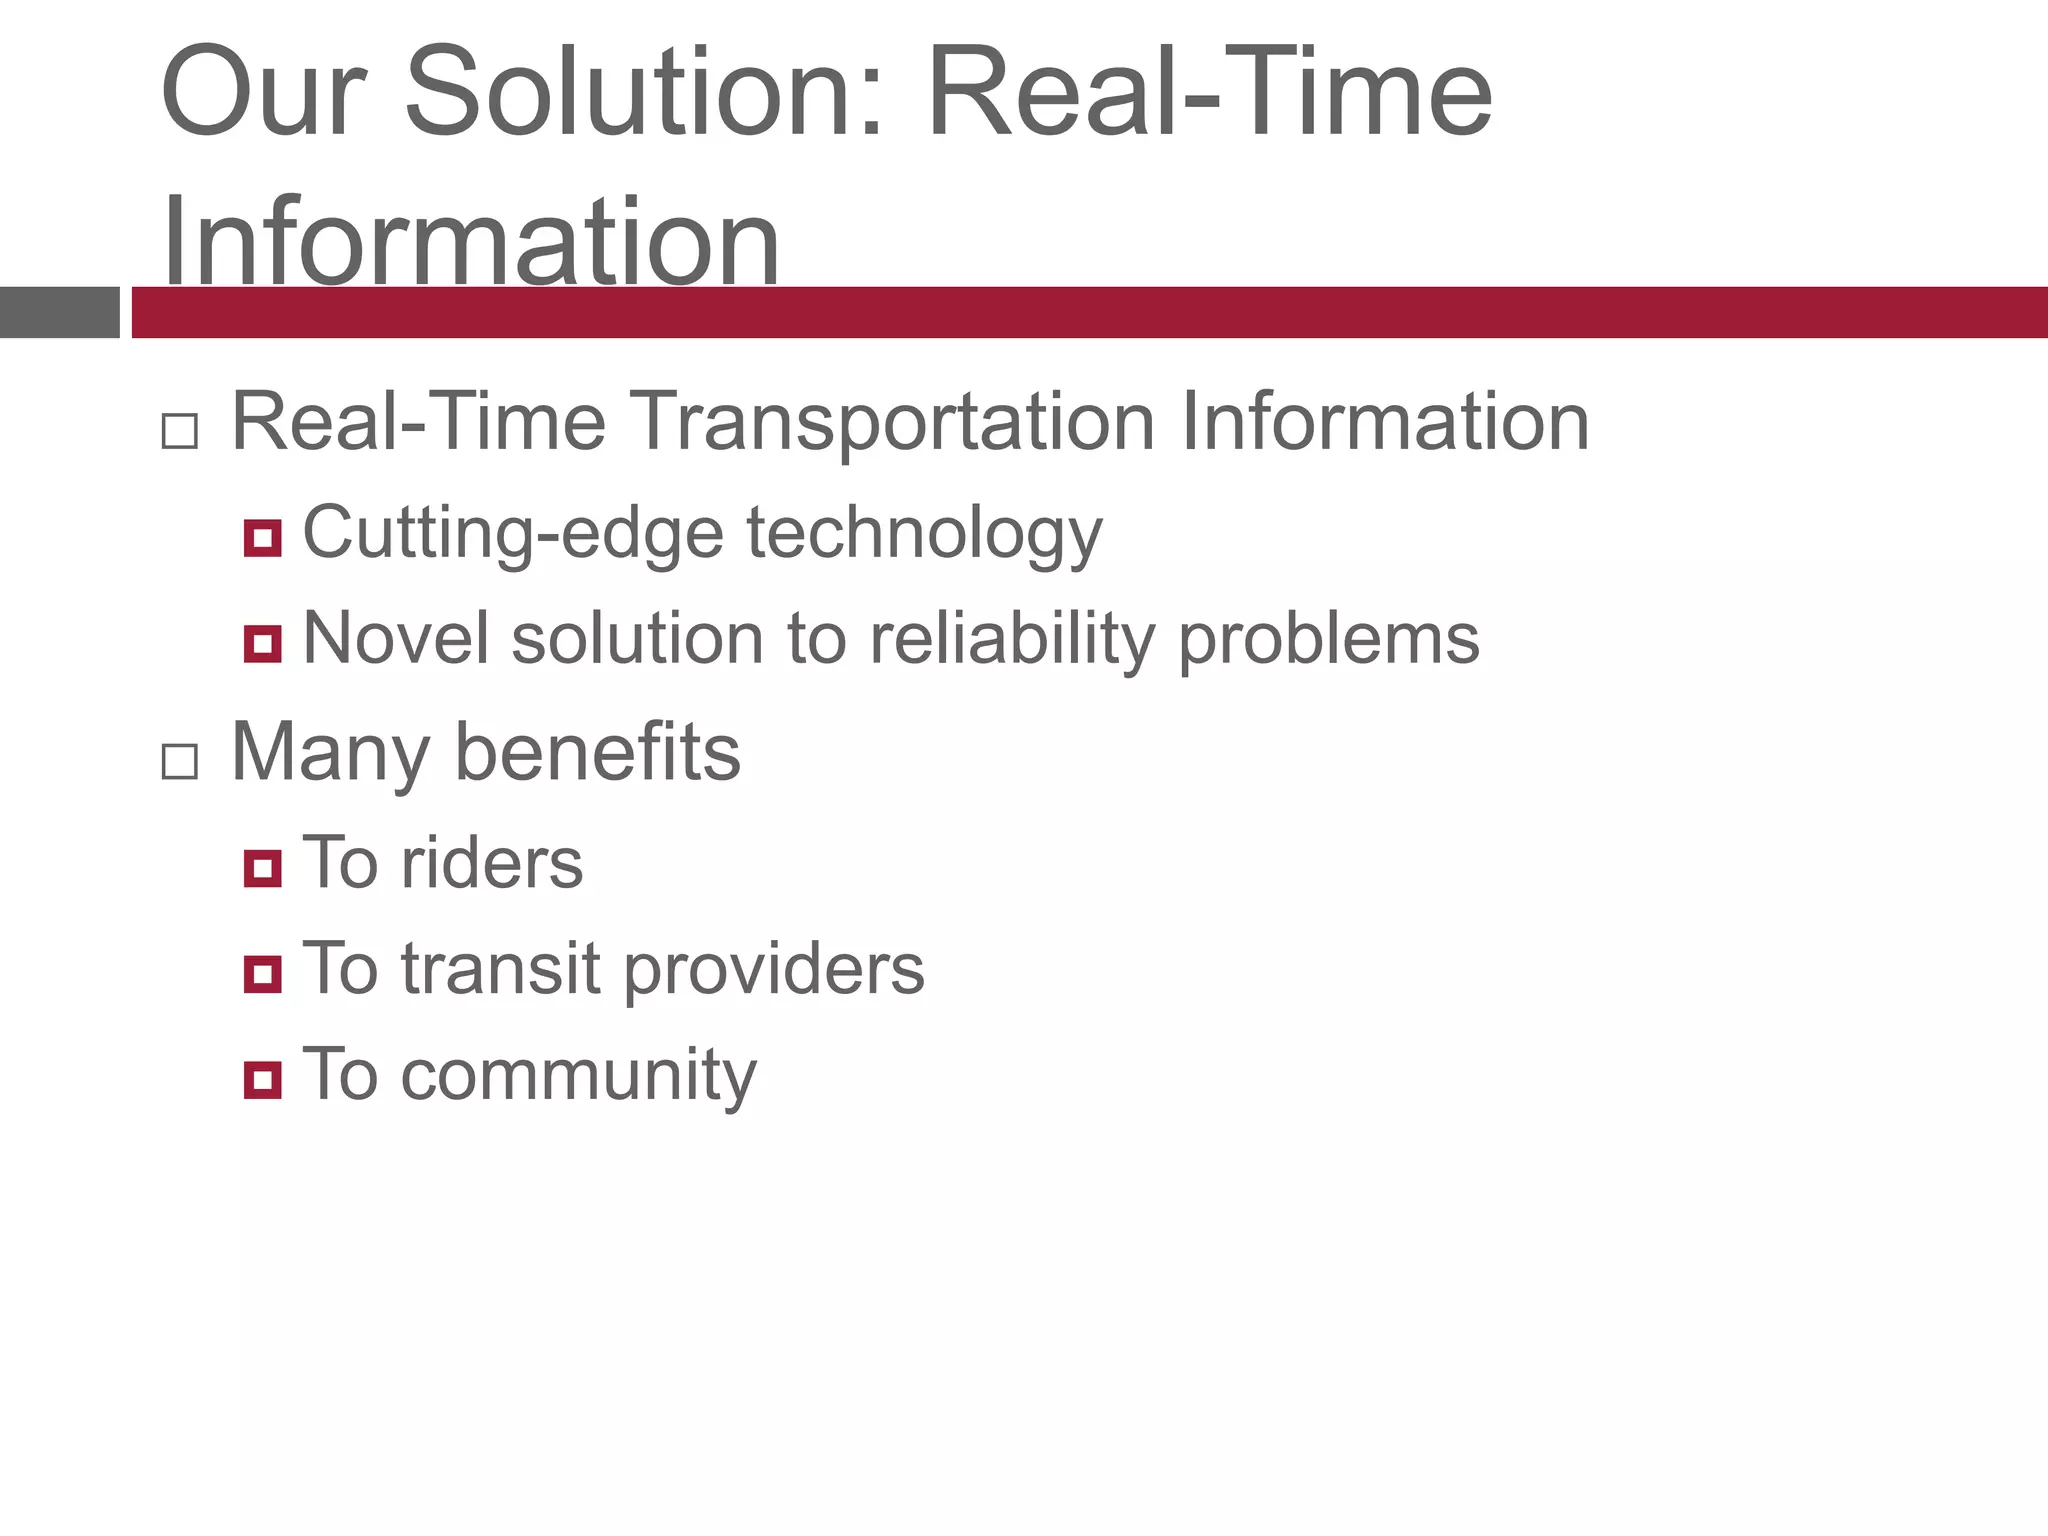
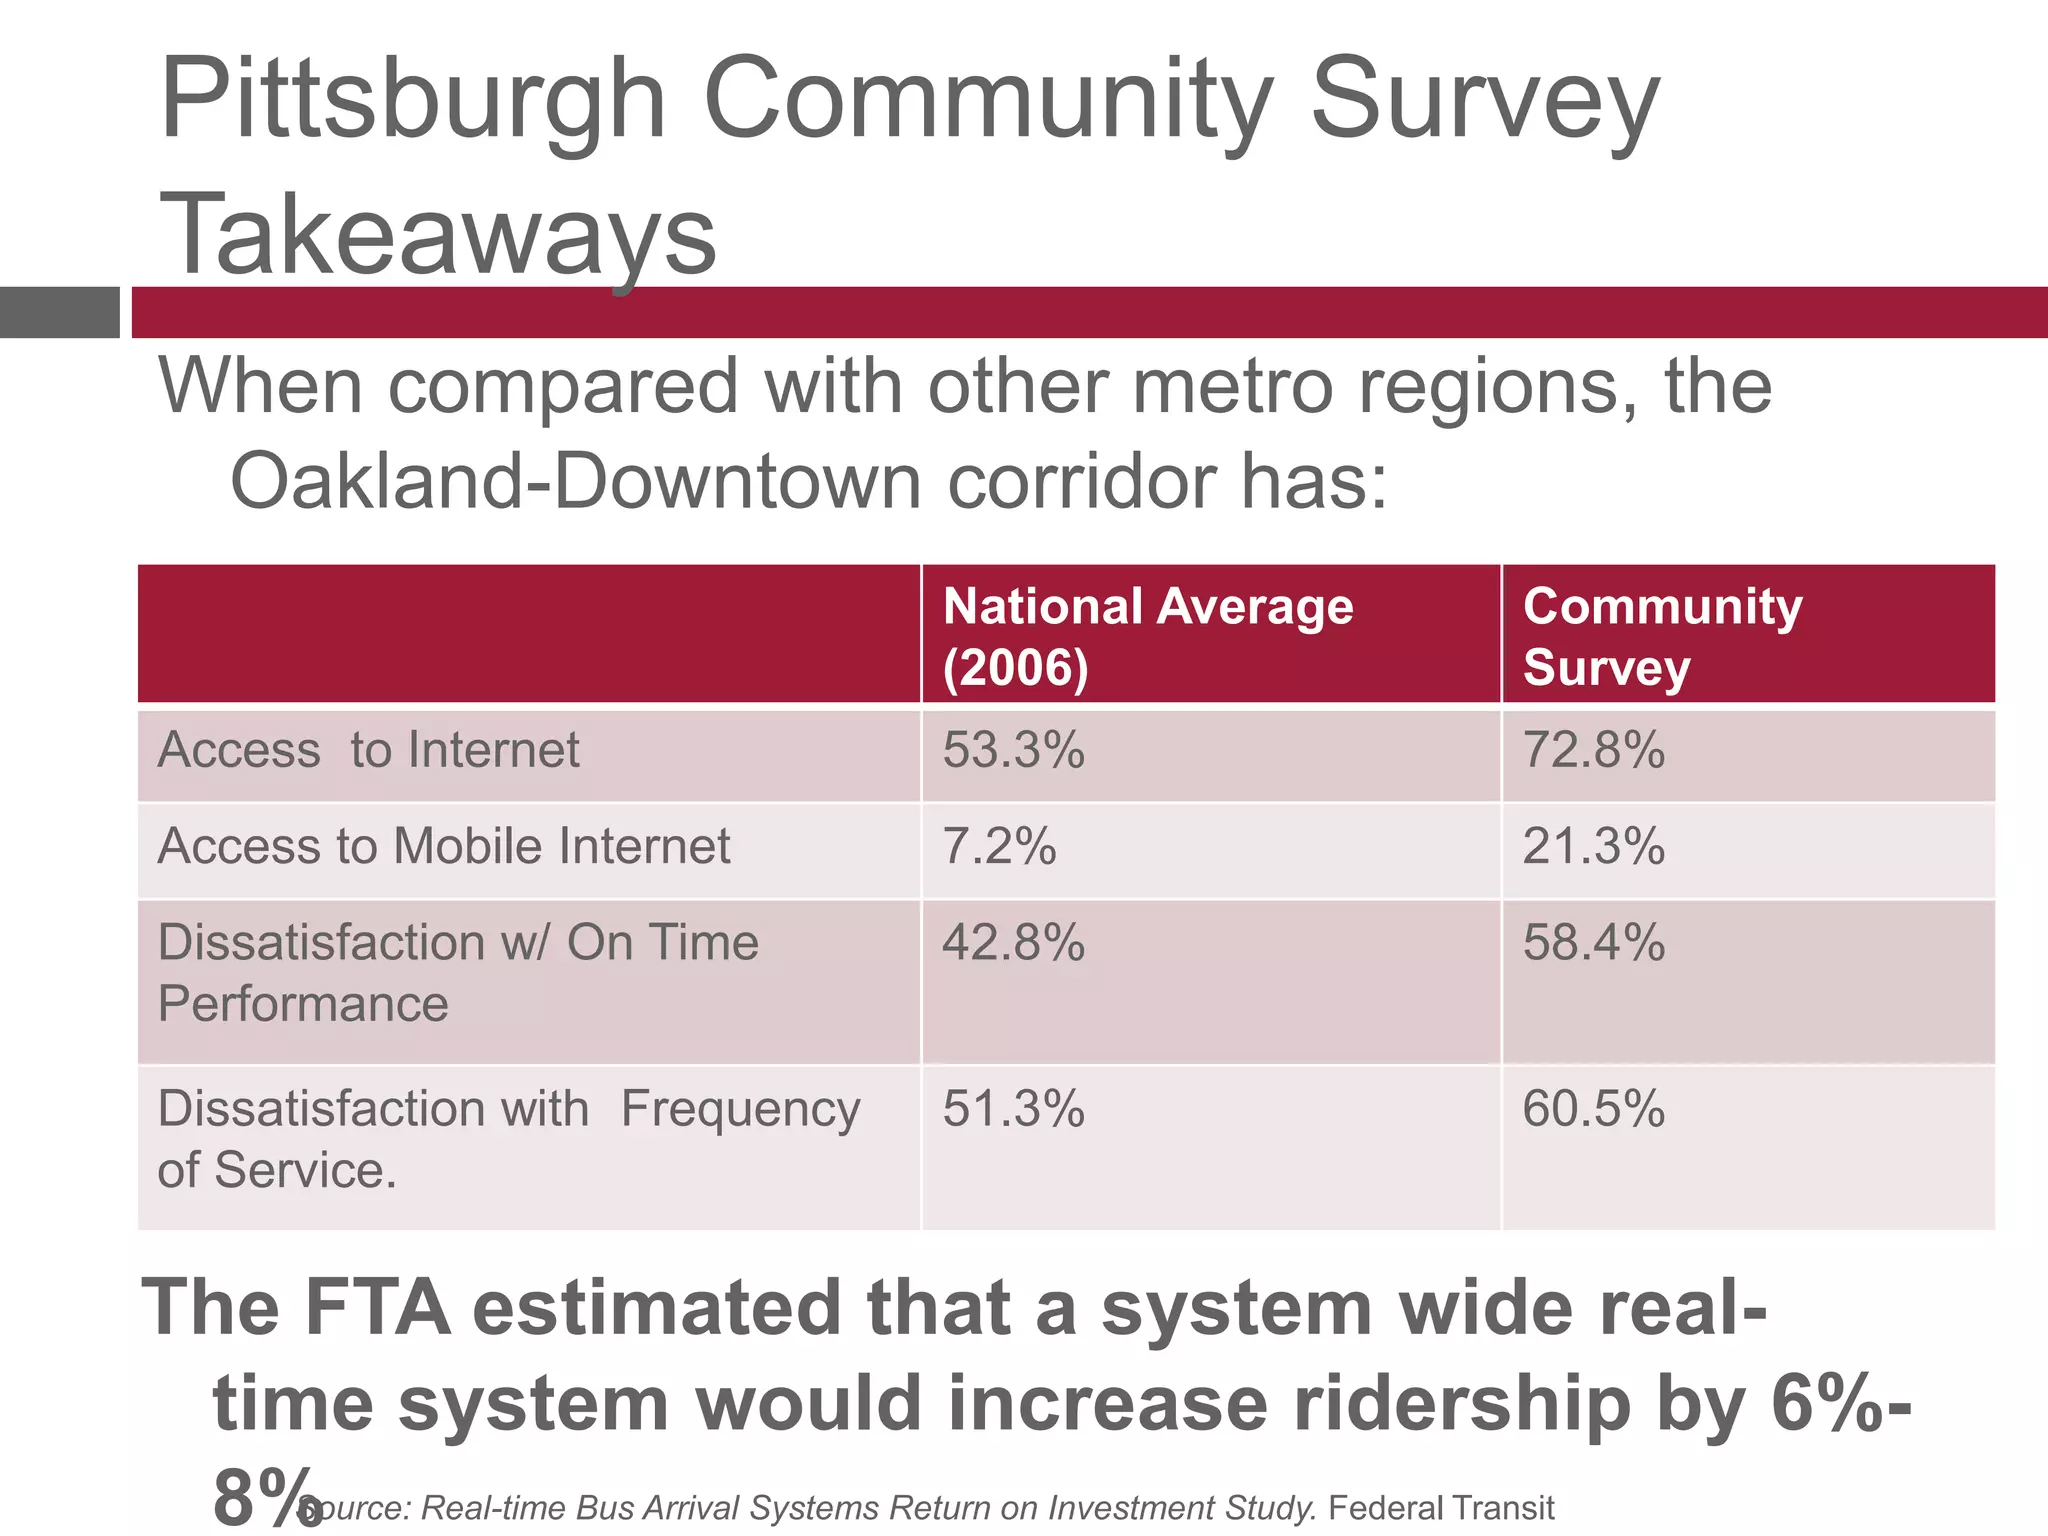
The document outlines a real-time pilot project for the CMU shuttle, detailing its planning, implementation, and results, aimed at improving public transit through advanced technology. Key findings from surveys indicate a need for better timeliness and information dissemination methods among shuttle riders and the Pittsburgh community. Future enhancements include improving the system's algorithms, adding new features, and pursuing funding opportunities.

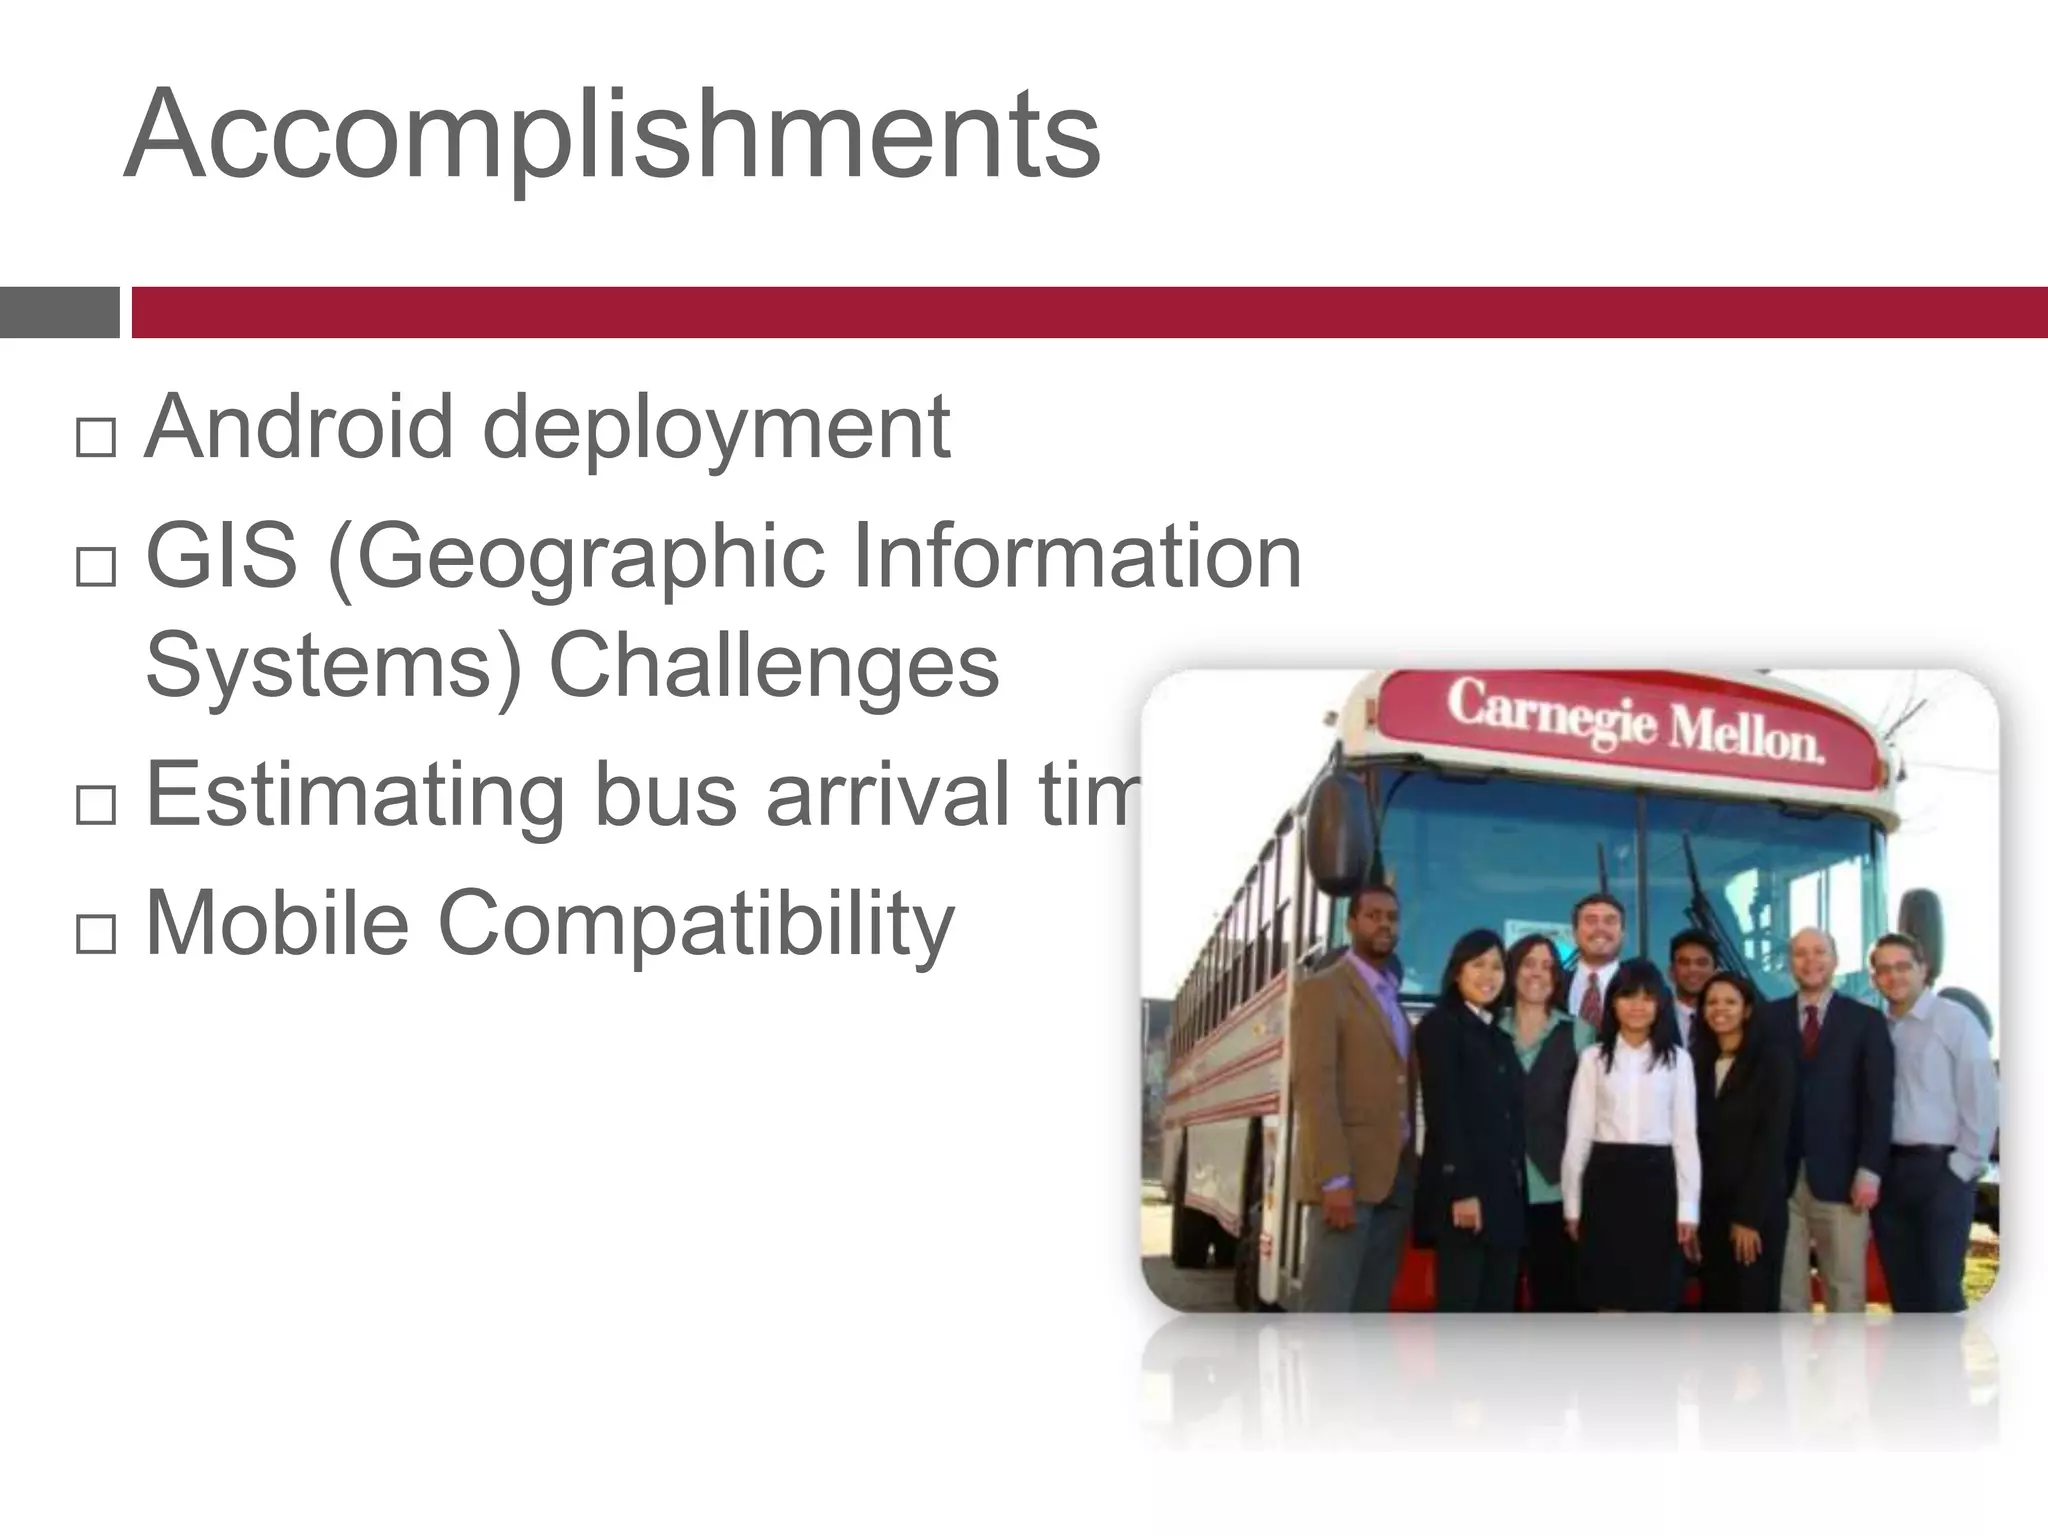
![Challenges Behind the SceneGeographic Information SystemCalculating distance by Vincenty’s formula with ellipsoidal model of earthAccuracy within 0.5mm[1]Route distances vs. straight-line distanceMapping raw GPS to nearest bus stopGeocoding with Google MapReverse GeocodingEncoded Geopolyline mappingAjax and timer for updating real-timeCross-Browser Compatibility[1] Source: http://www.movable-type.co.uk/scripts/latlong-vincenty.html](https://image.slidesharecdn.com/myridecarnegiemellonuniversity-091209150748-phpapp02/75/myRide-A-Real-Time-Information-System-for-the-Carnegie-Mellon-University-Shuttle-31-2048.jpg)
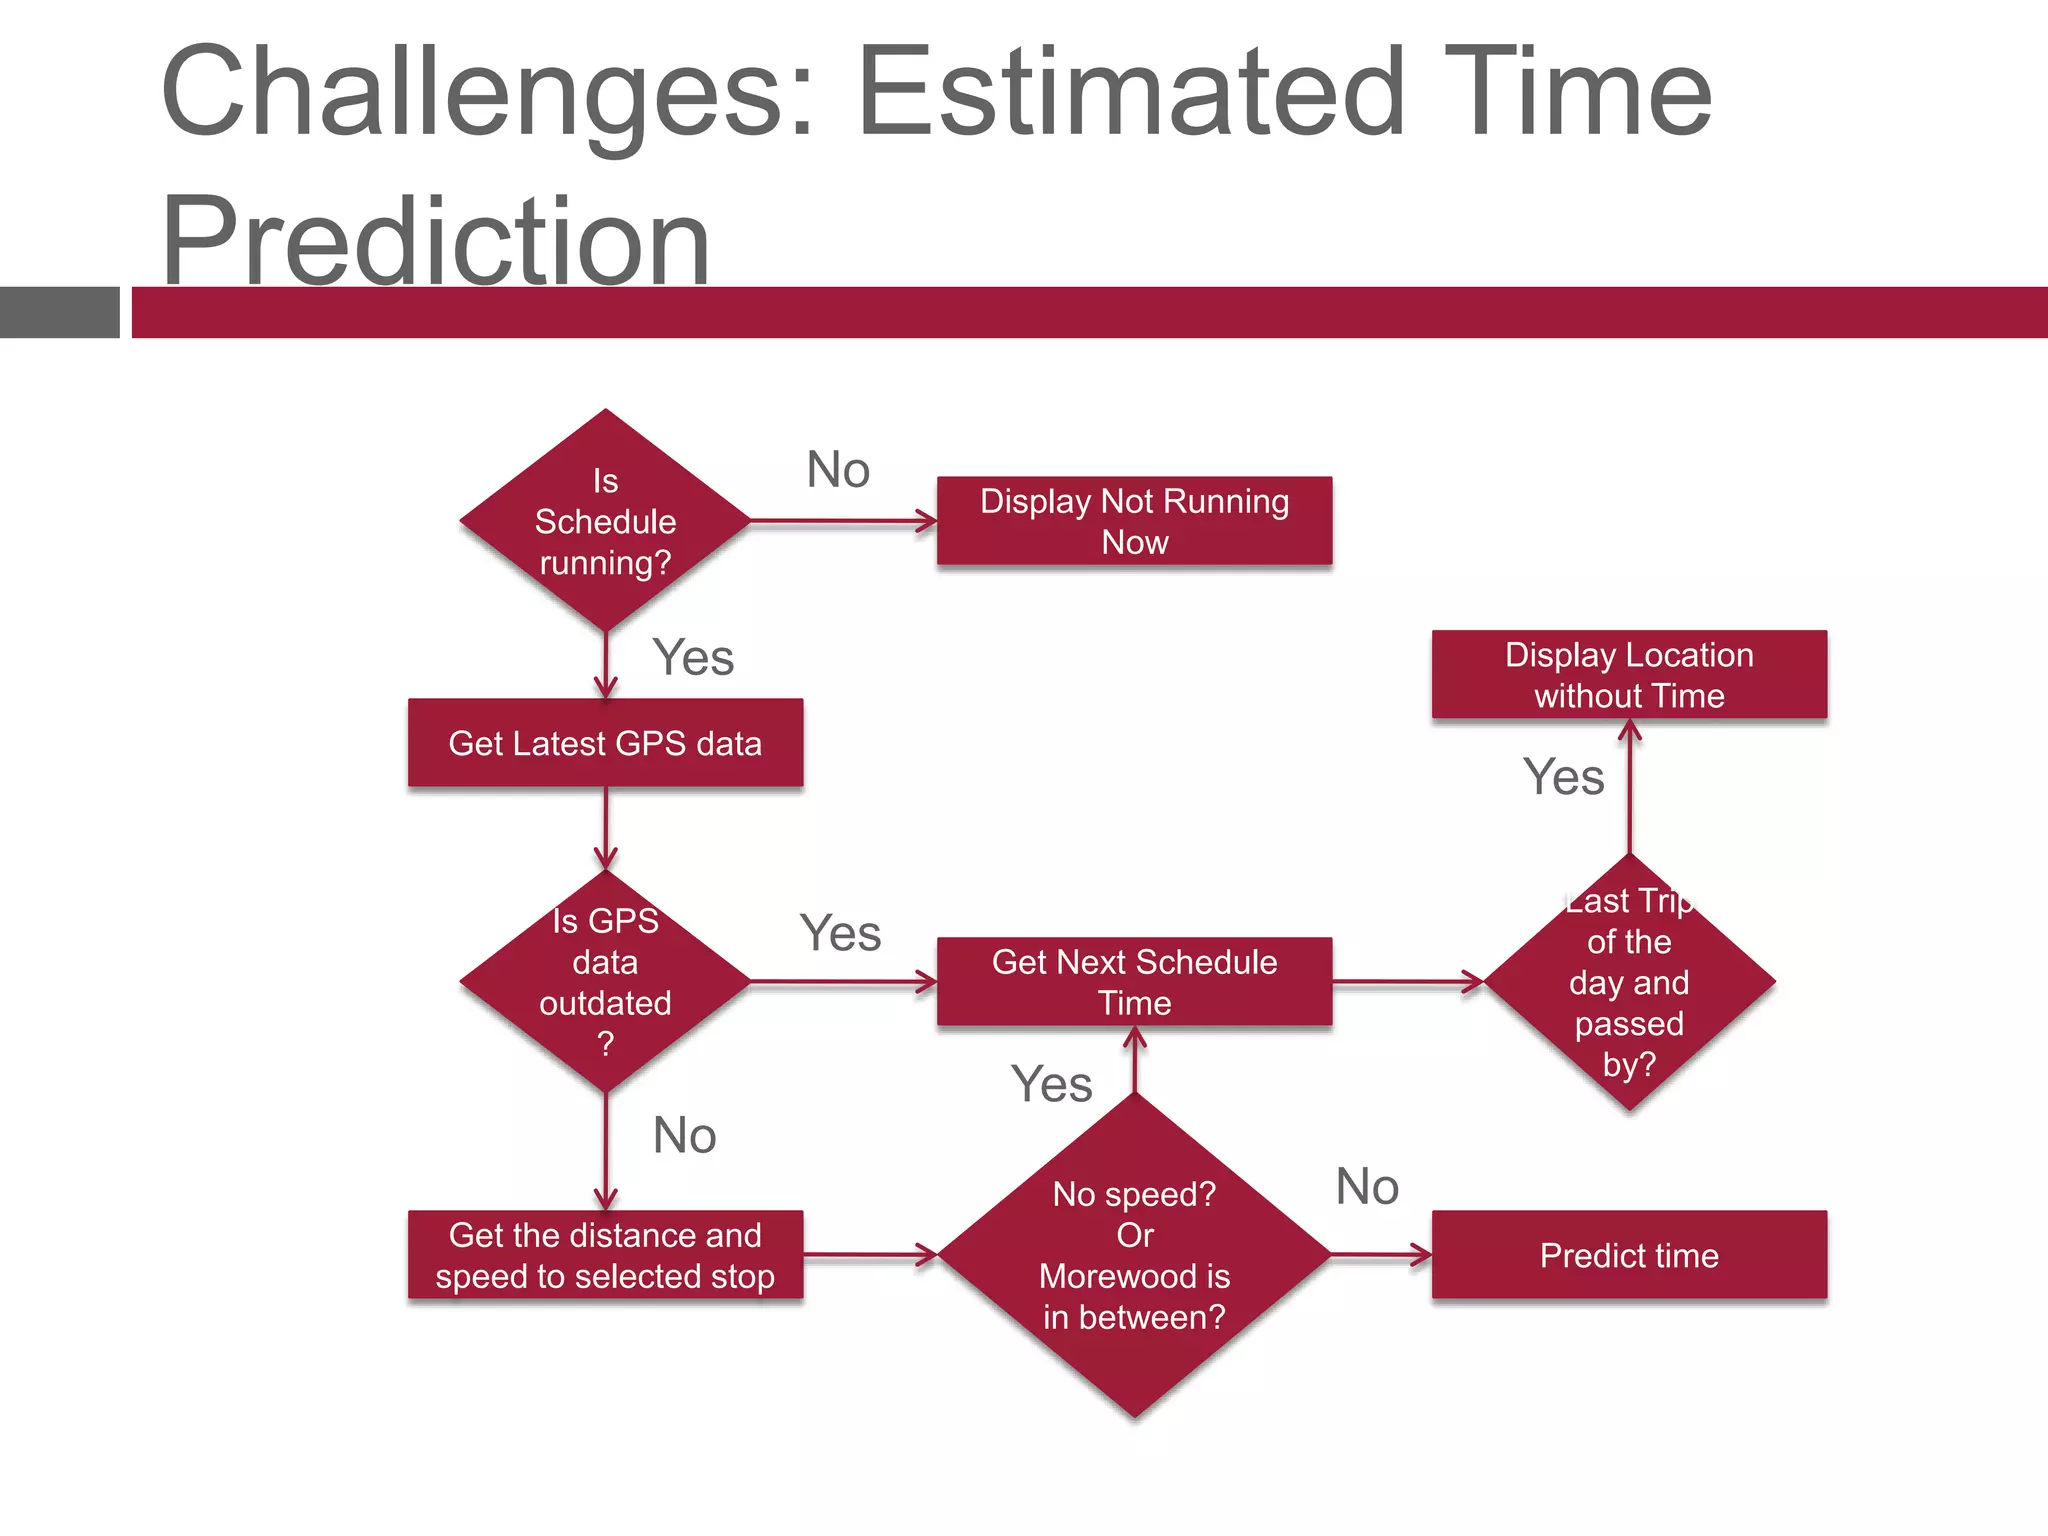
![Challenges: Estimated Time PredictionInaccurate schedule stop timesExponentially Weighted Moving AverageProblem with frequent stop times Kalman-Filter Prediction Algorithms[1]Consider dwelling timesVarious Scenarios Select stop timeSchedule timeLast trip[1] Source: Prediction Models of Bus Arrival and Departure Times, University of Toronto](https://image.slidesharecdn.com/myridecarnegiemellonuniversity-091209150748-phpapp02/75/myRide-A-Real-Time-Information-System-for-the-Carnegie-Mellon-University-Shuttle-32-2048.jpg)