Downloaded 28 times
![Thank you for your attention… [email_address]](https://image.slidesharecdn.com/morteniccsa2011final-110628094333-phpapp02/75/Accessibility-Analysis-and-Modeling-in-Public-Transport-Networks-A-Raster-based-Approach-21-2048.jpg)

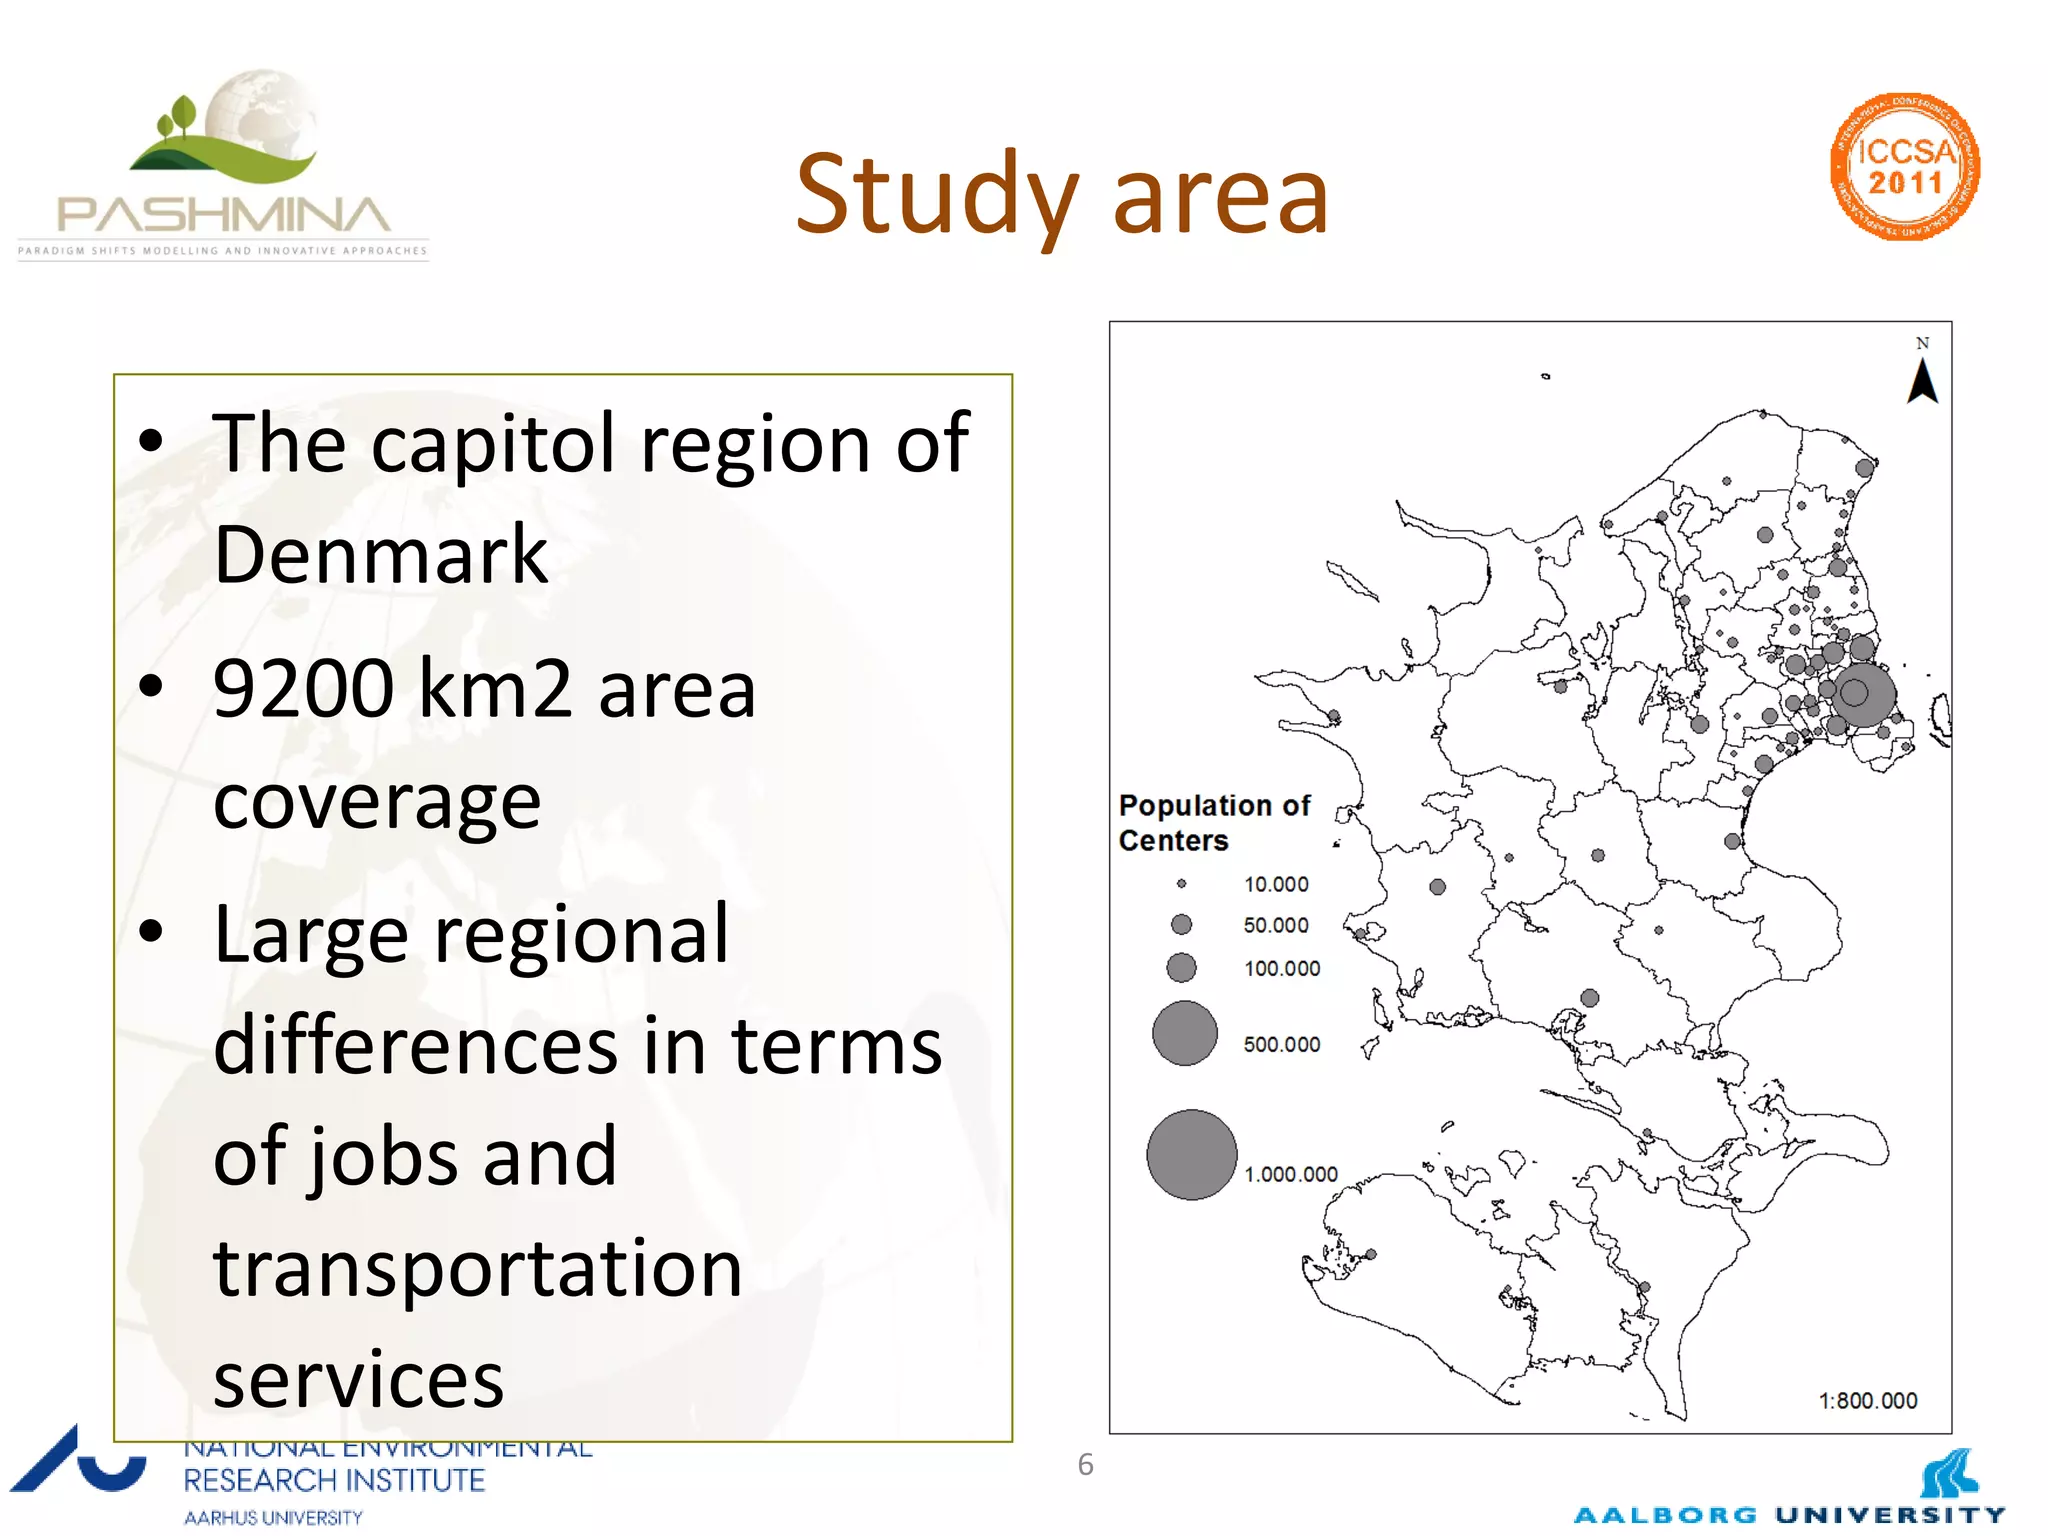
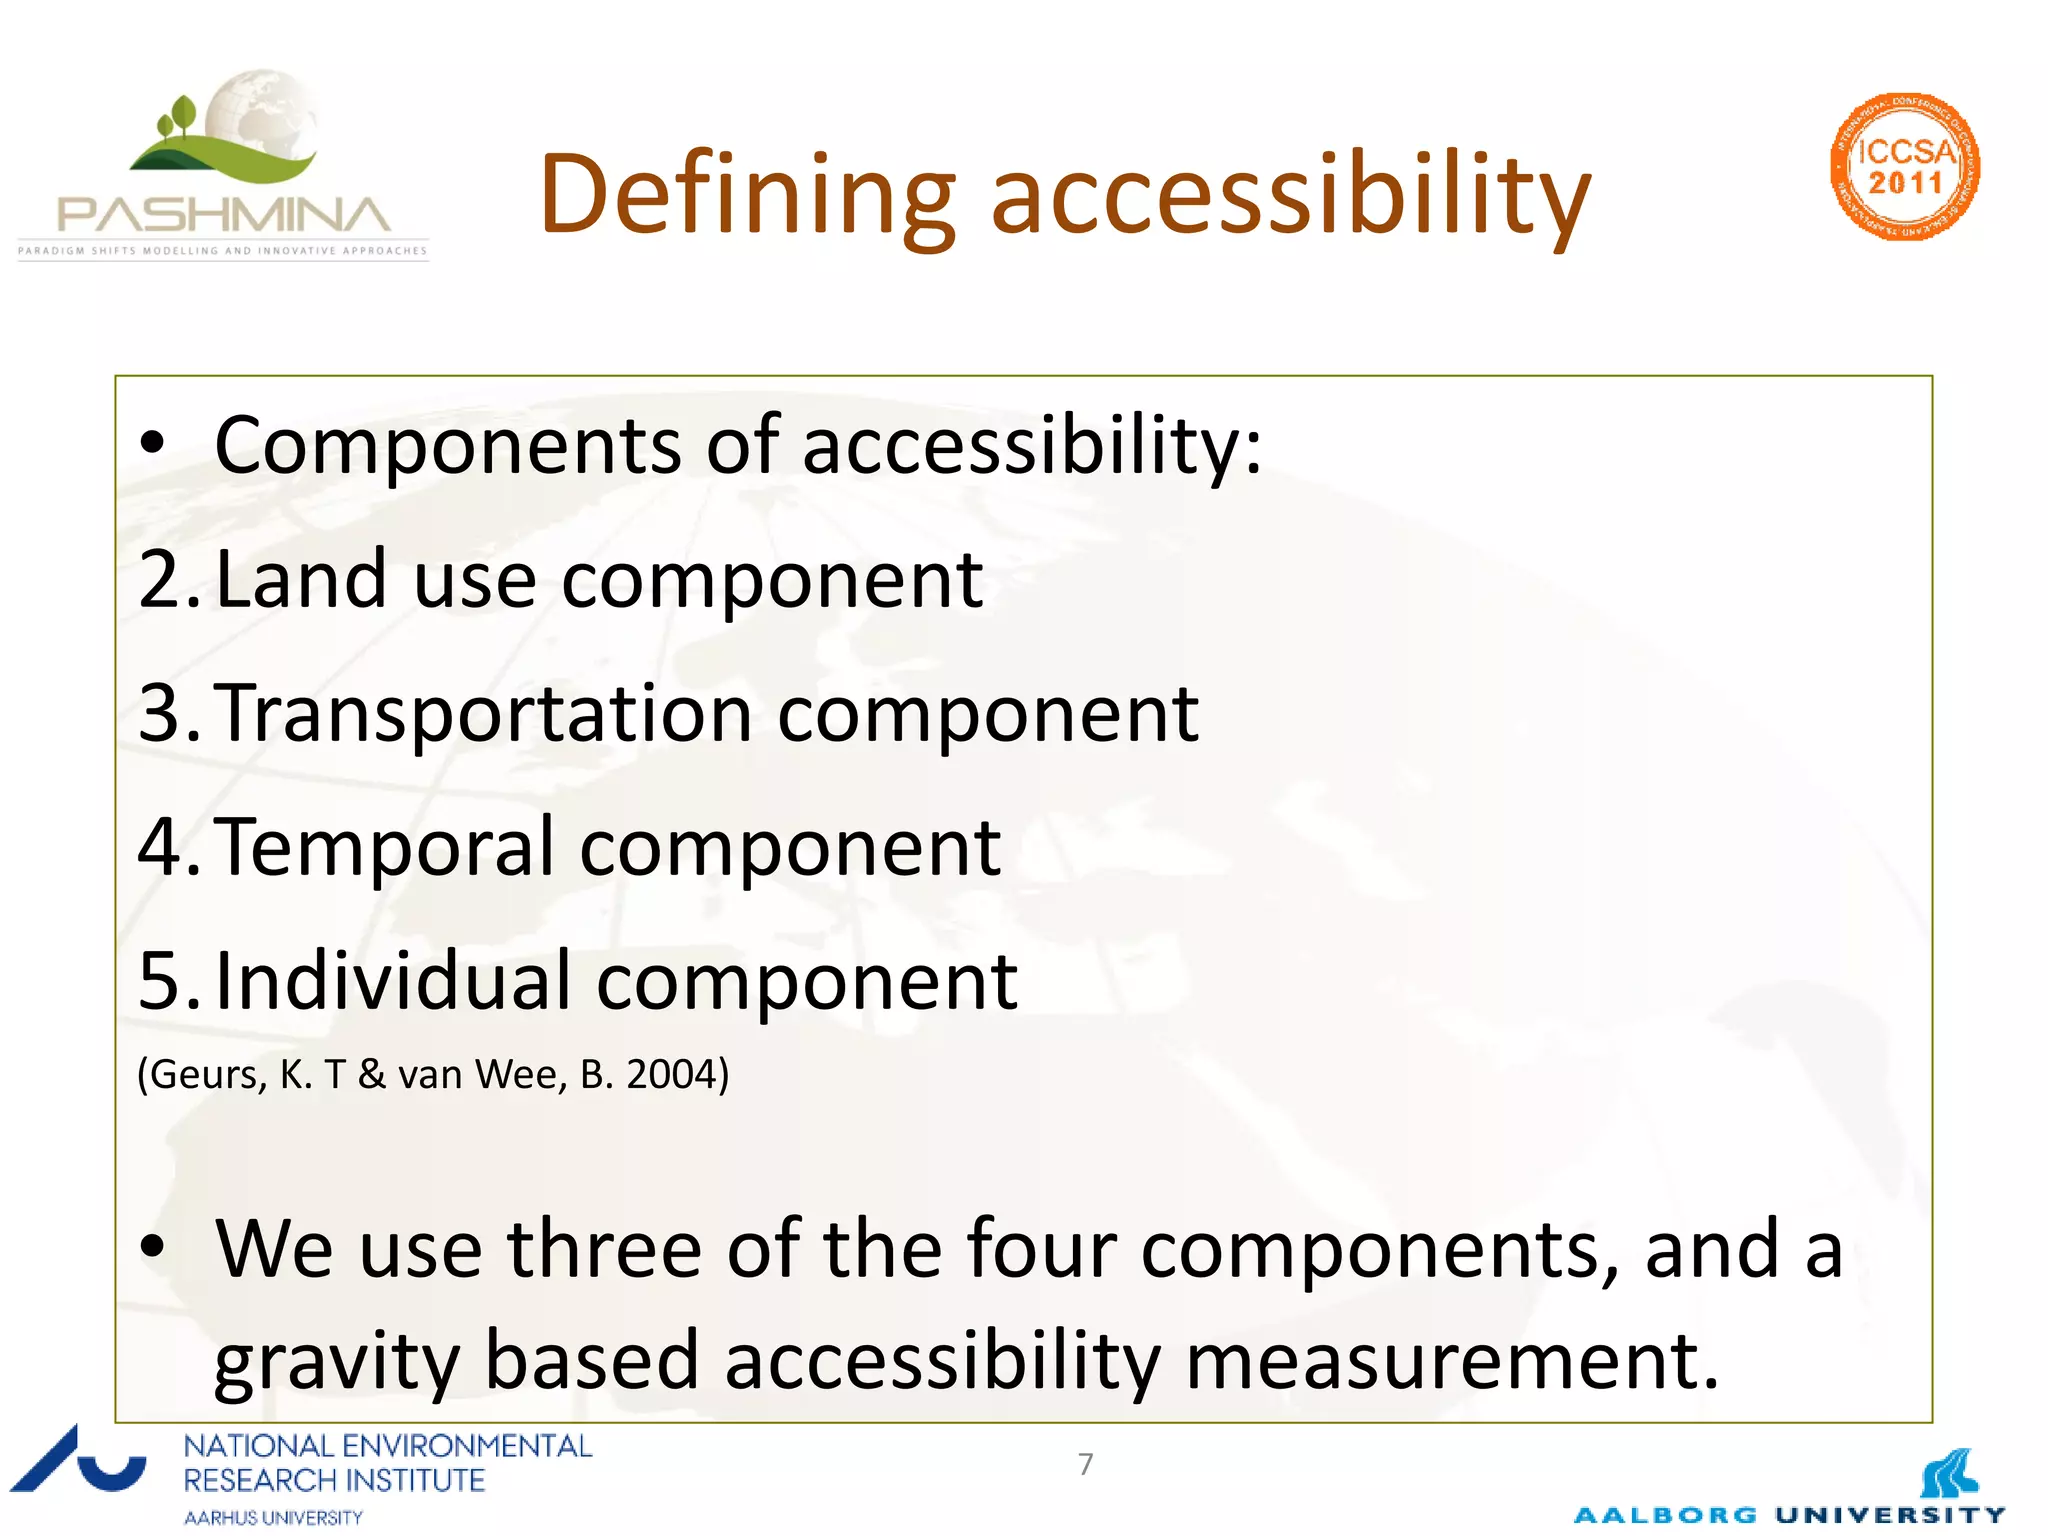
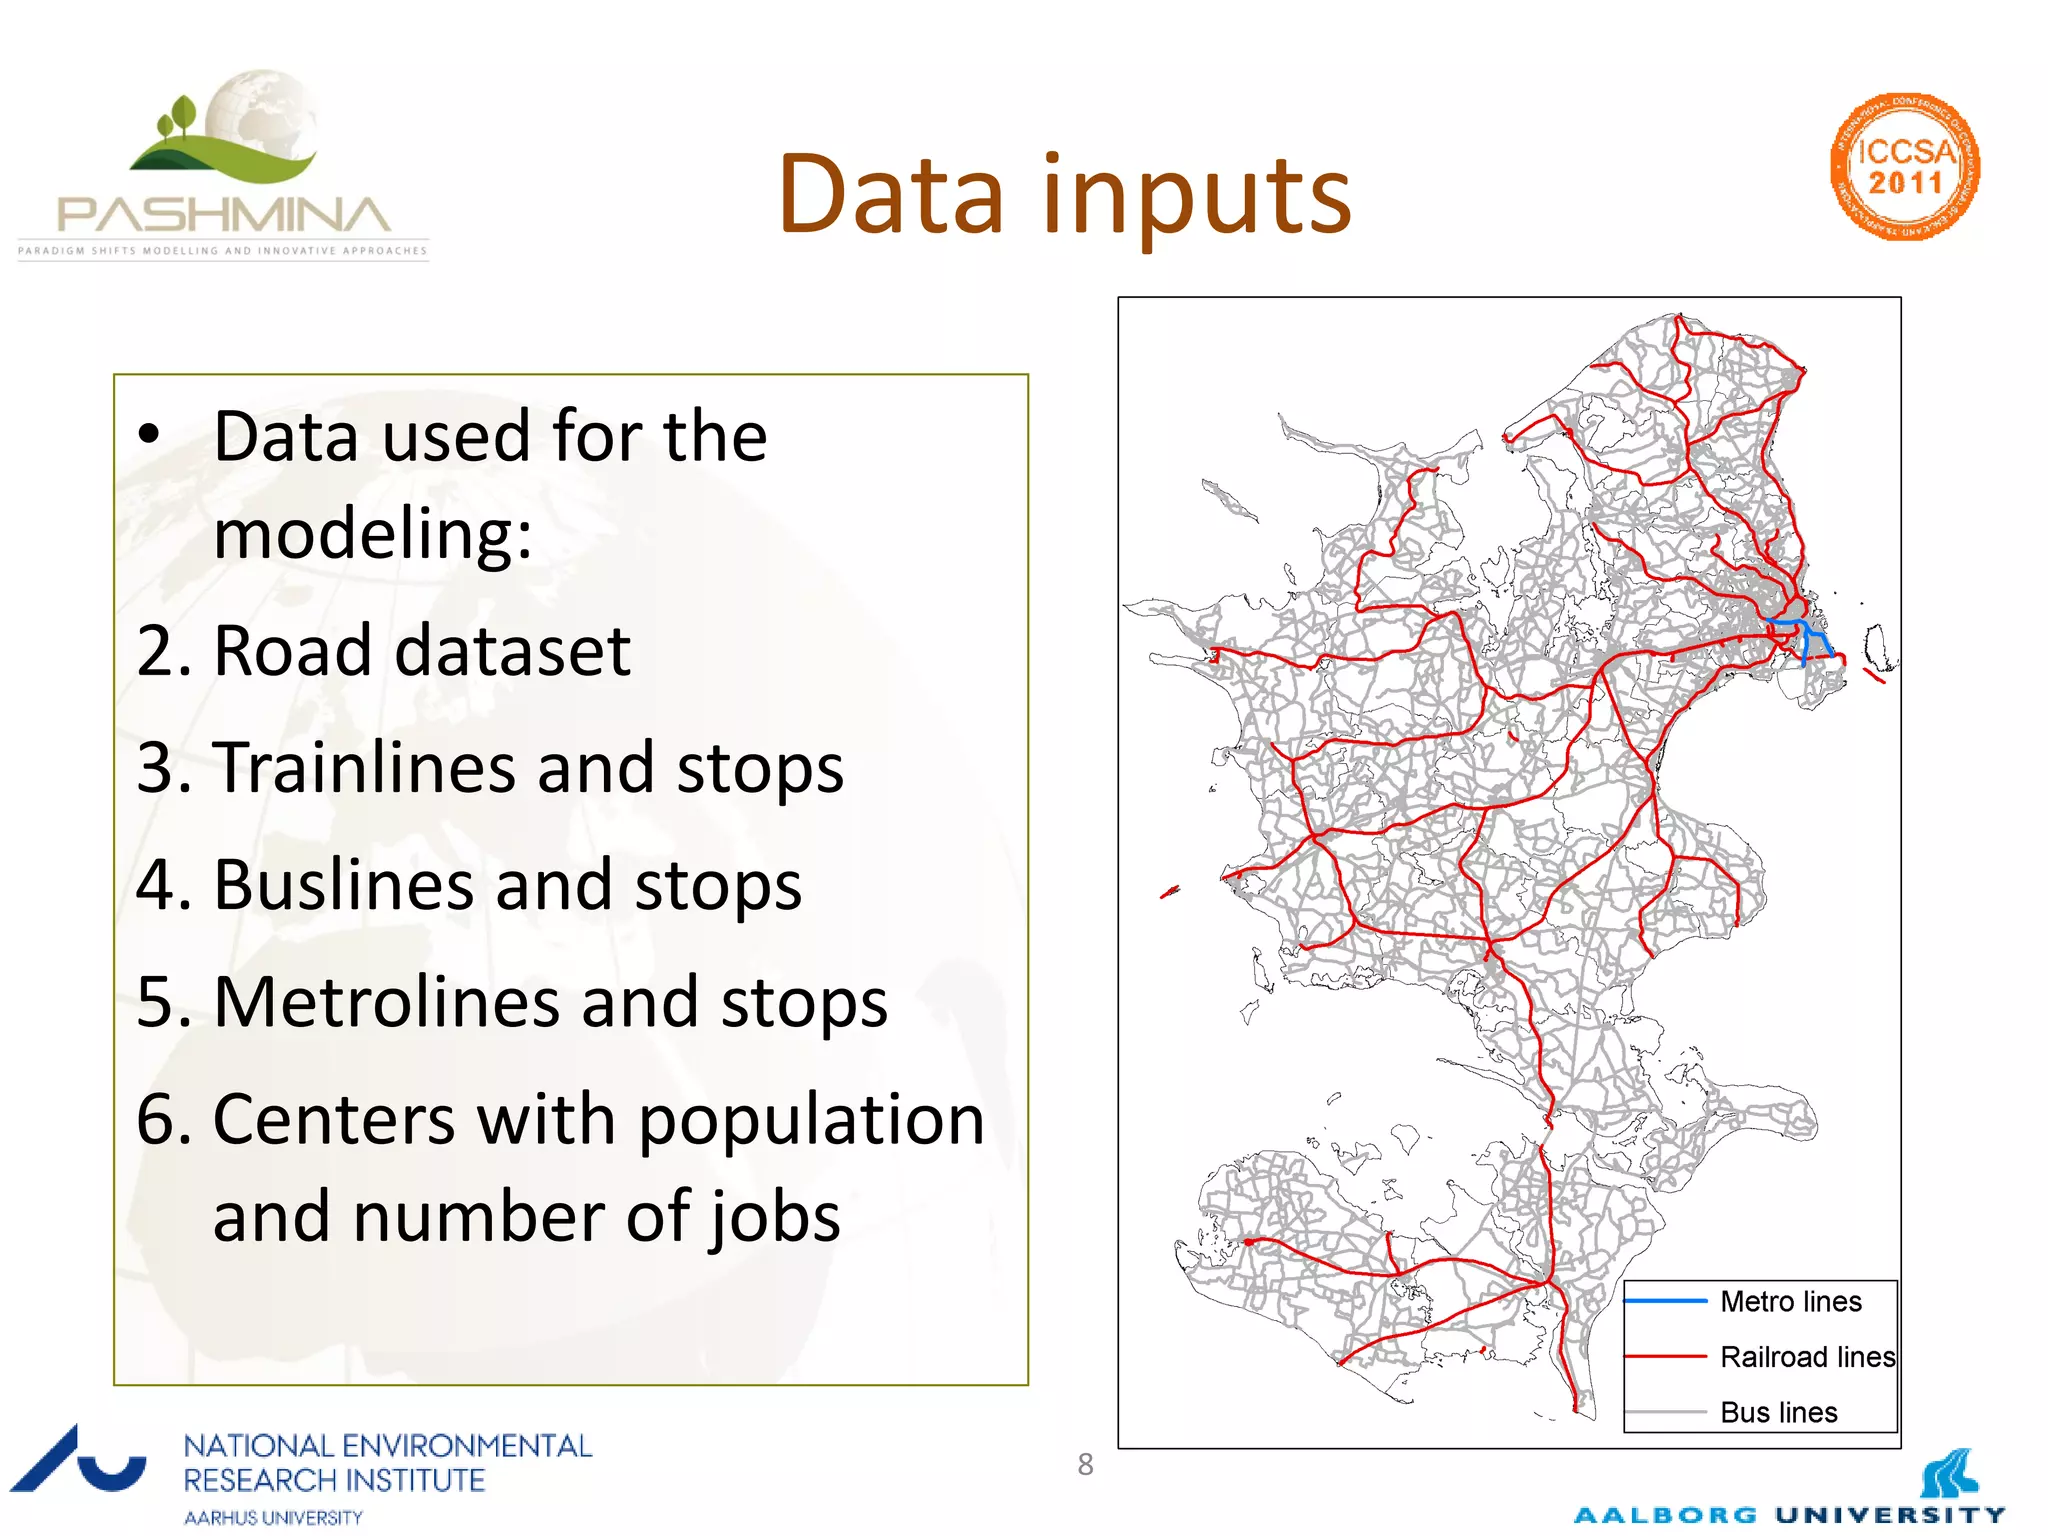
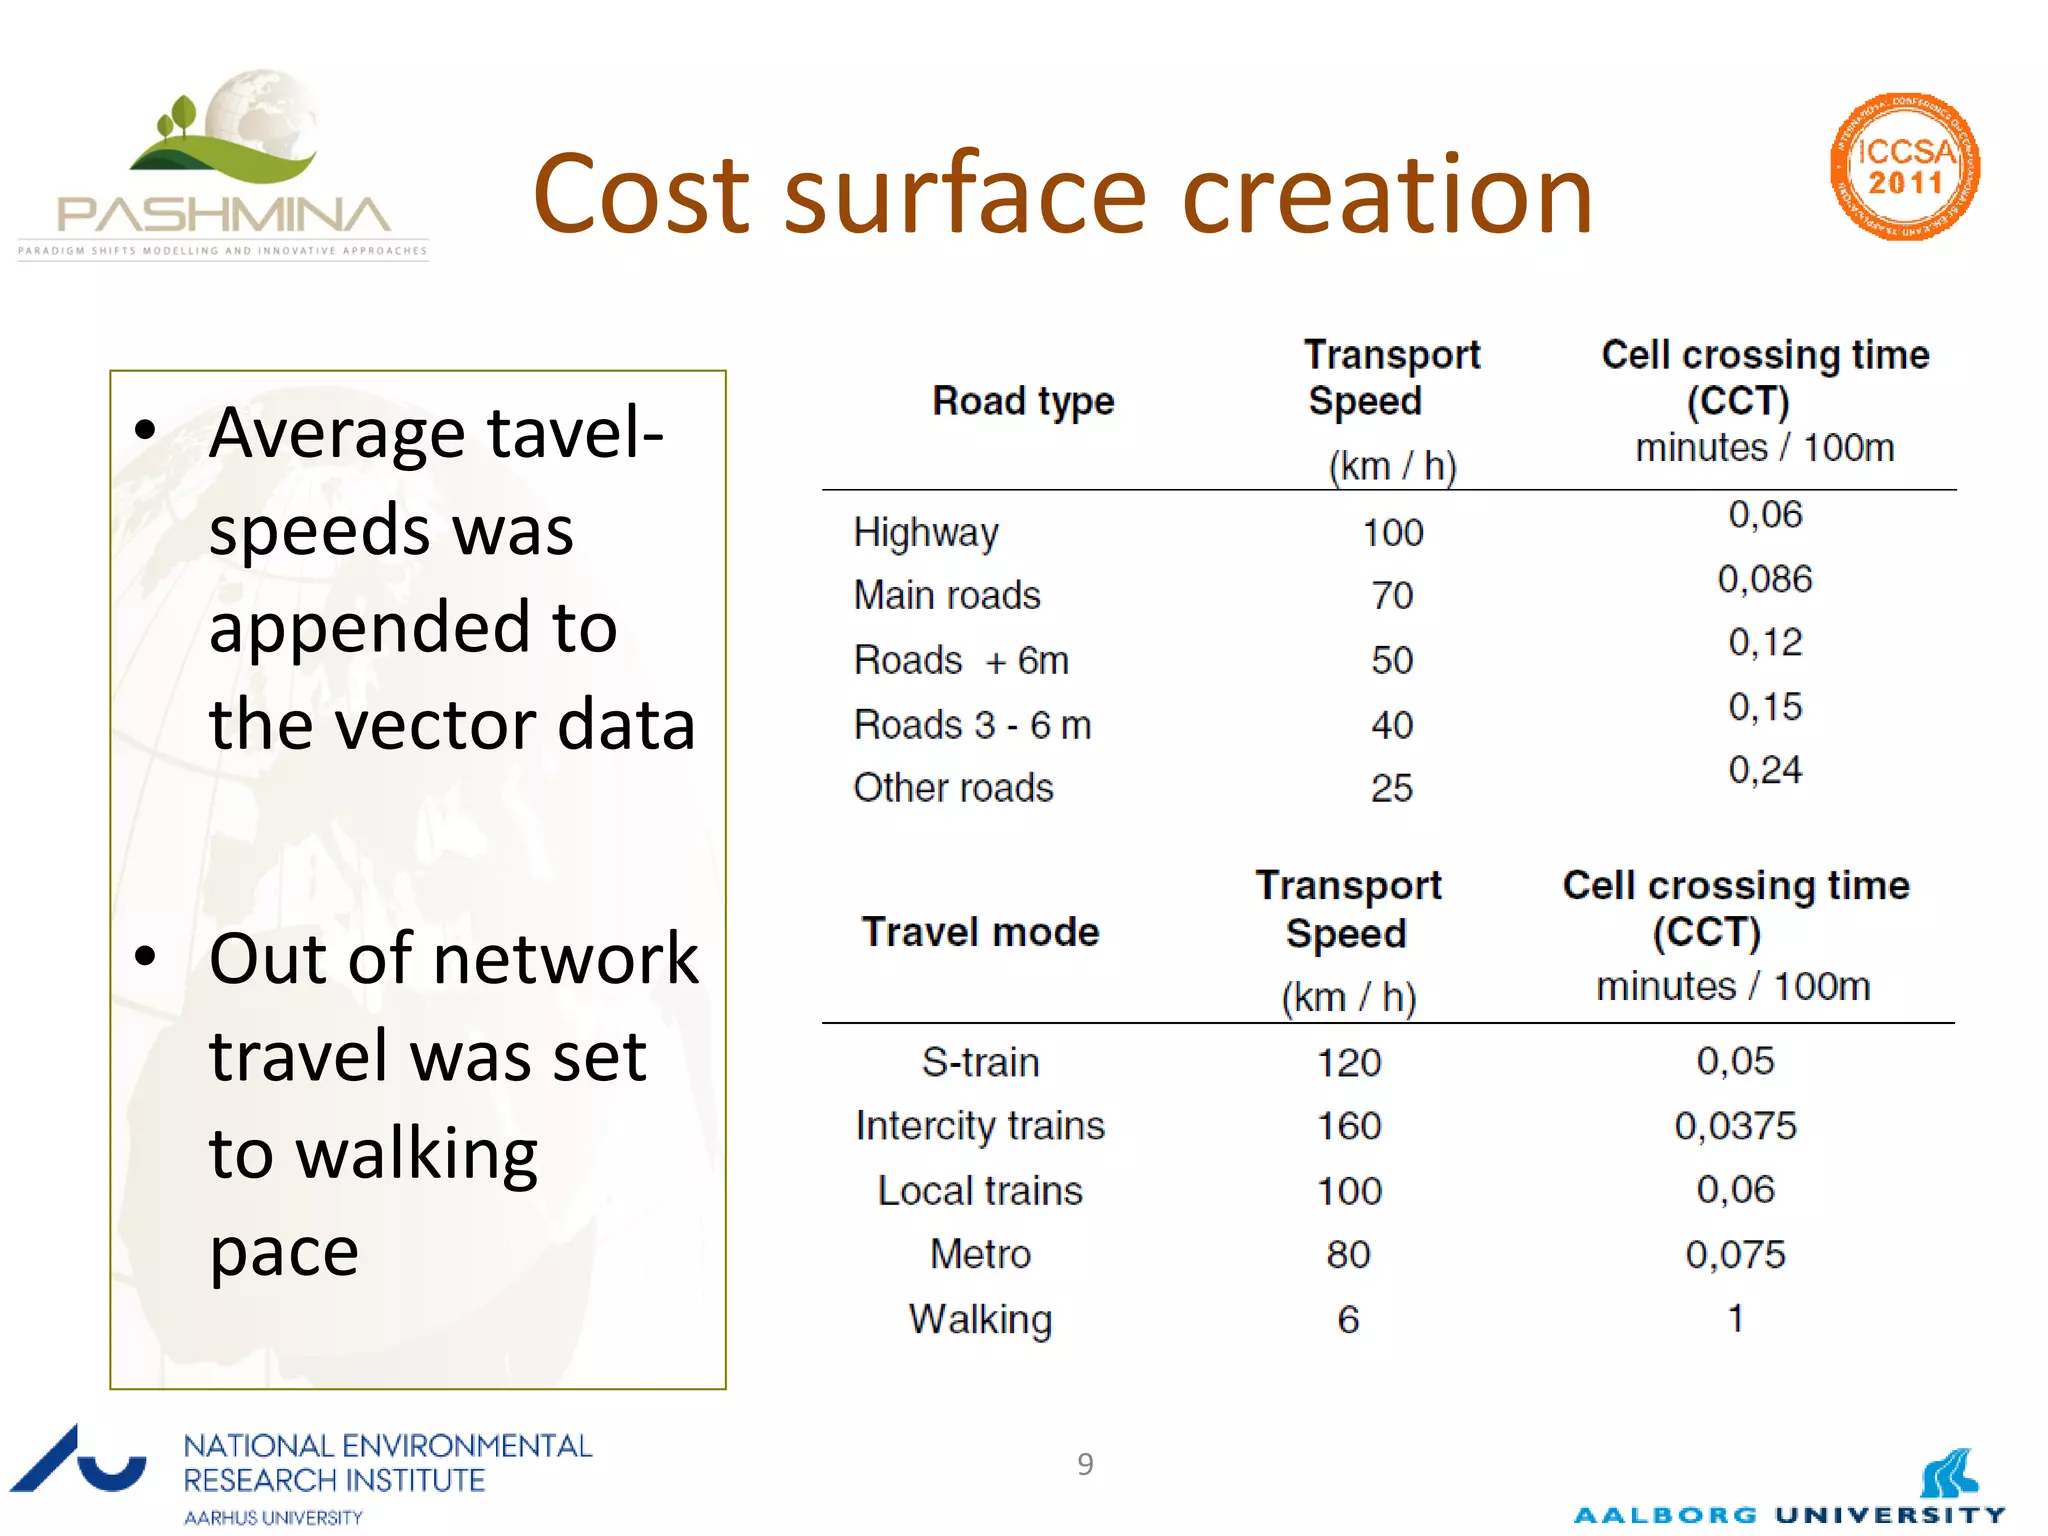
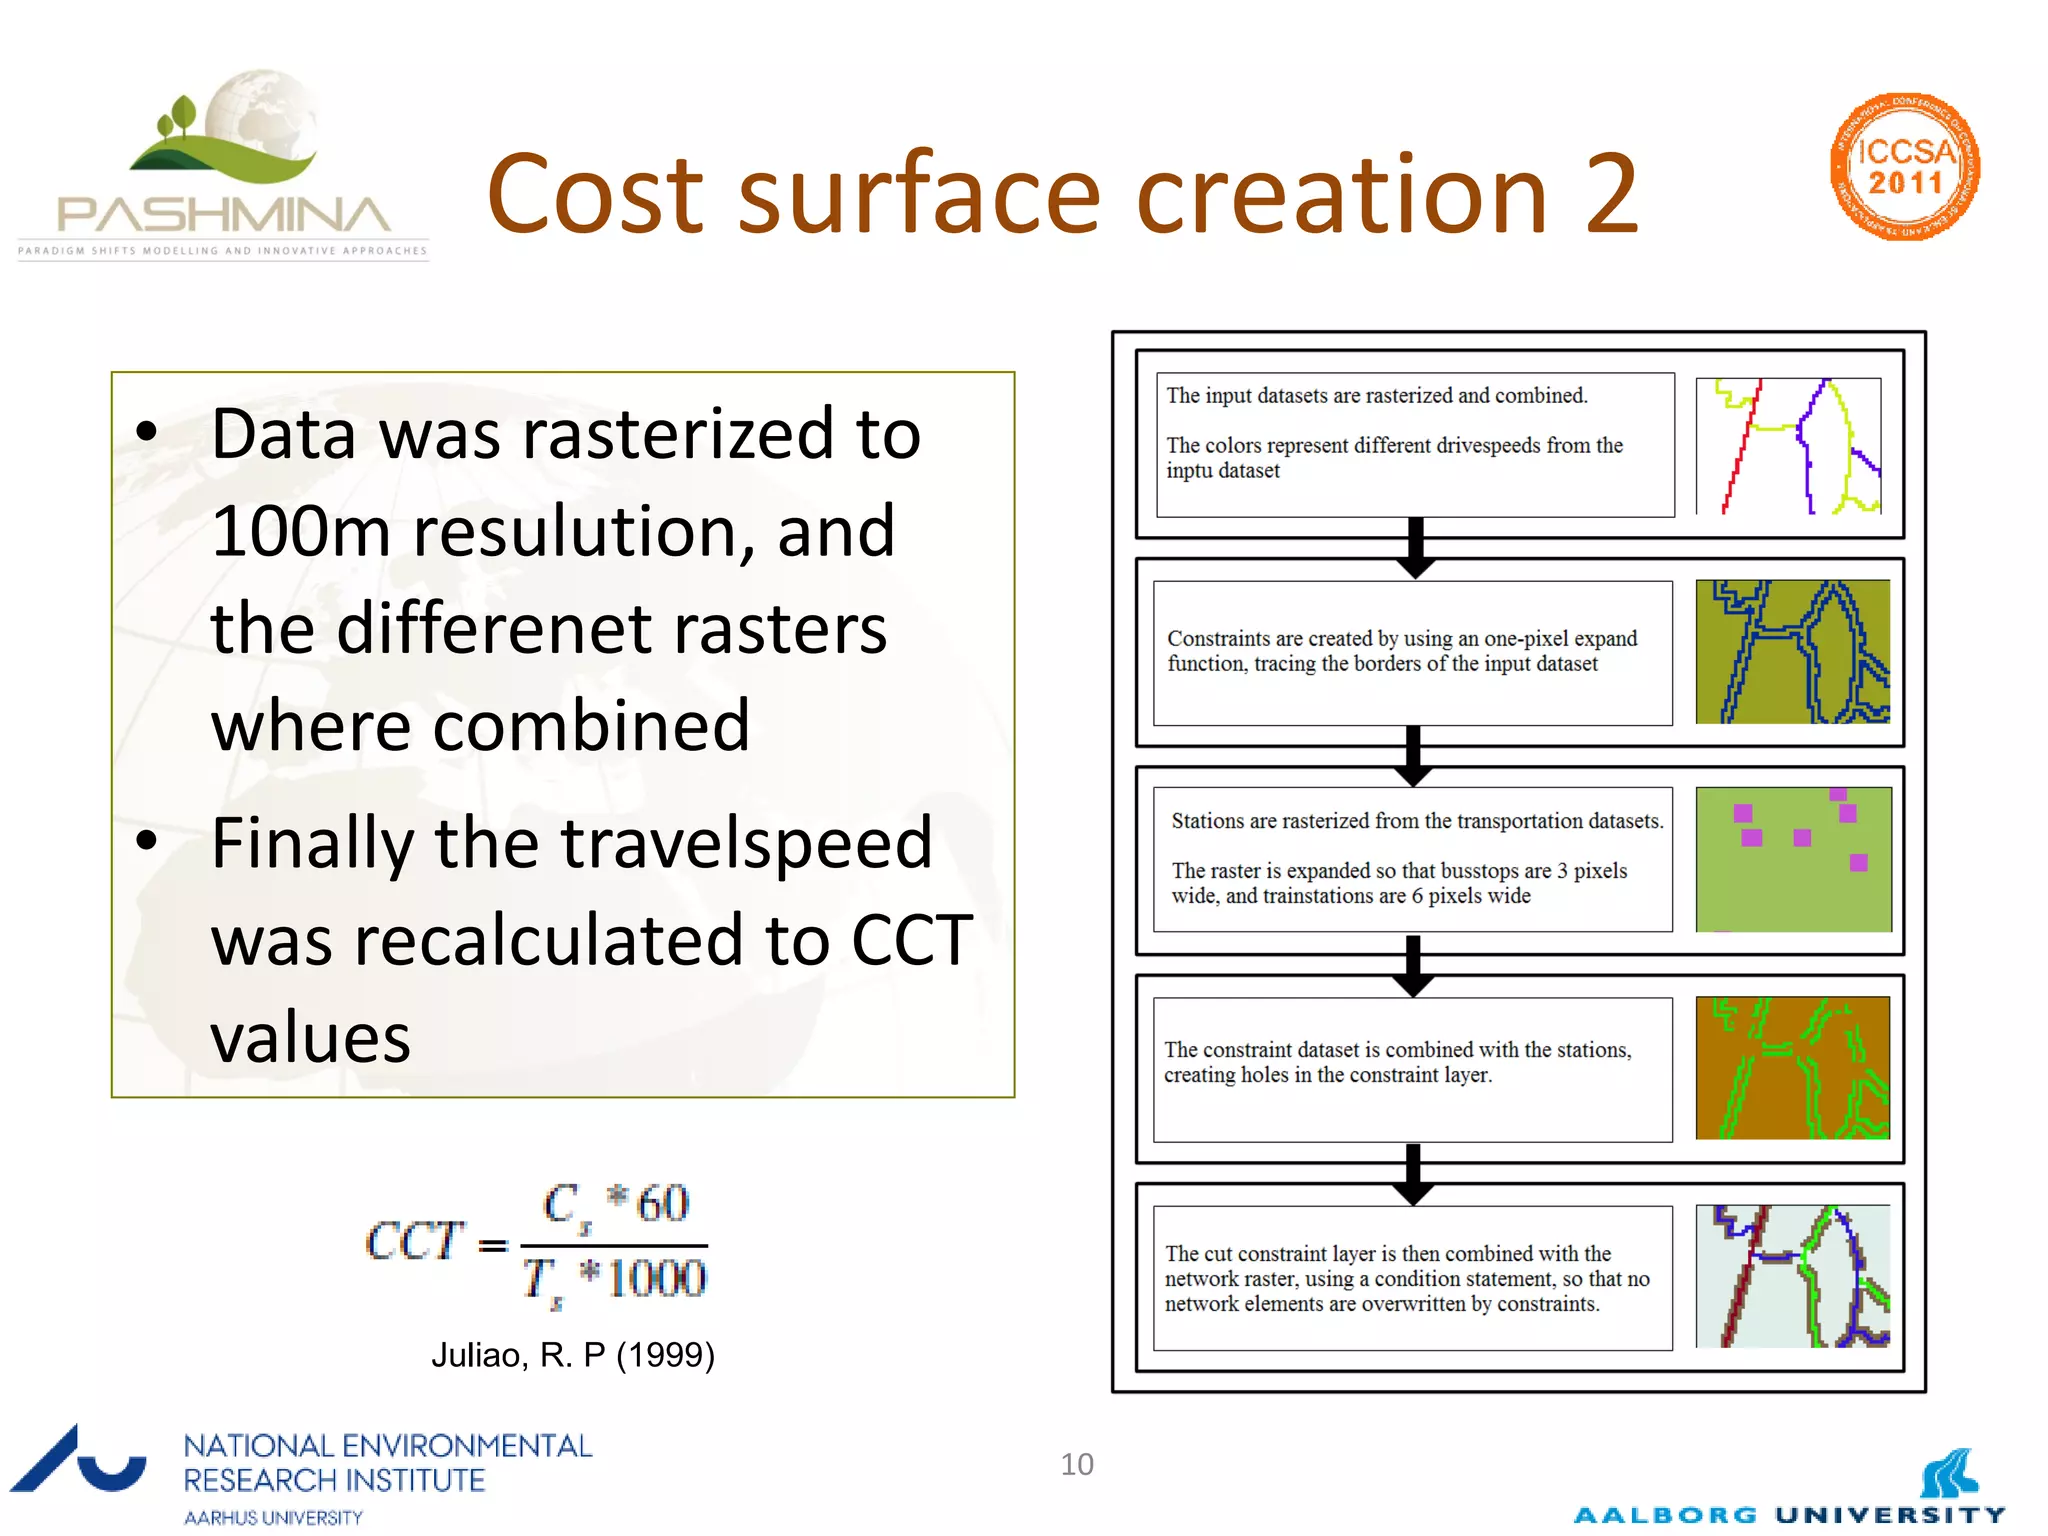
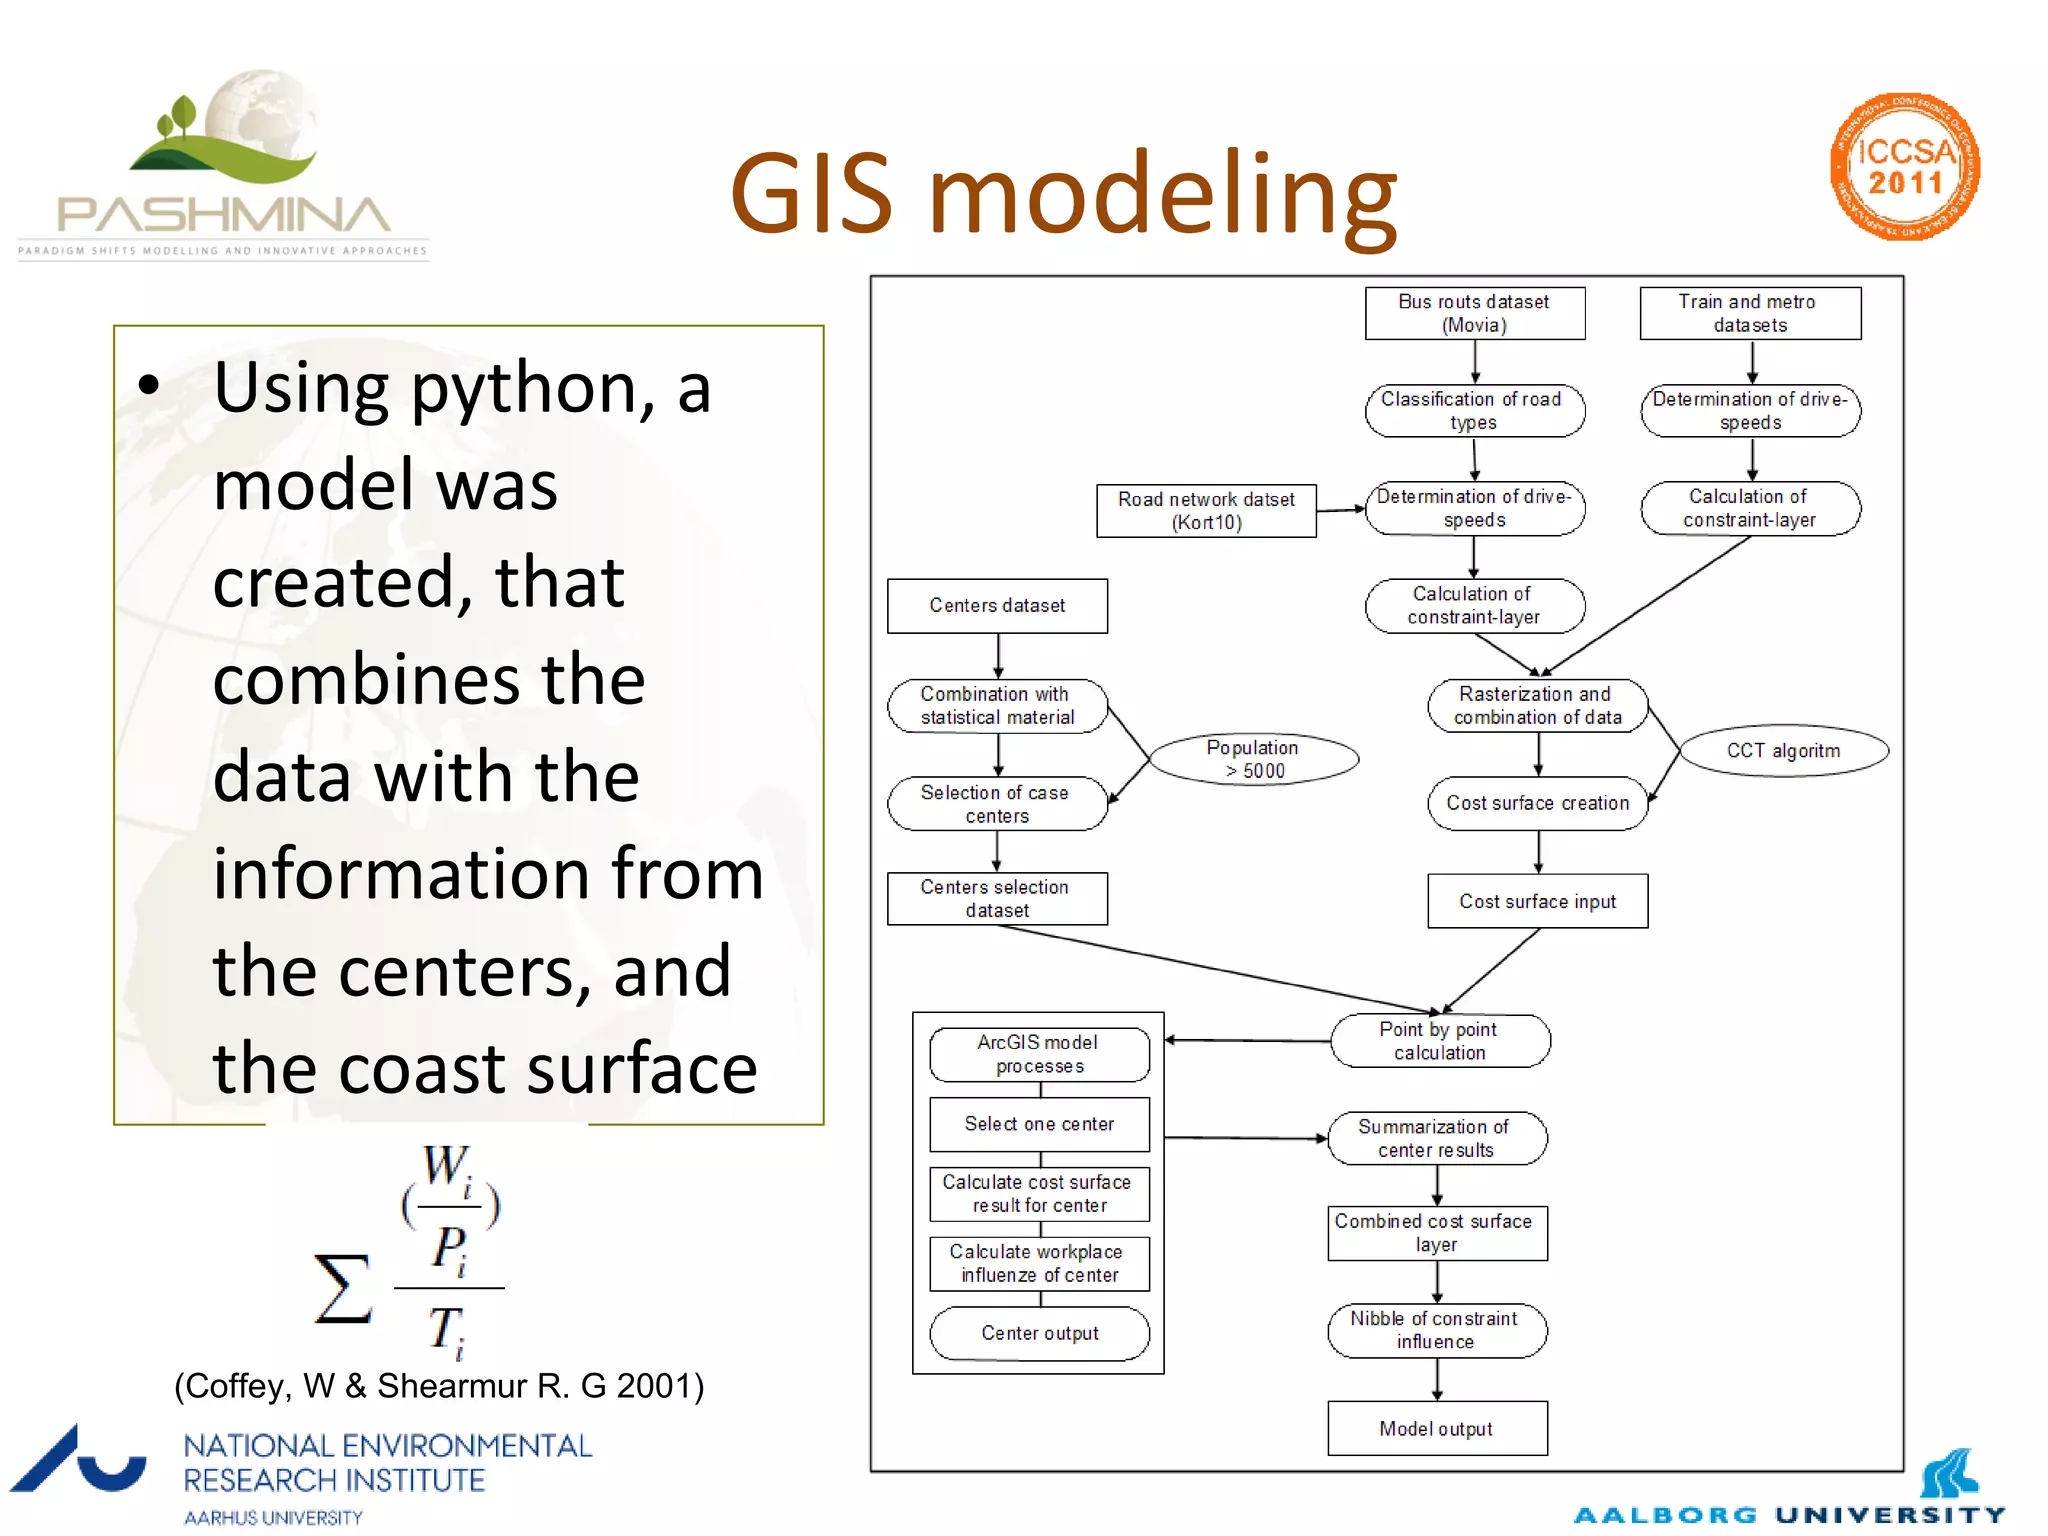
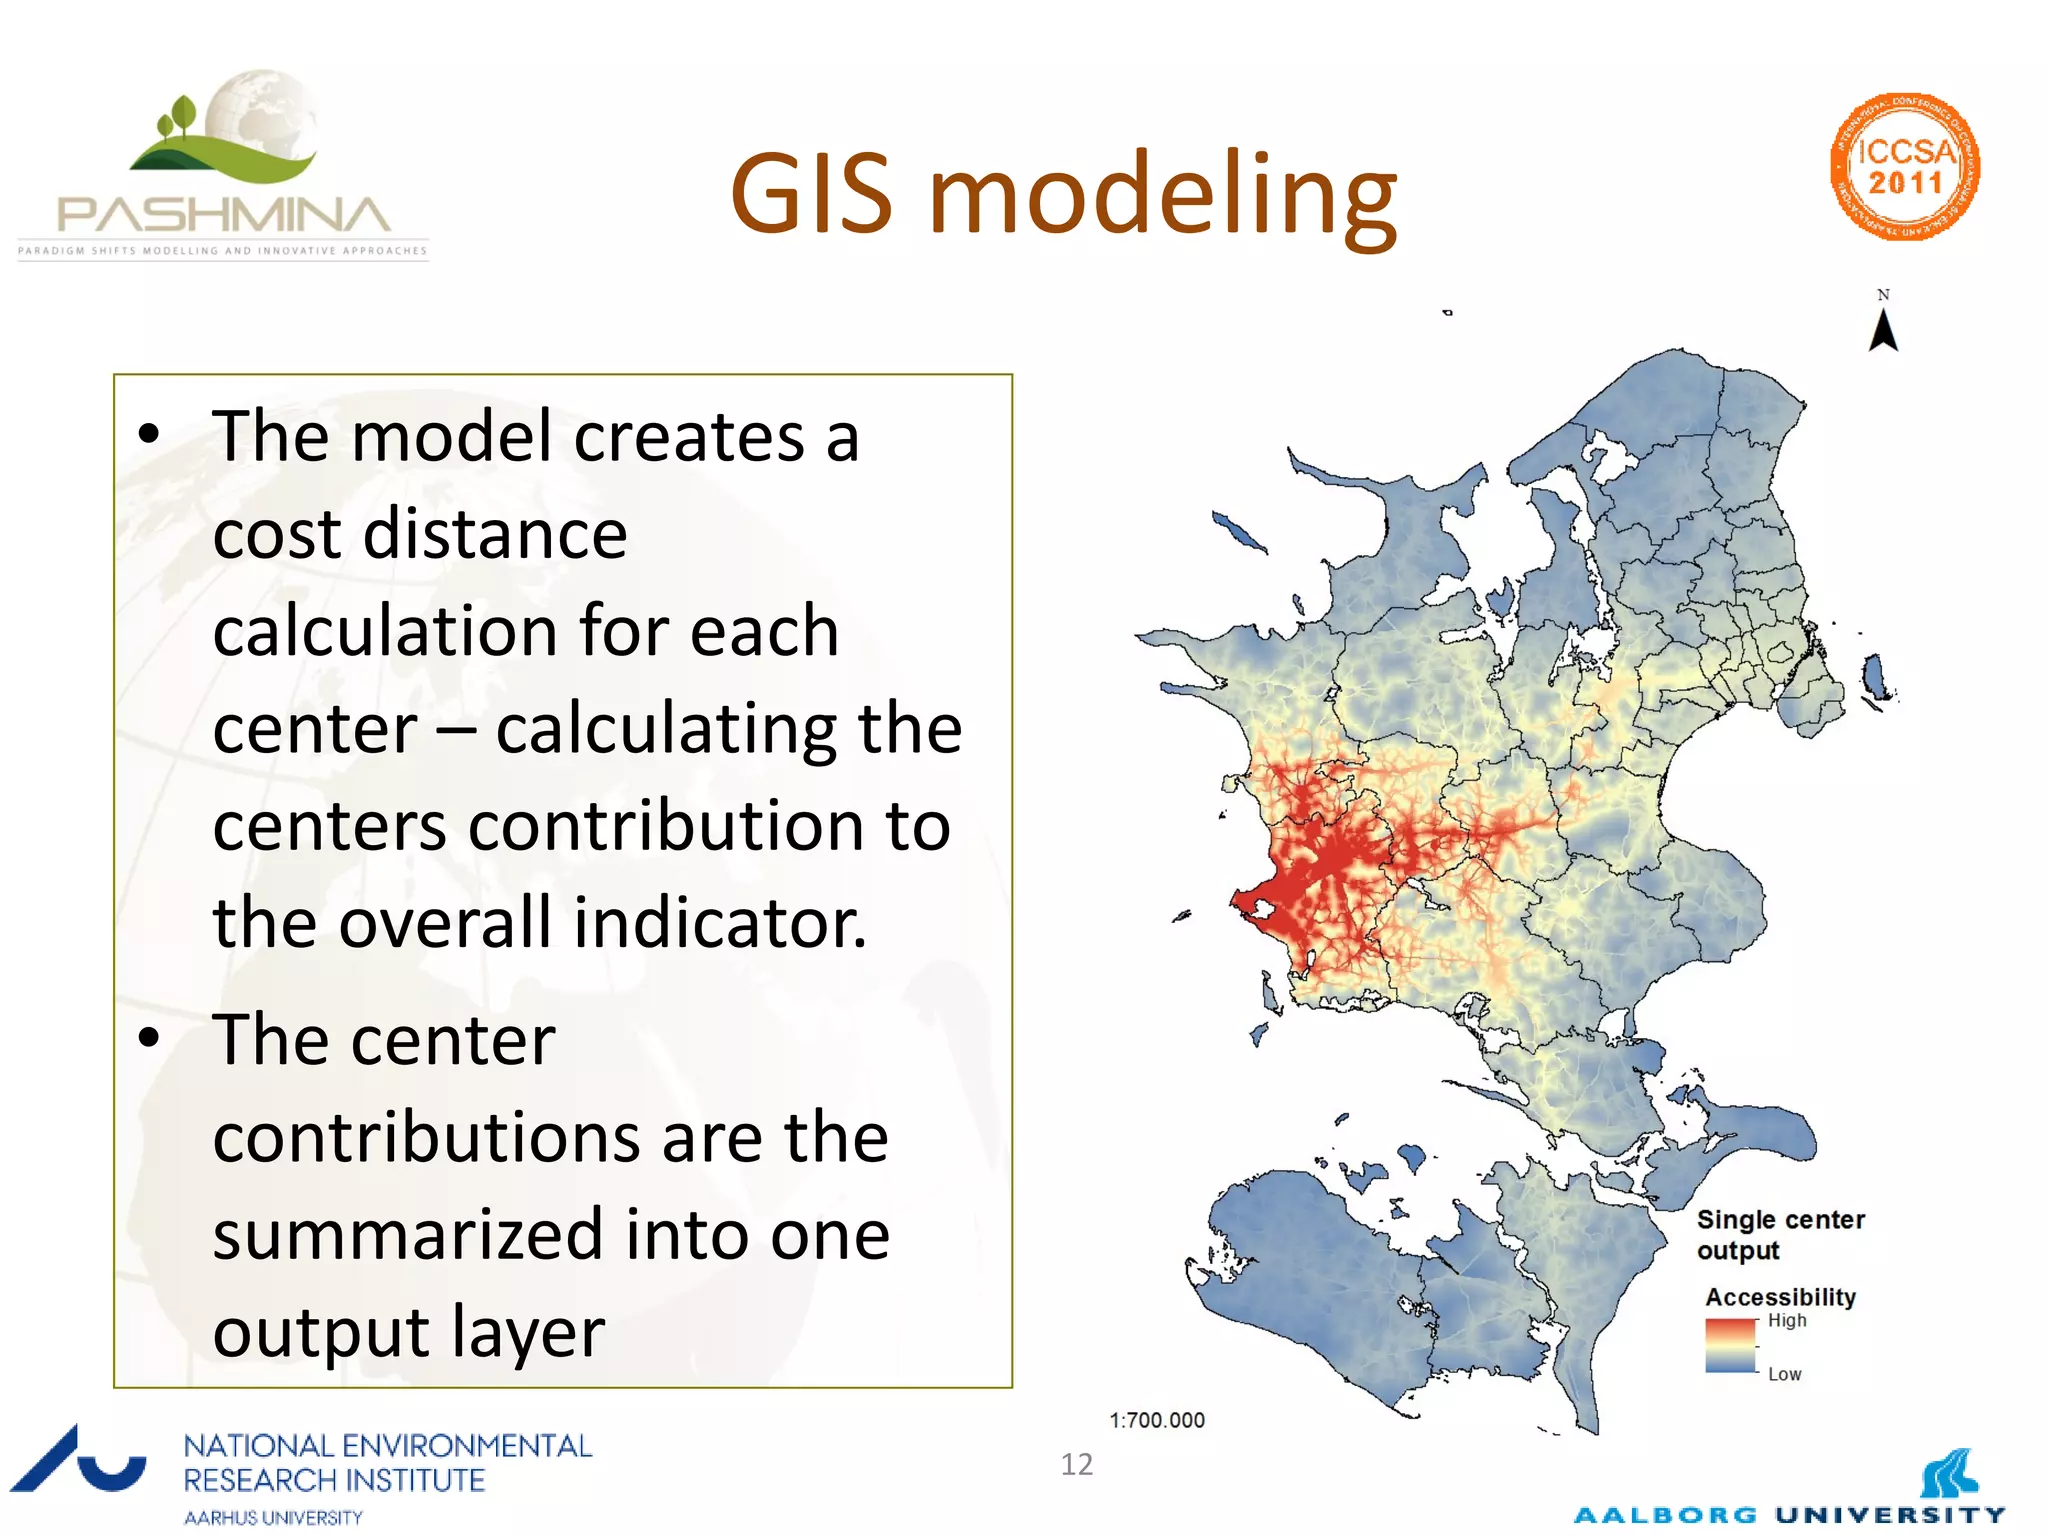
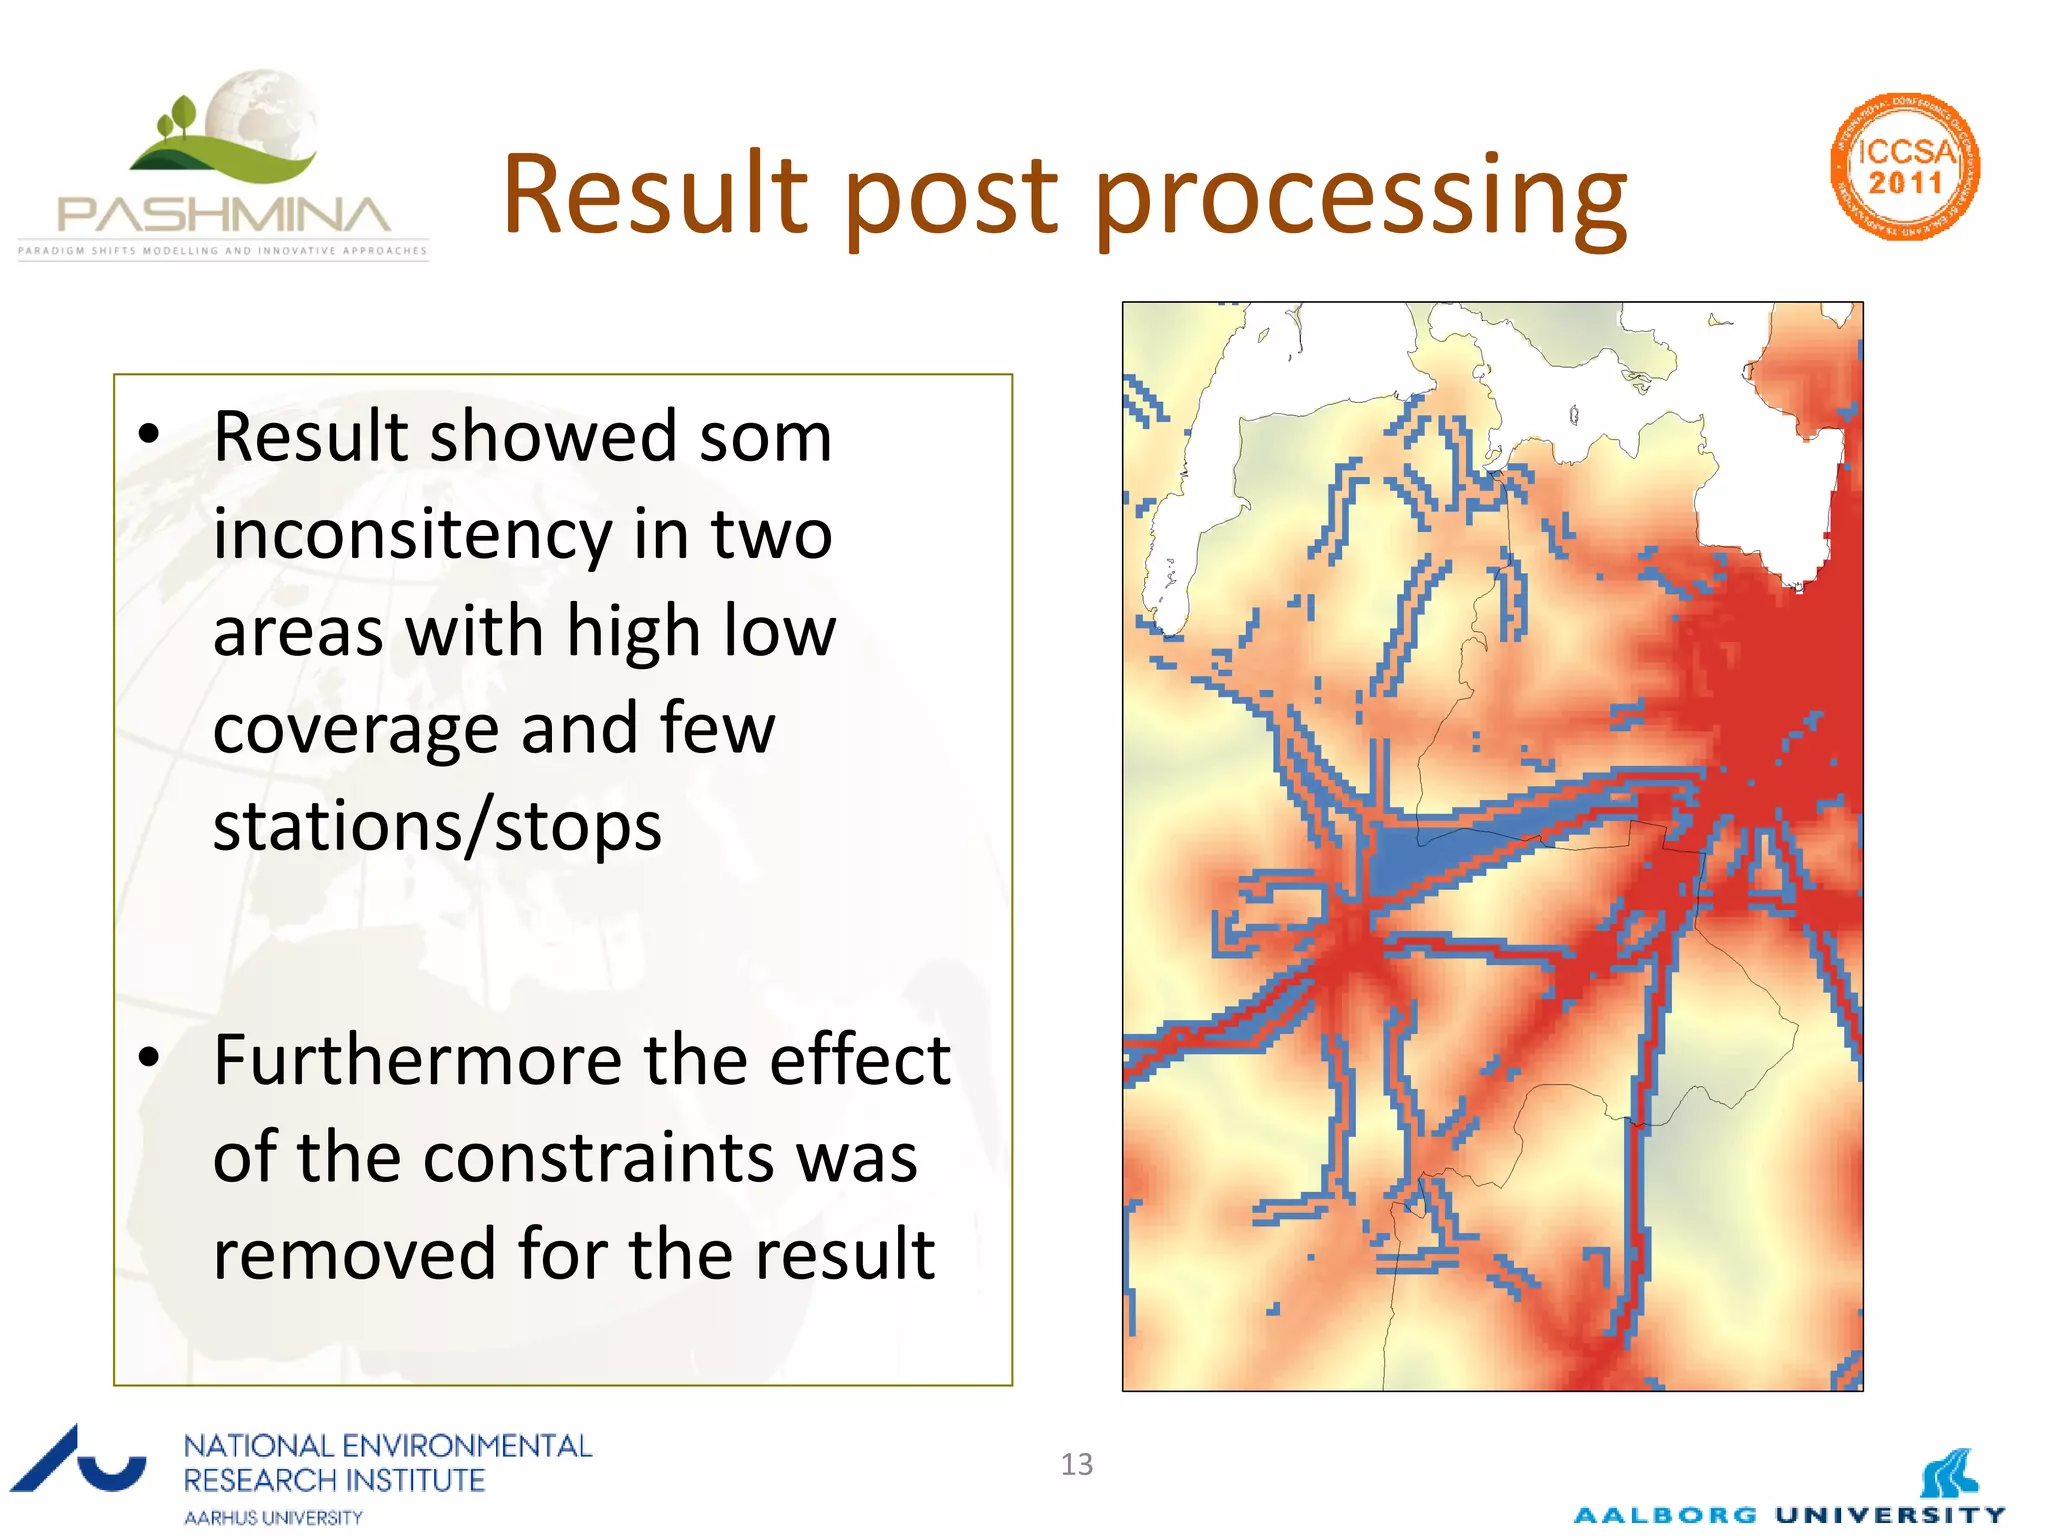
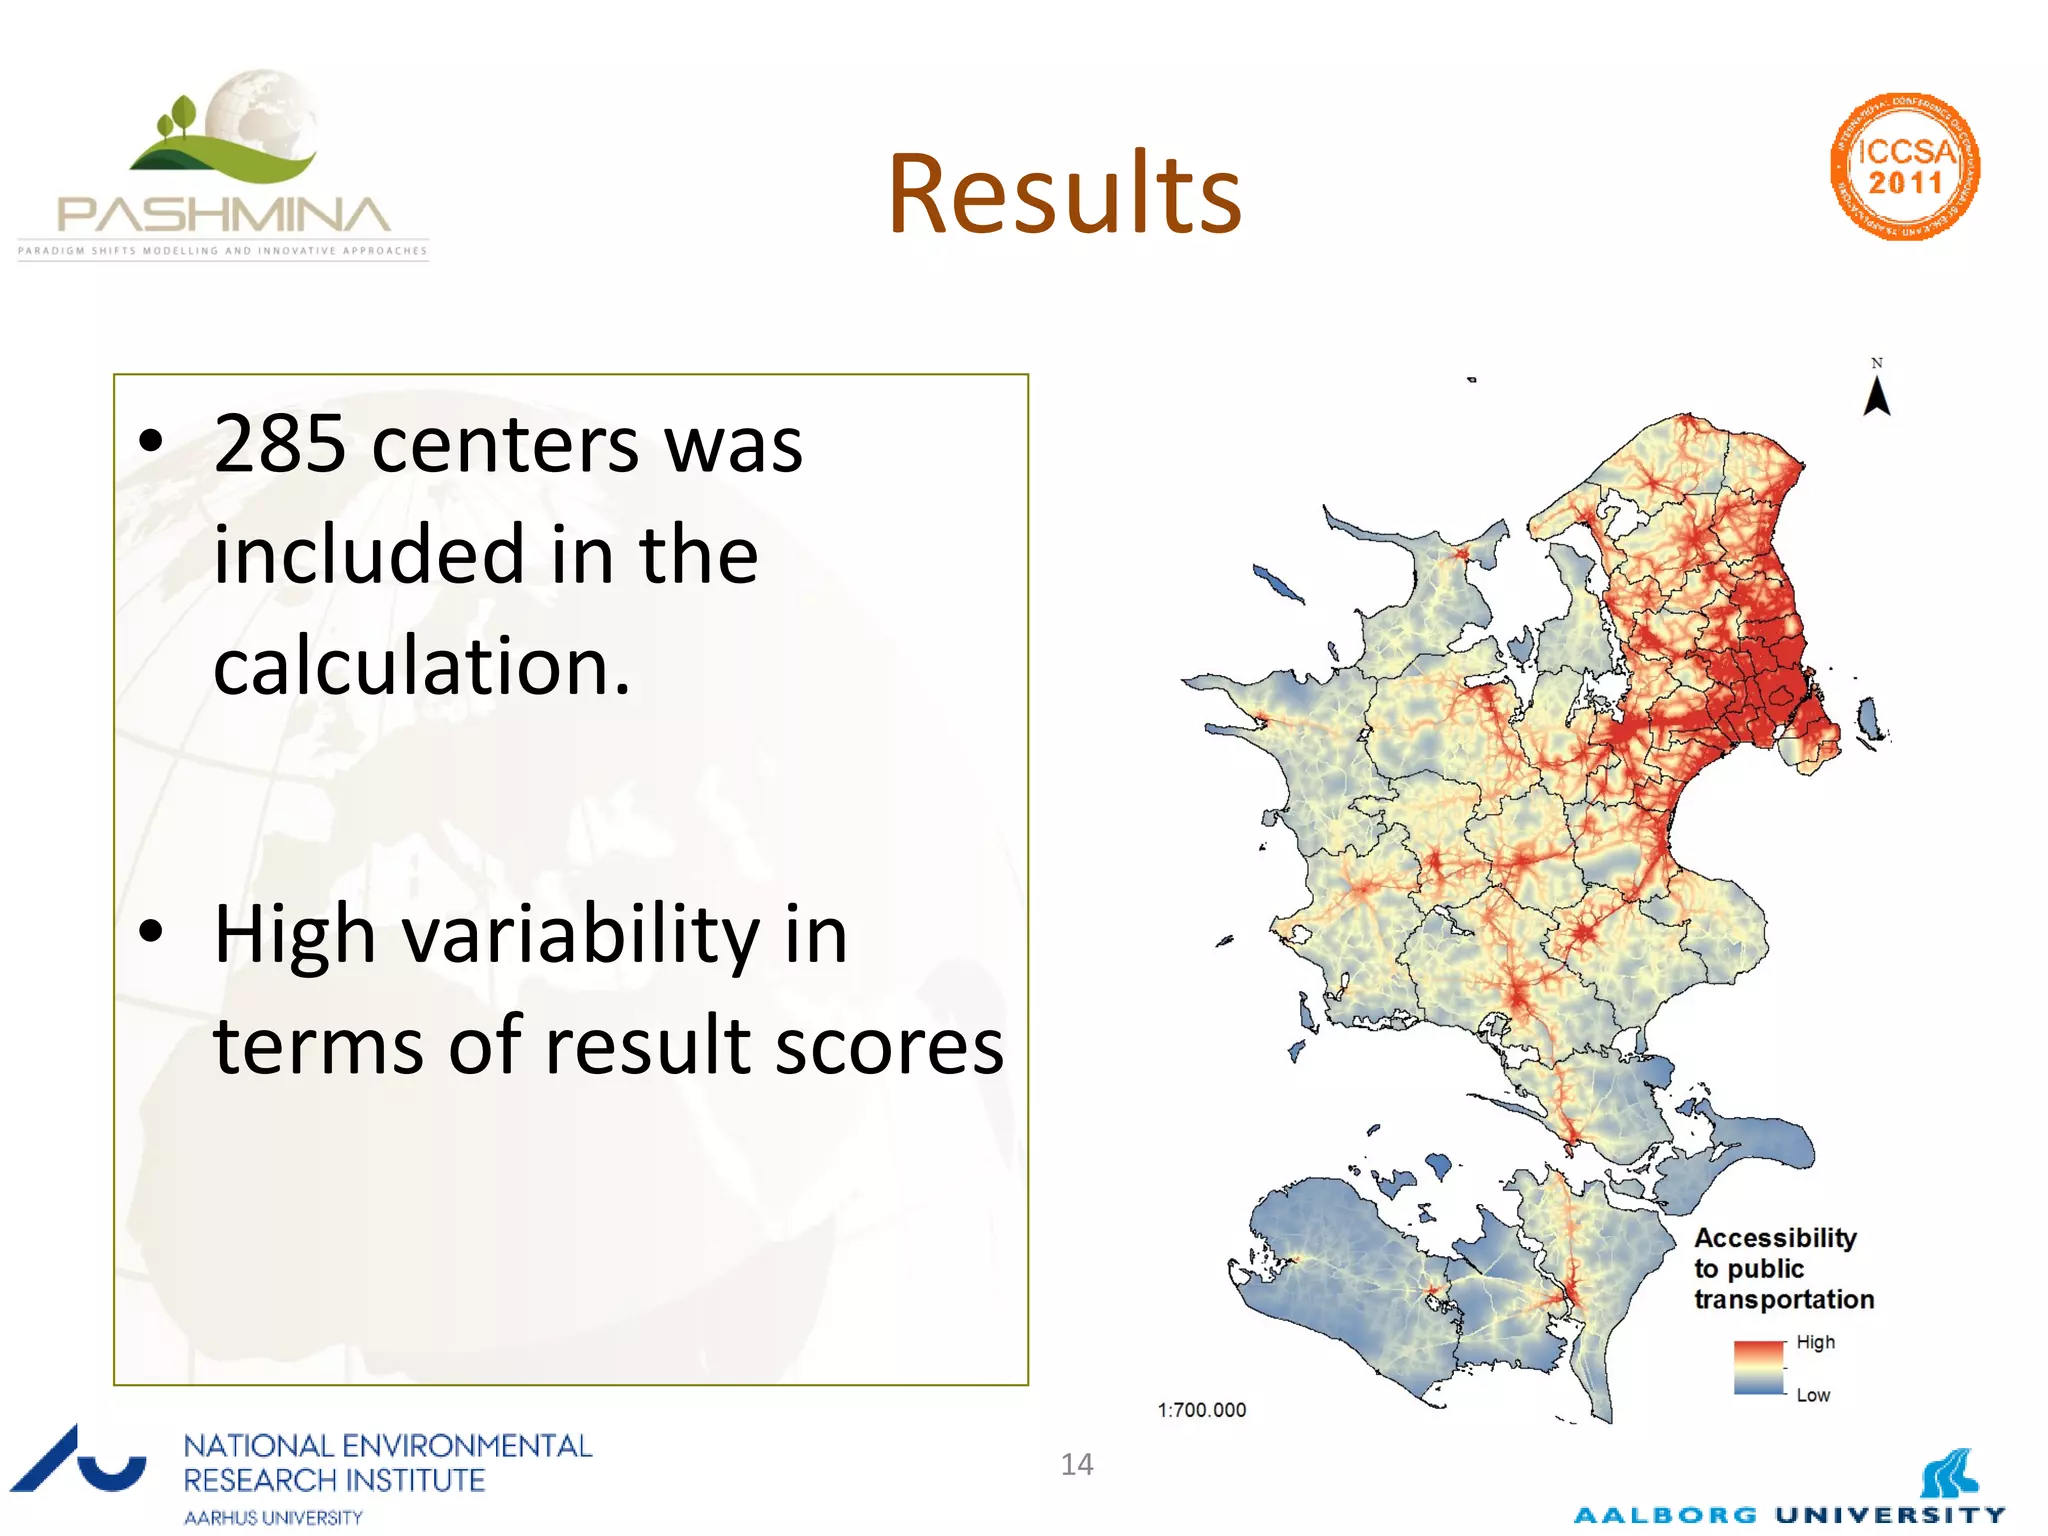
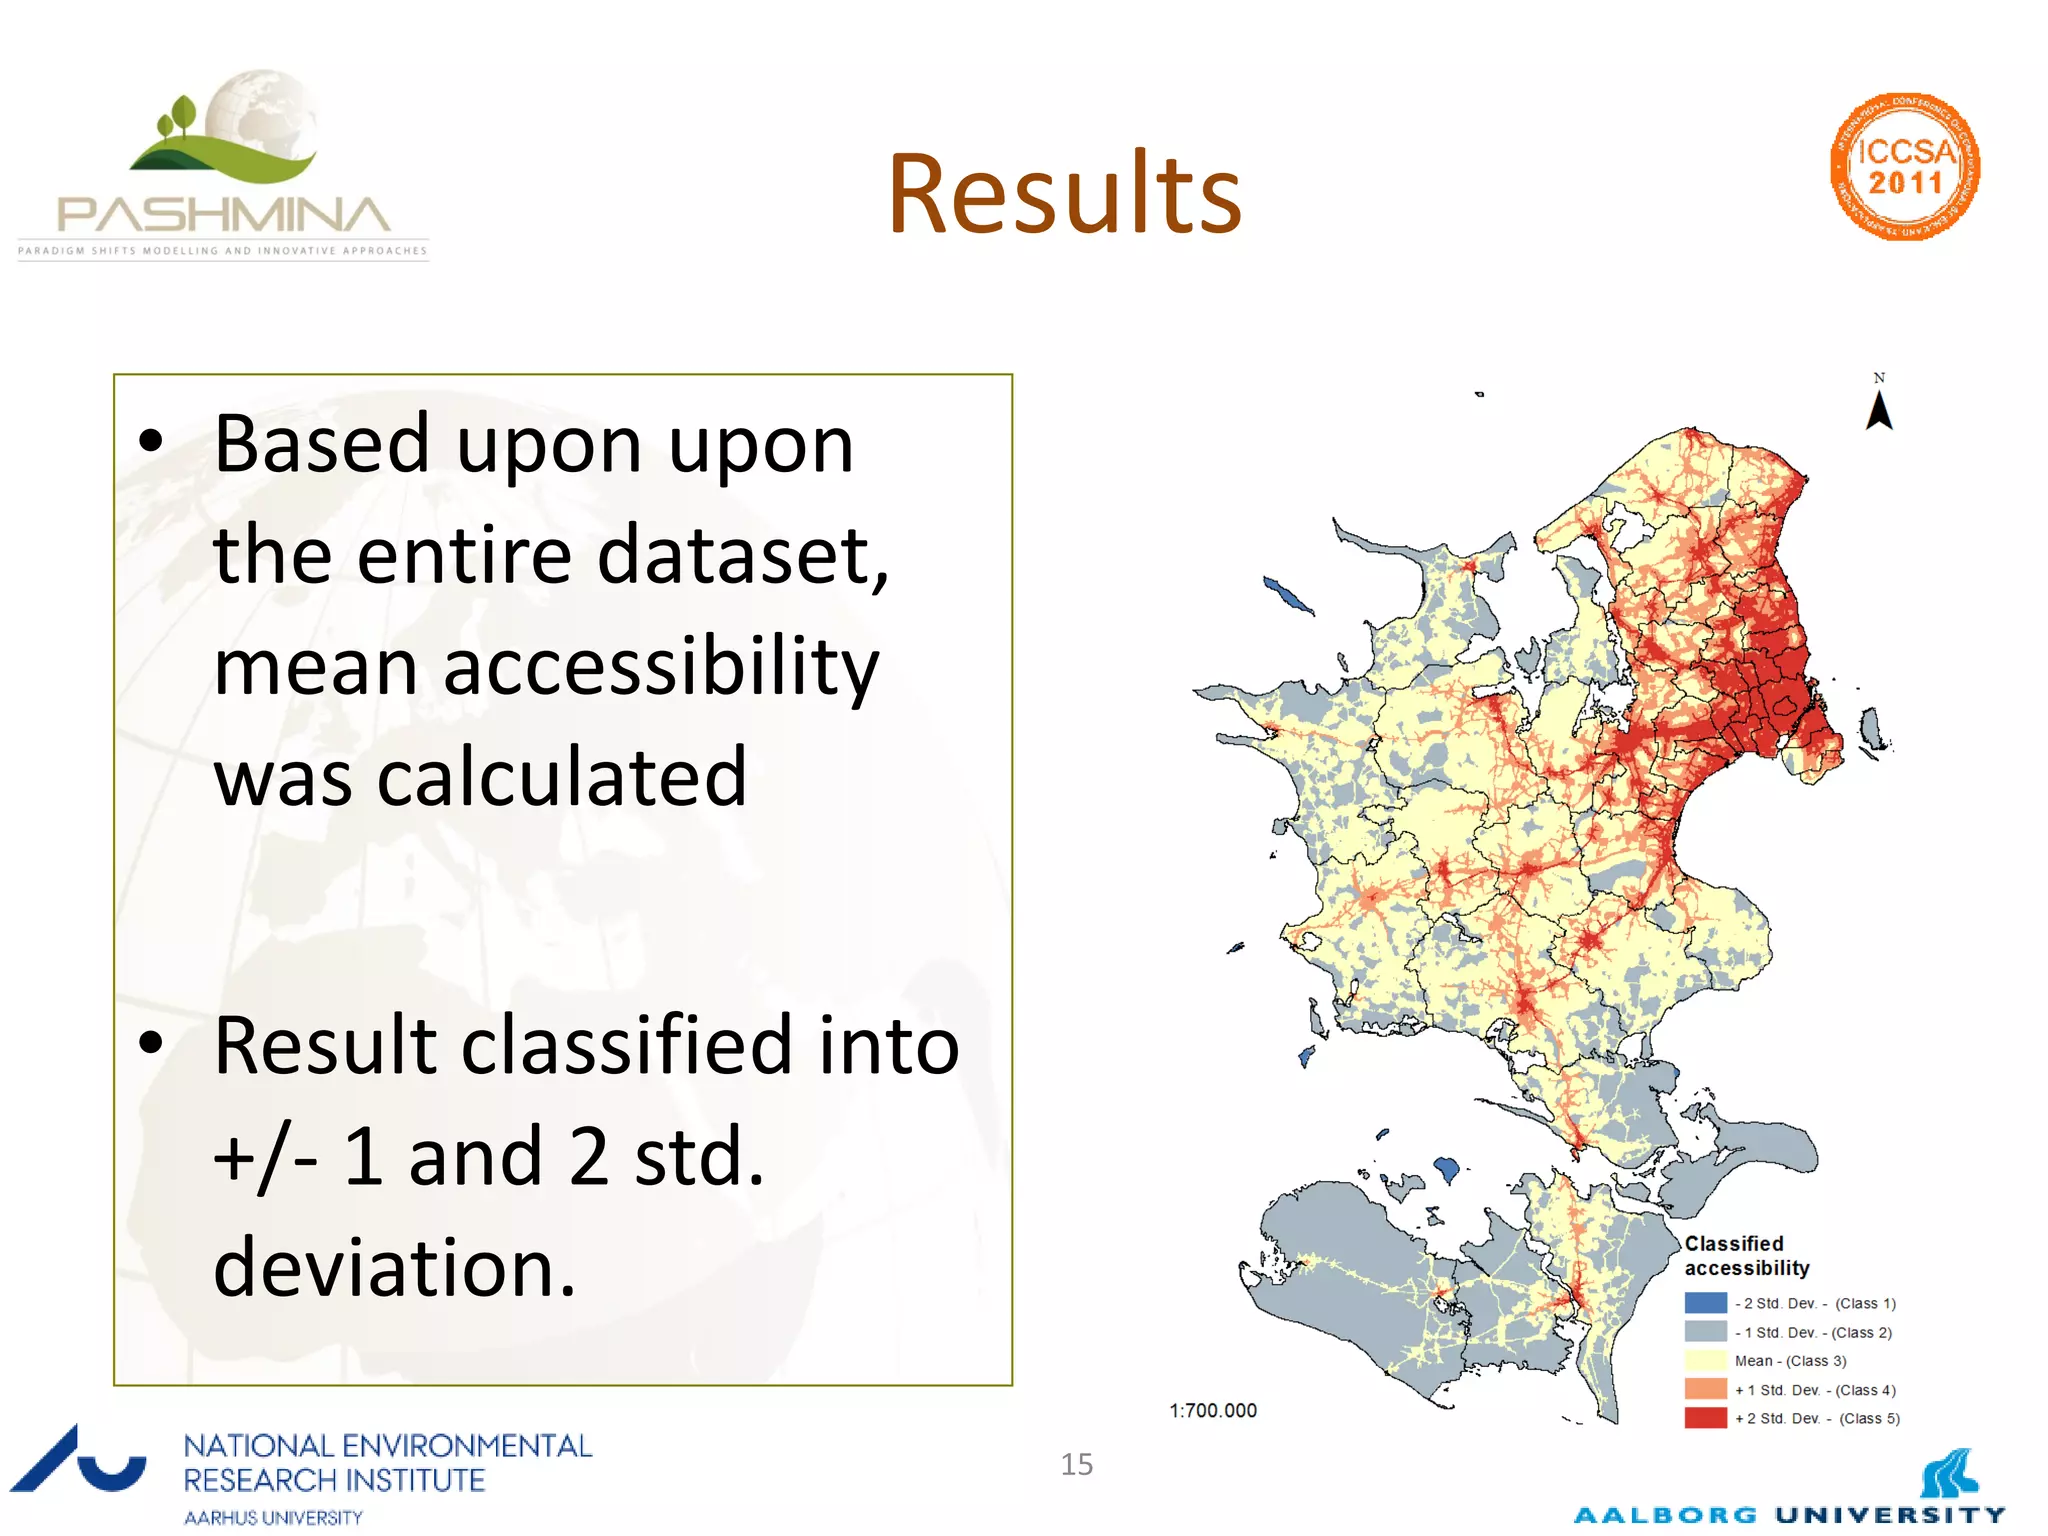
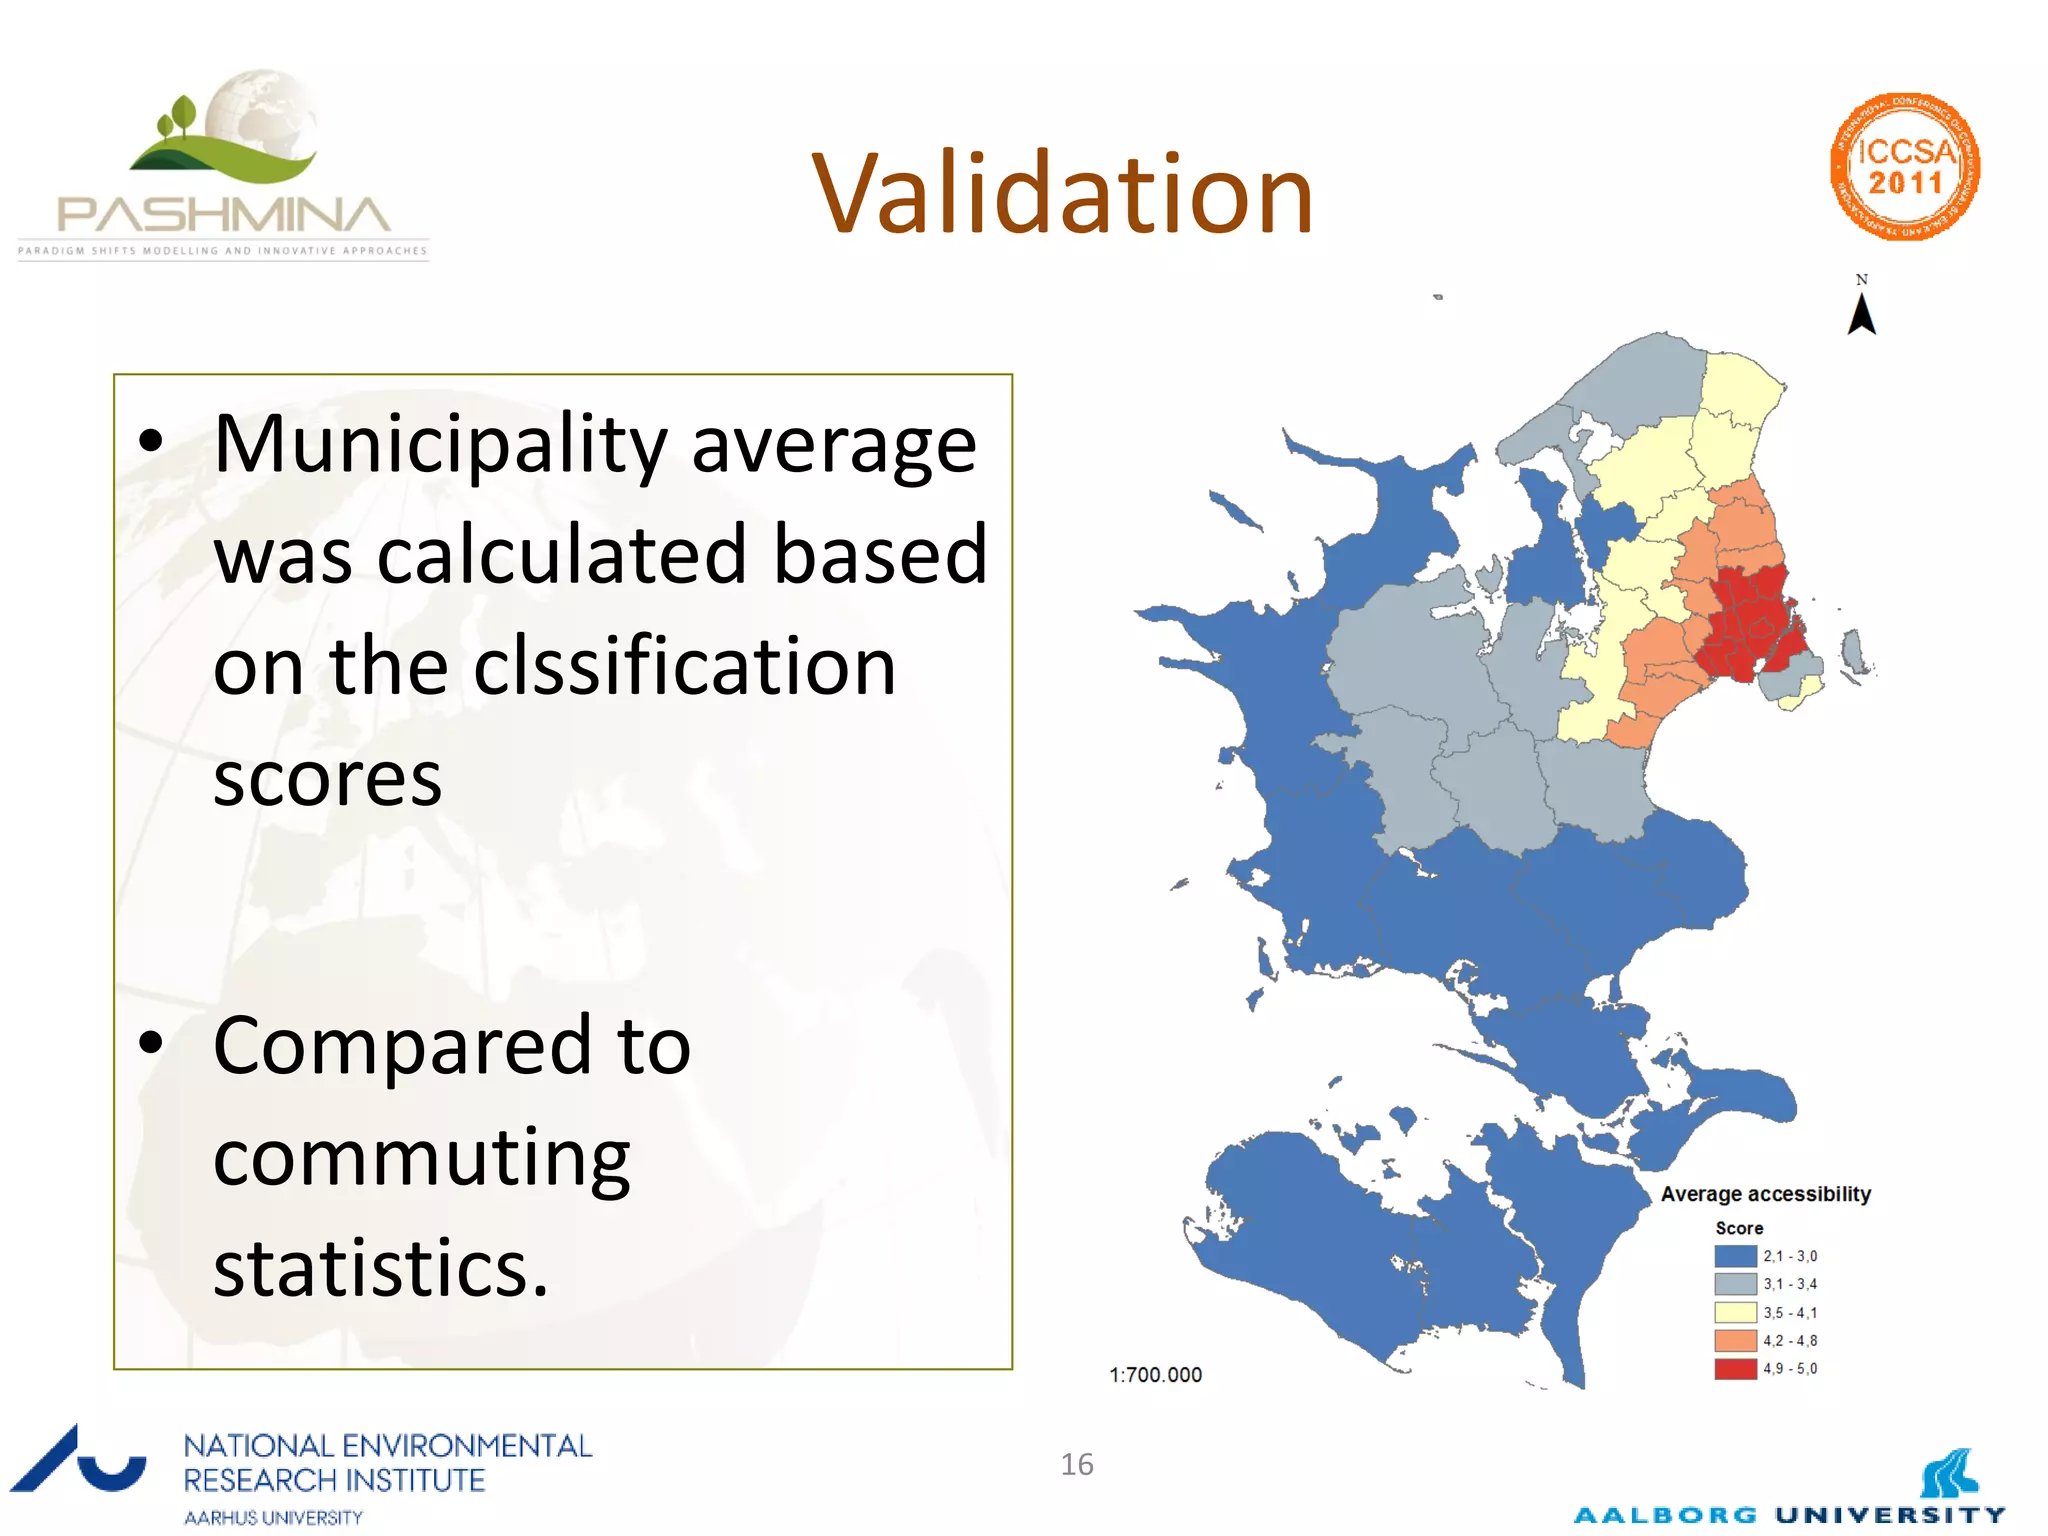
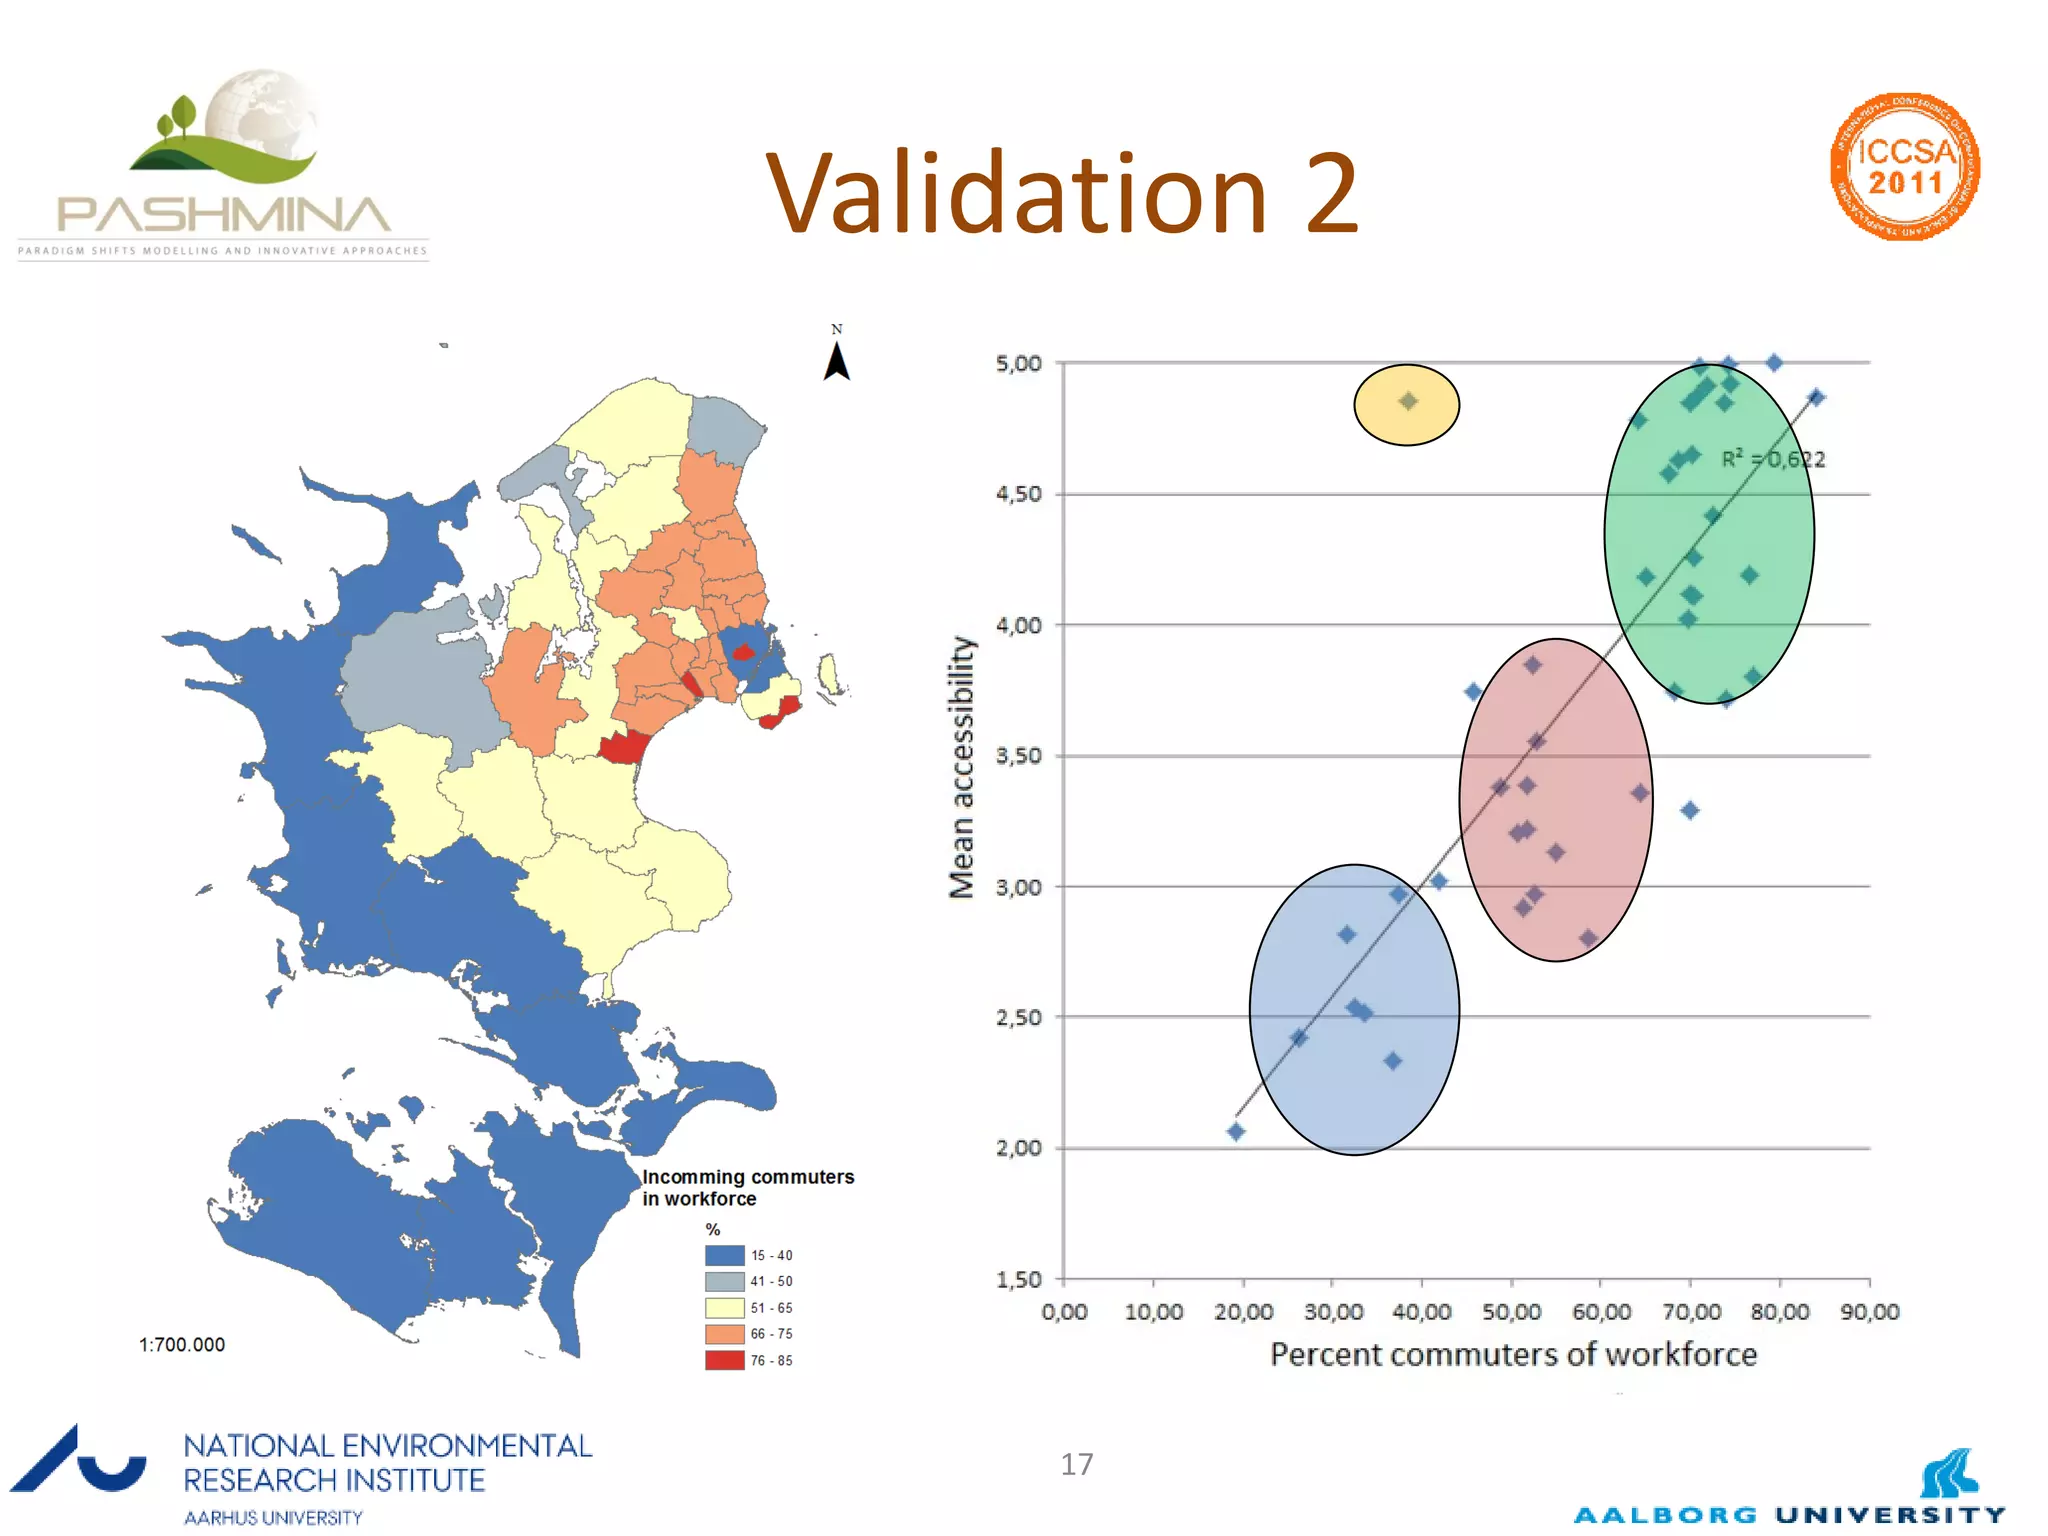
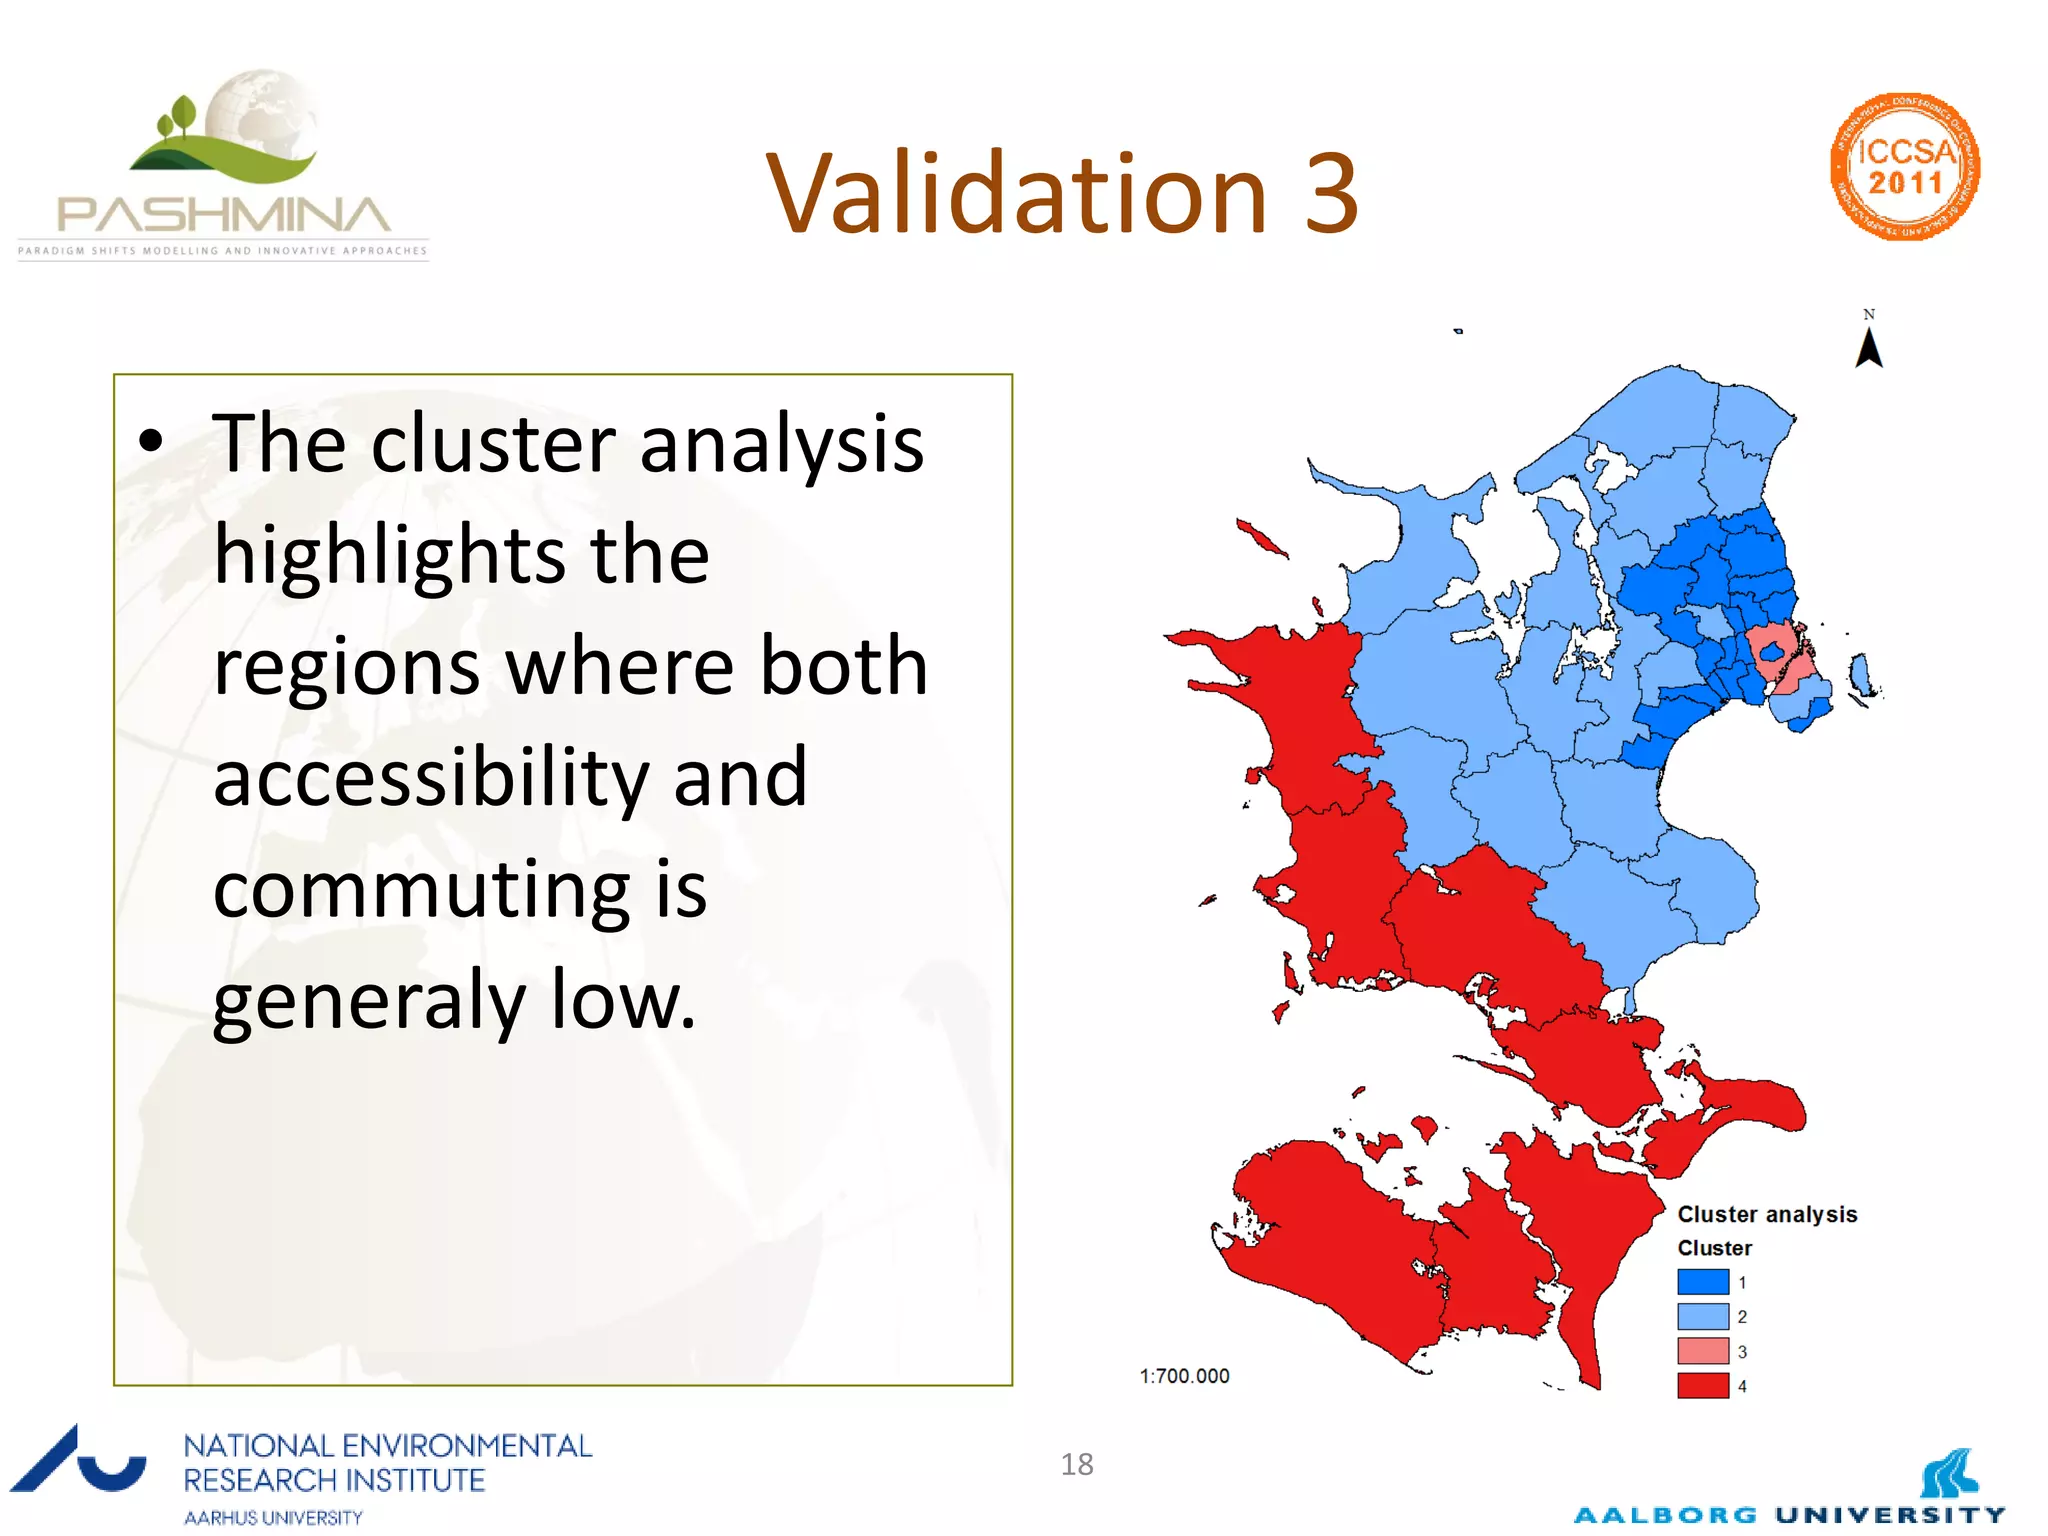
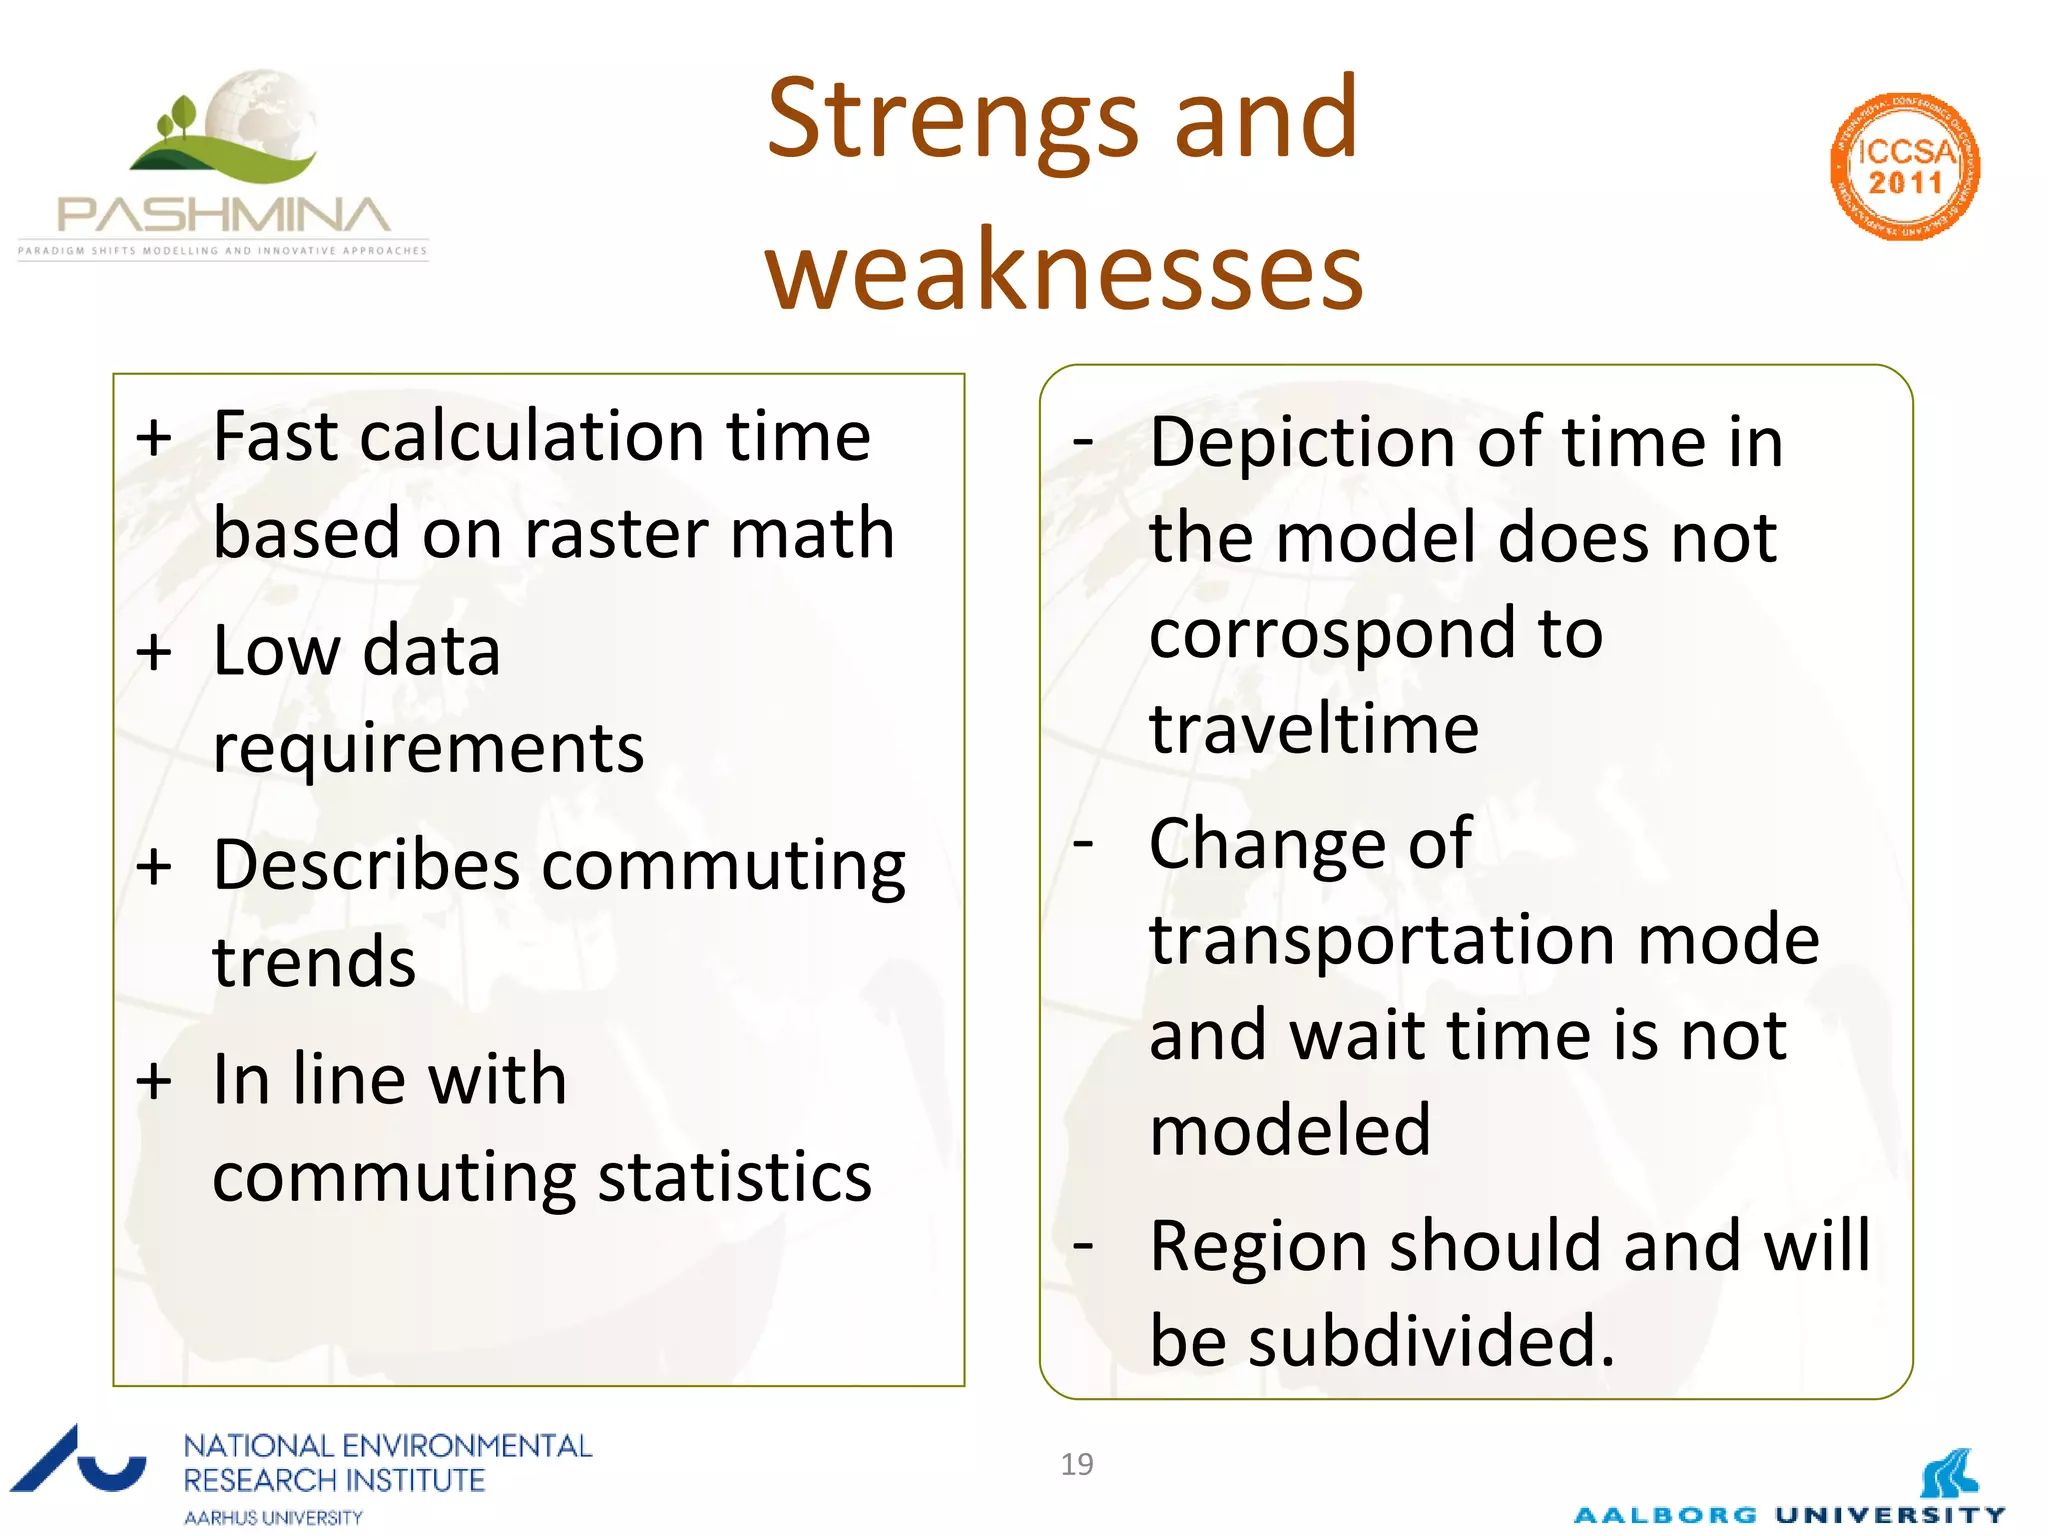
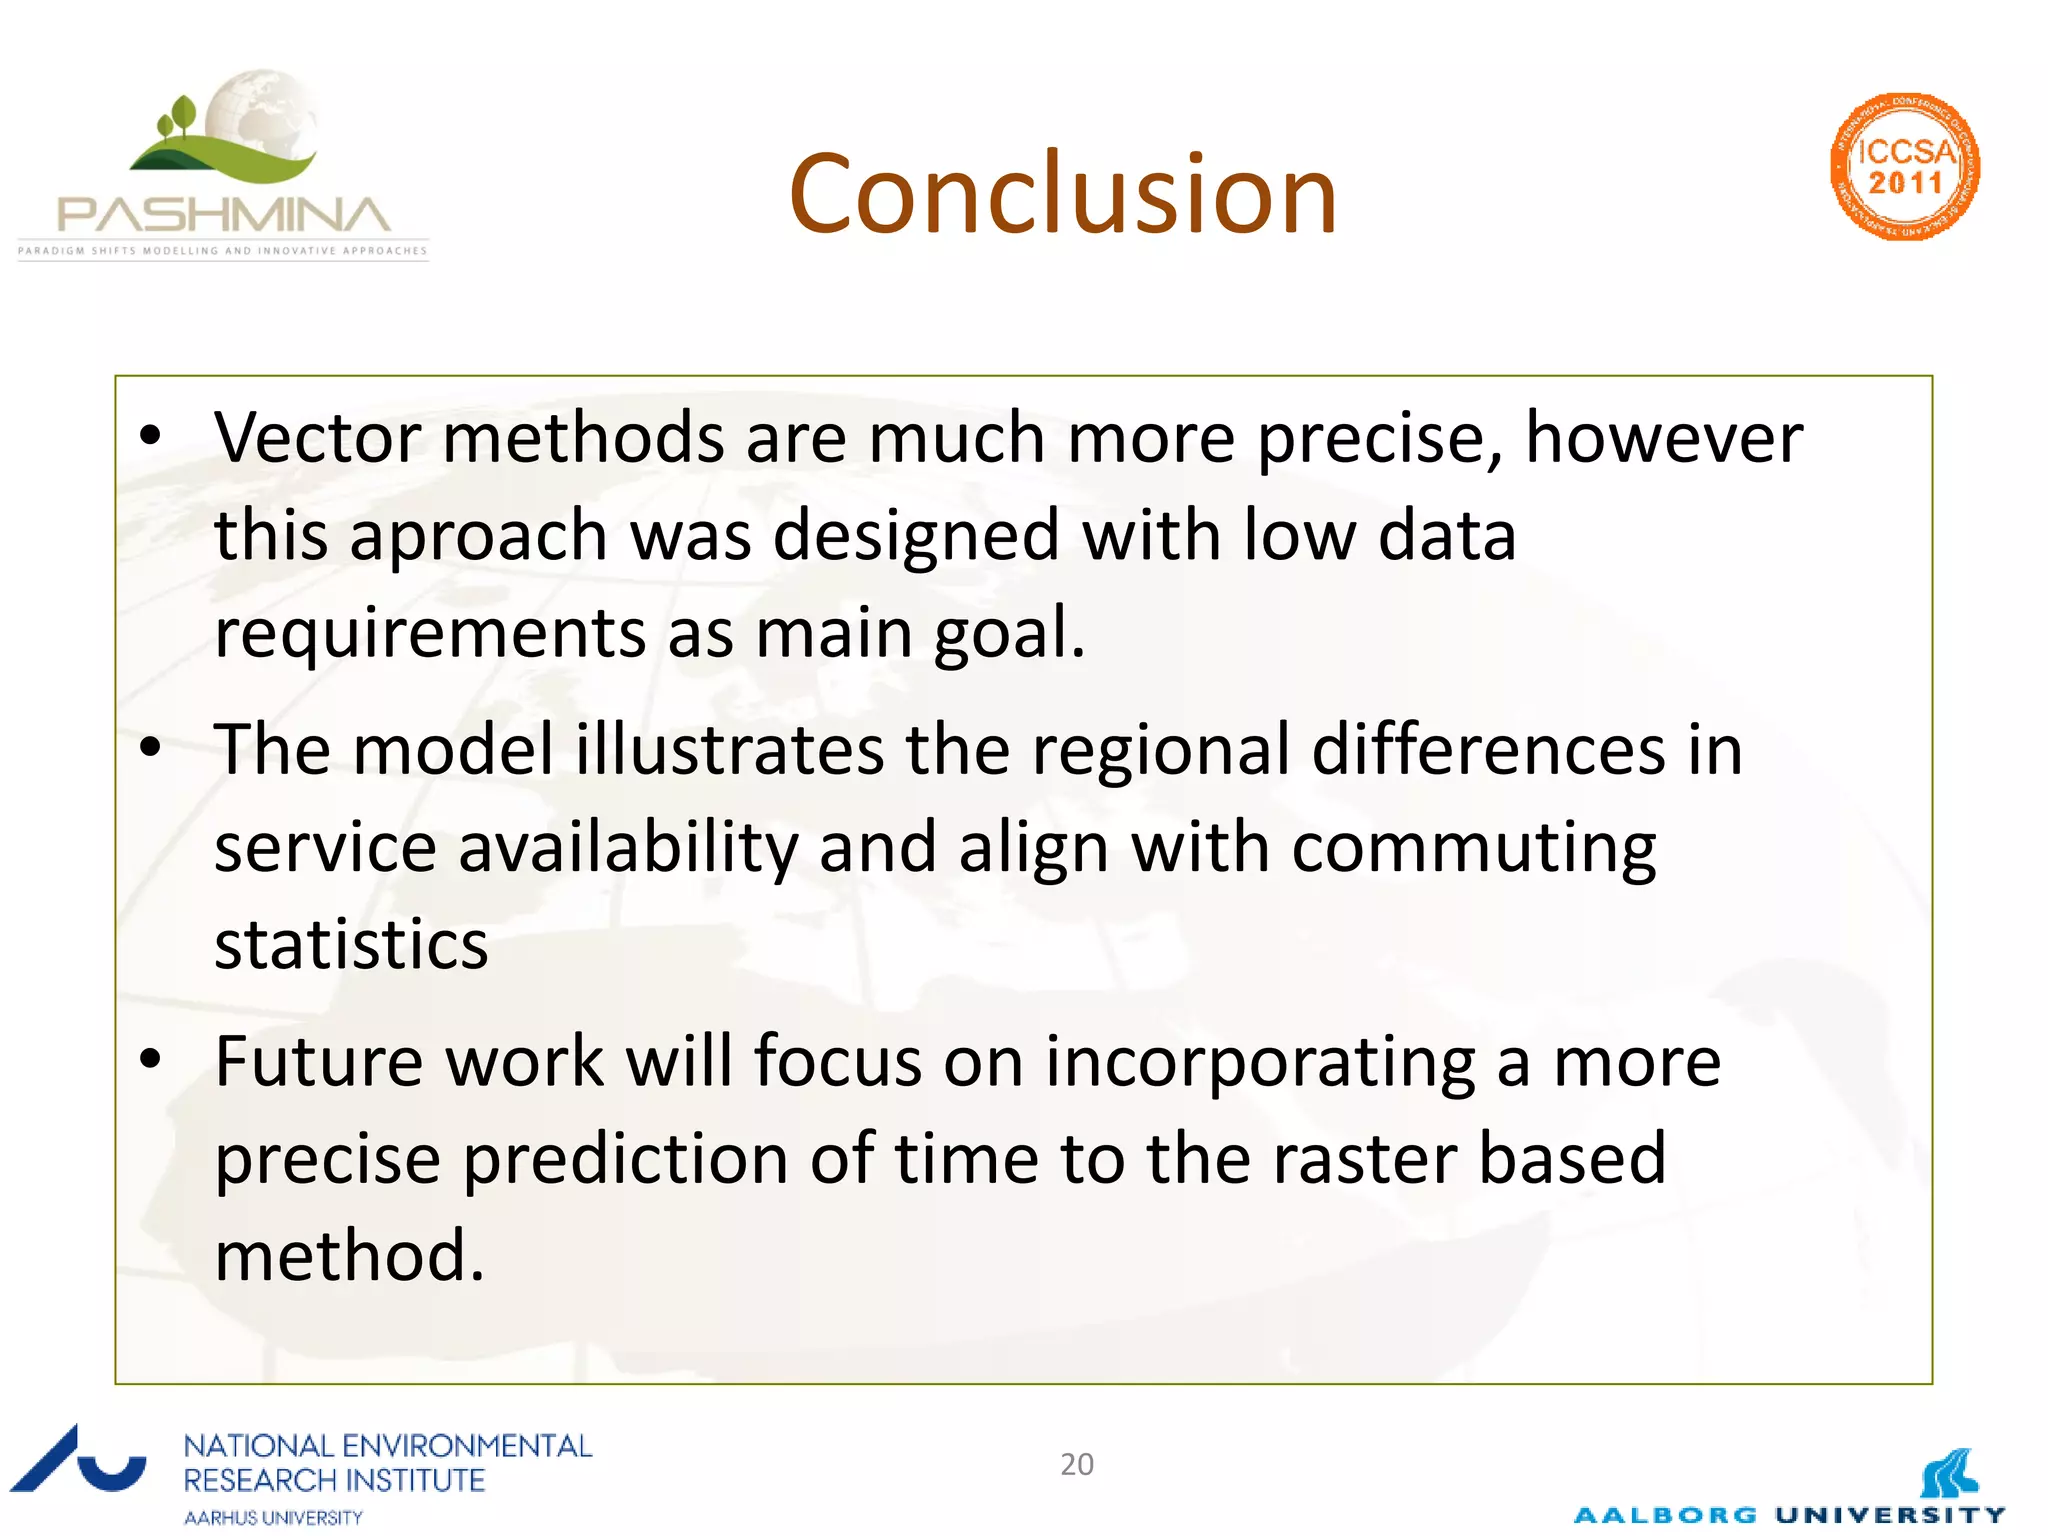
The document summarizes research on modeling accessibility in public transportation networks using a raster-based approach. The research aimed to create an accessibility indicator for jobs via public transit that had low data requirements to allow transfer to other regions. The study area was the capital region of Denmark. Accessibility was modeled using land use, transportation, and temporal components. The model calculated cost distances from population and job centers using rasterized transportation network data. Results showed variability in accessibility scores and generally aligned with commuting statistics. The raster approach allowed fast calculation with low data needs but did not fully account for travel time or mode changes.


