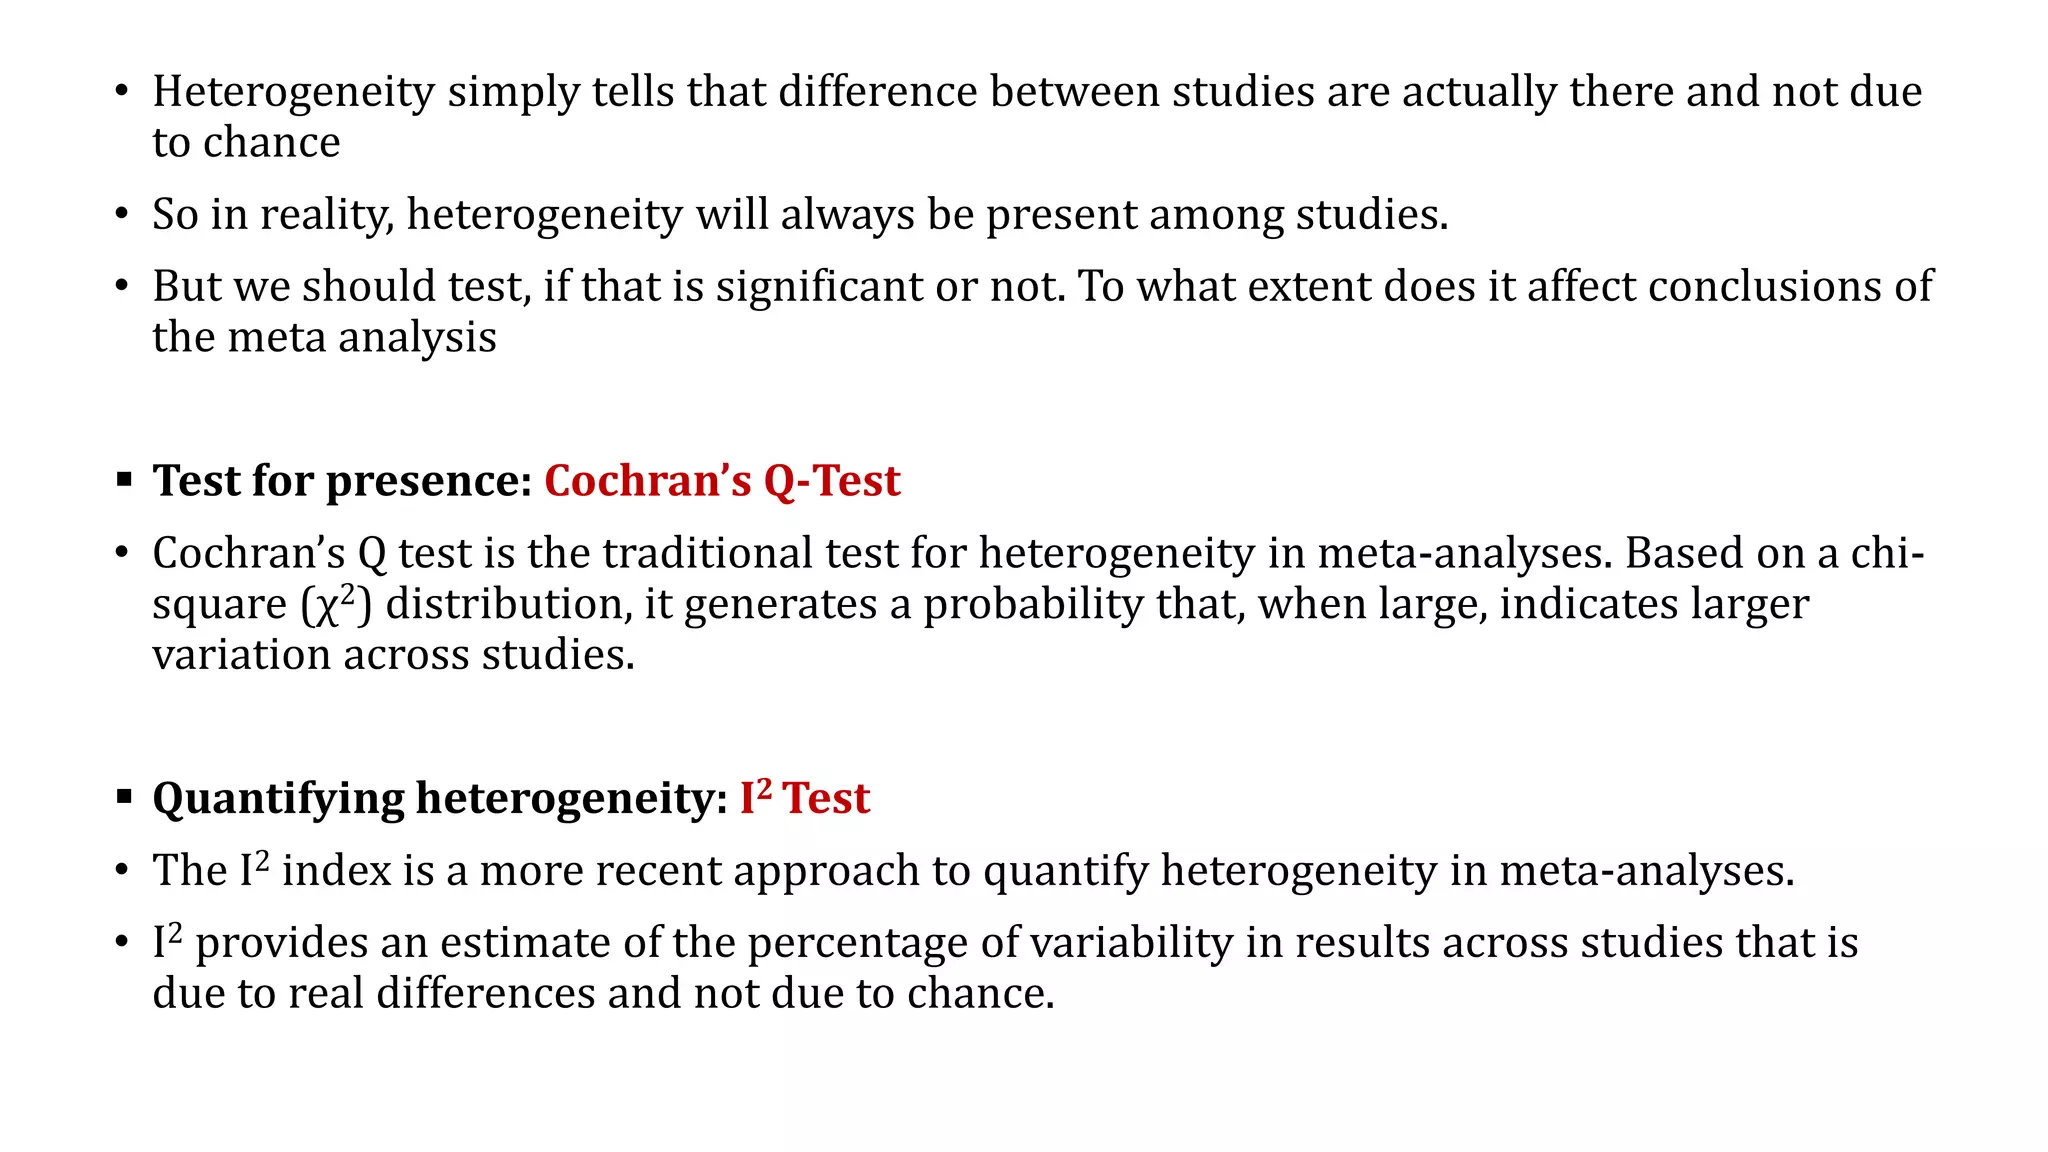
Downloaded 57 times


![4. Search strategy & 5. Searching databases:
• PubMed, EMBASE, Google Scholar, Scopus, Cochrane etc. According to AMSTAR guidelines, at
least two databases have to be searched.
• Boolean operators, such as “AND”, “OR”, “NOT” are used for refining search strategy.
6. Protocol writing & registration:
• Protocol registration at an early stage guarantees transparency in the research process and
protects from duplication problems.
• Besides, it is considered a documented proof of team plan of action, research question,
eligibility criteria, intervention/exposure, quality assessment, and pre-analysis plan.
• Researchers should send it to the principal investigator (PI) to revise it, then upload it to
registry sites [Proposed by Cochrane and Campbell collaborations; PROSPERO etc.]](https://image.slidesharecdn.com/systematicreviewmetaanalysis-221104030111-8ac88acb/75/Systematic-Review-Meta-Analysis-pptx-13-2048.jpg)


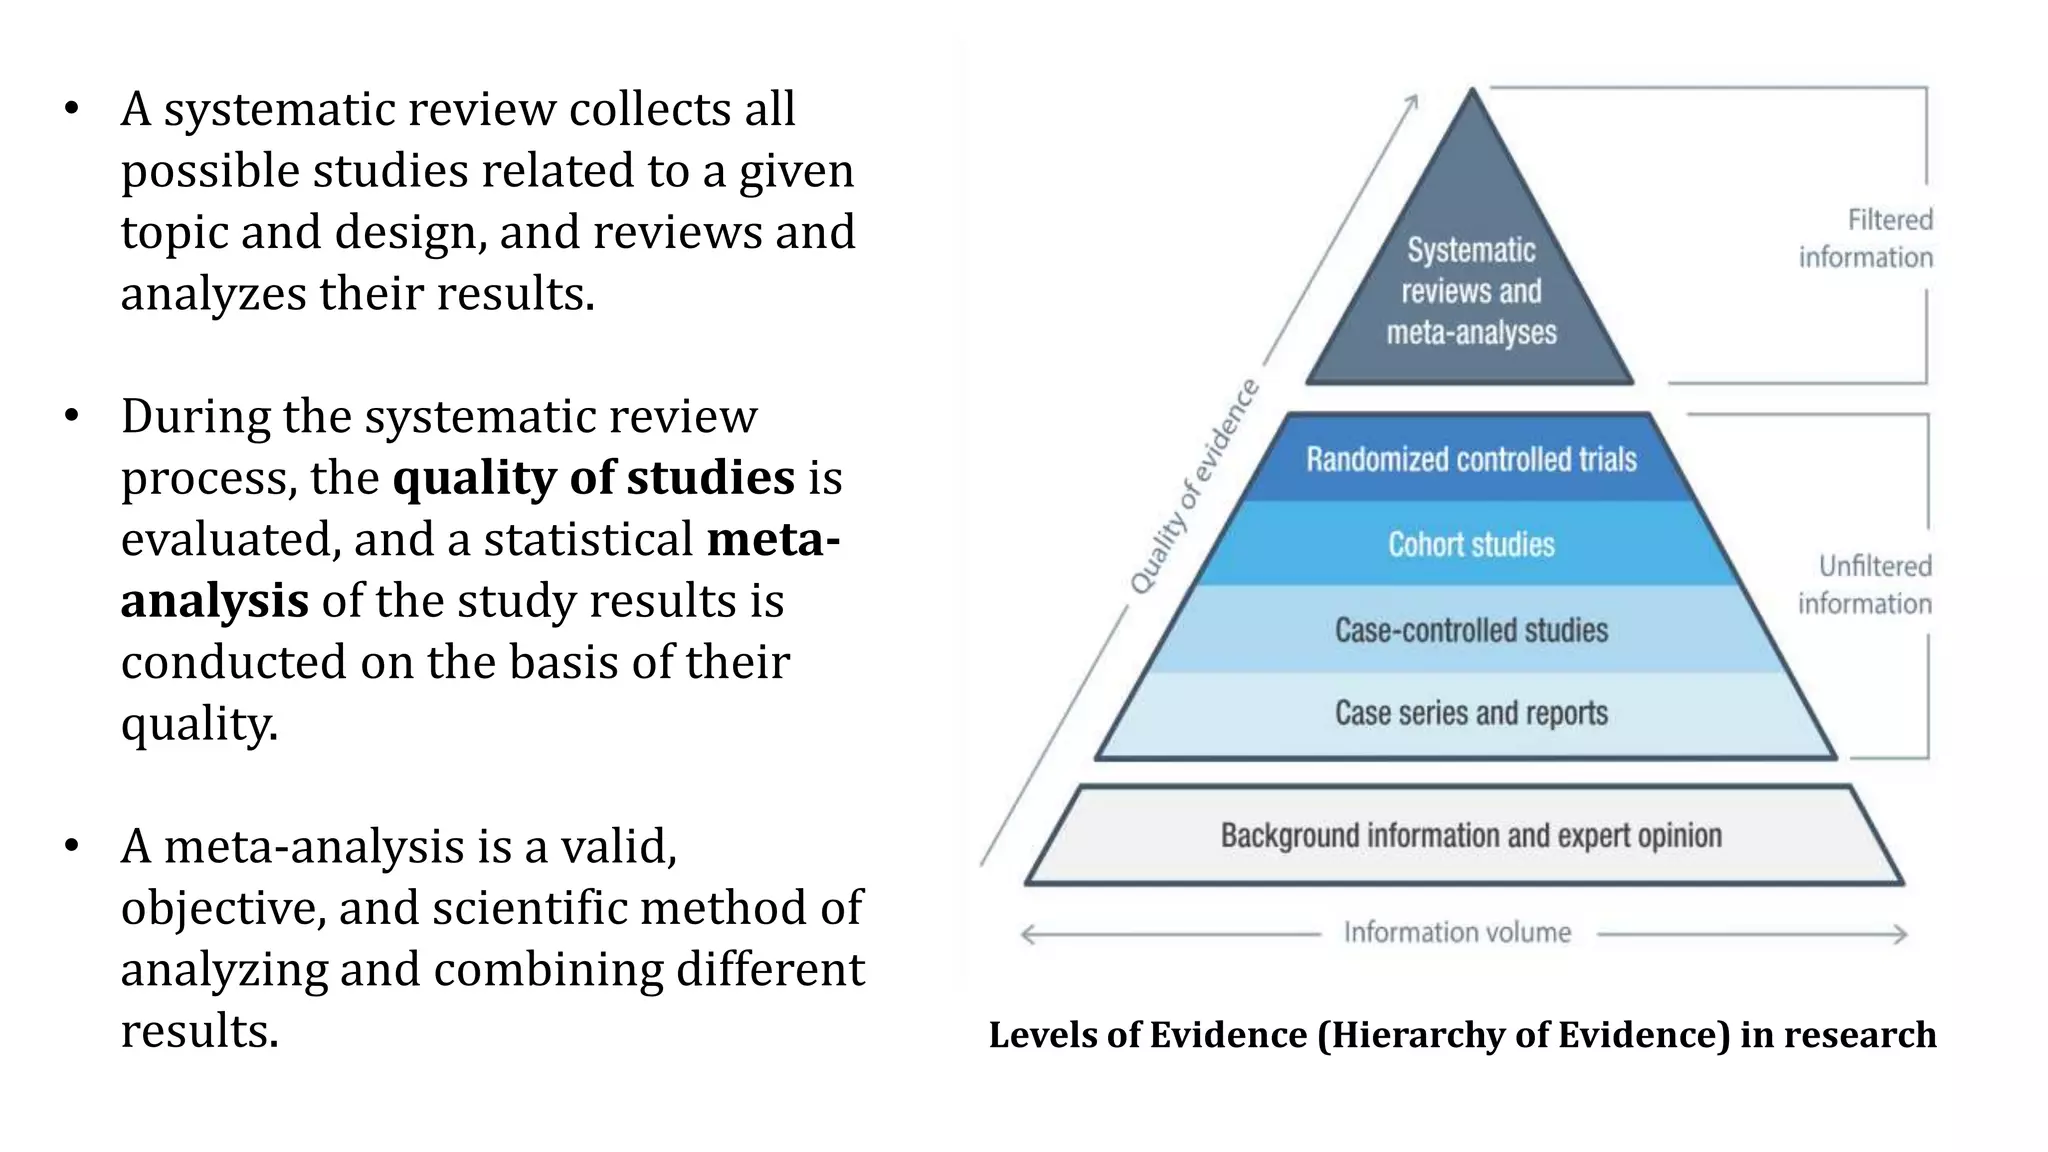
The document is a comprehensive overview of systematic reviews and meta-analyses in biomedical literature, beginning with their significance in synthesizing research evidence for clinical decision-making. It outlines the methodology involved in conducting systematic reviews, including quality assessments, statistical meta-analysis, and addressing publication bias. Key concepts such as effect size, heterogeneity, and risk of bias assessment are also discussed, emphasizing the importance of these tools in deriving reliable conclusions from diverse studies.