Downloaded 368 times

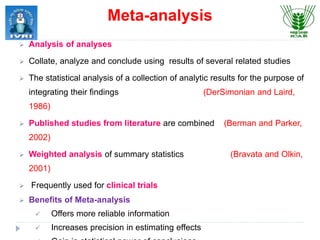
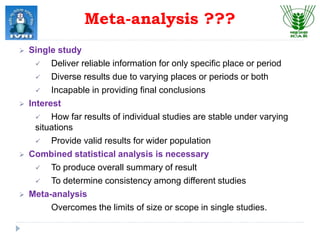

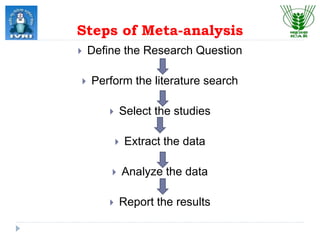


This document explores meta-analysis techniques in epidemiology, outlining its advantages, disadvantages, and historical background. It emphasizes the importance of combining data from multiple studies to overcome limitations of individual studies and to increase the reliability and precision of findings. The document also highlights various models used in meta-analysis, the assessment of publication bias, and its application in animal and veterinary science.