LEARNING OBJECTIVES
• DefineQuality control
• What are the different types of Quality Control.
• Explain the significance of QC in clinical
laboratory
• Describe the significance of L J charts in
statistical quality control.
3.
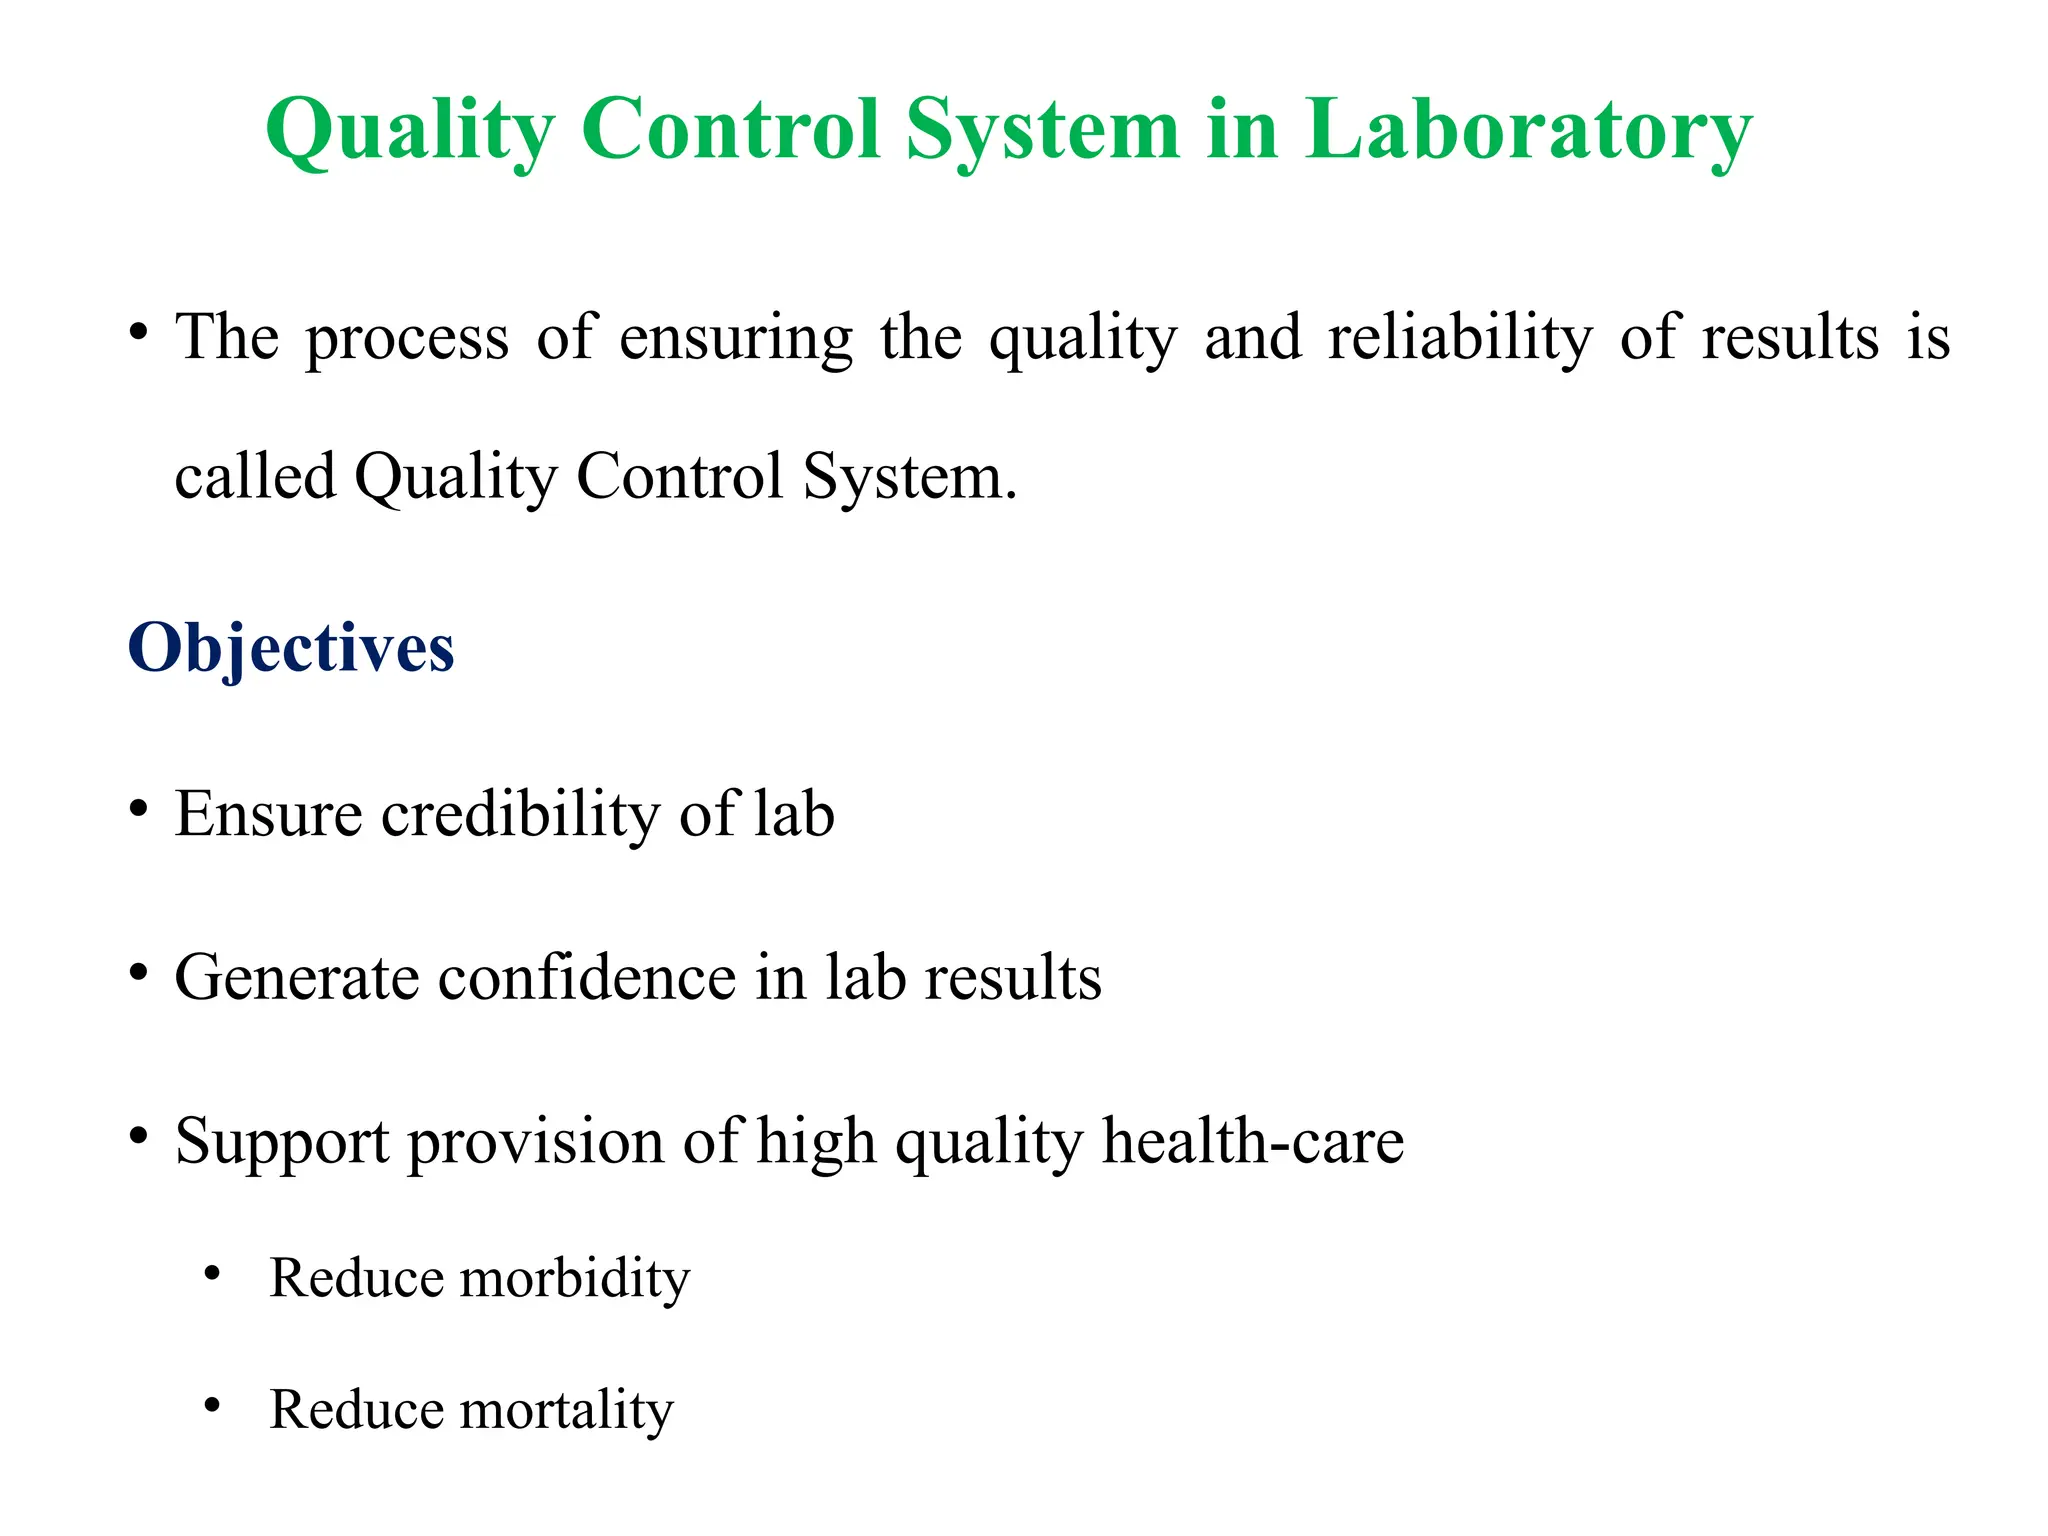
Quality Control Systemin Laboratory
• The process of ensuring the quality and reliability of results is
called Quality Control System.
Objectives
• Ensure credibility of lab
• Generate confidence in lab results
• Support provision of high quality health-care
• Reduce morbidity
• Reduce mortality
5.
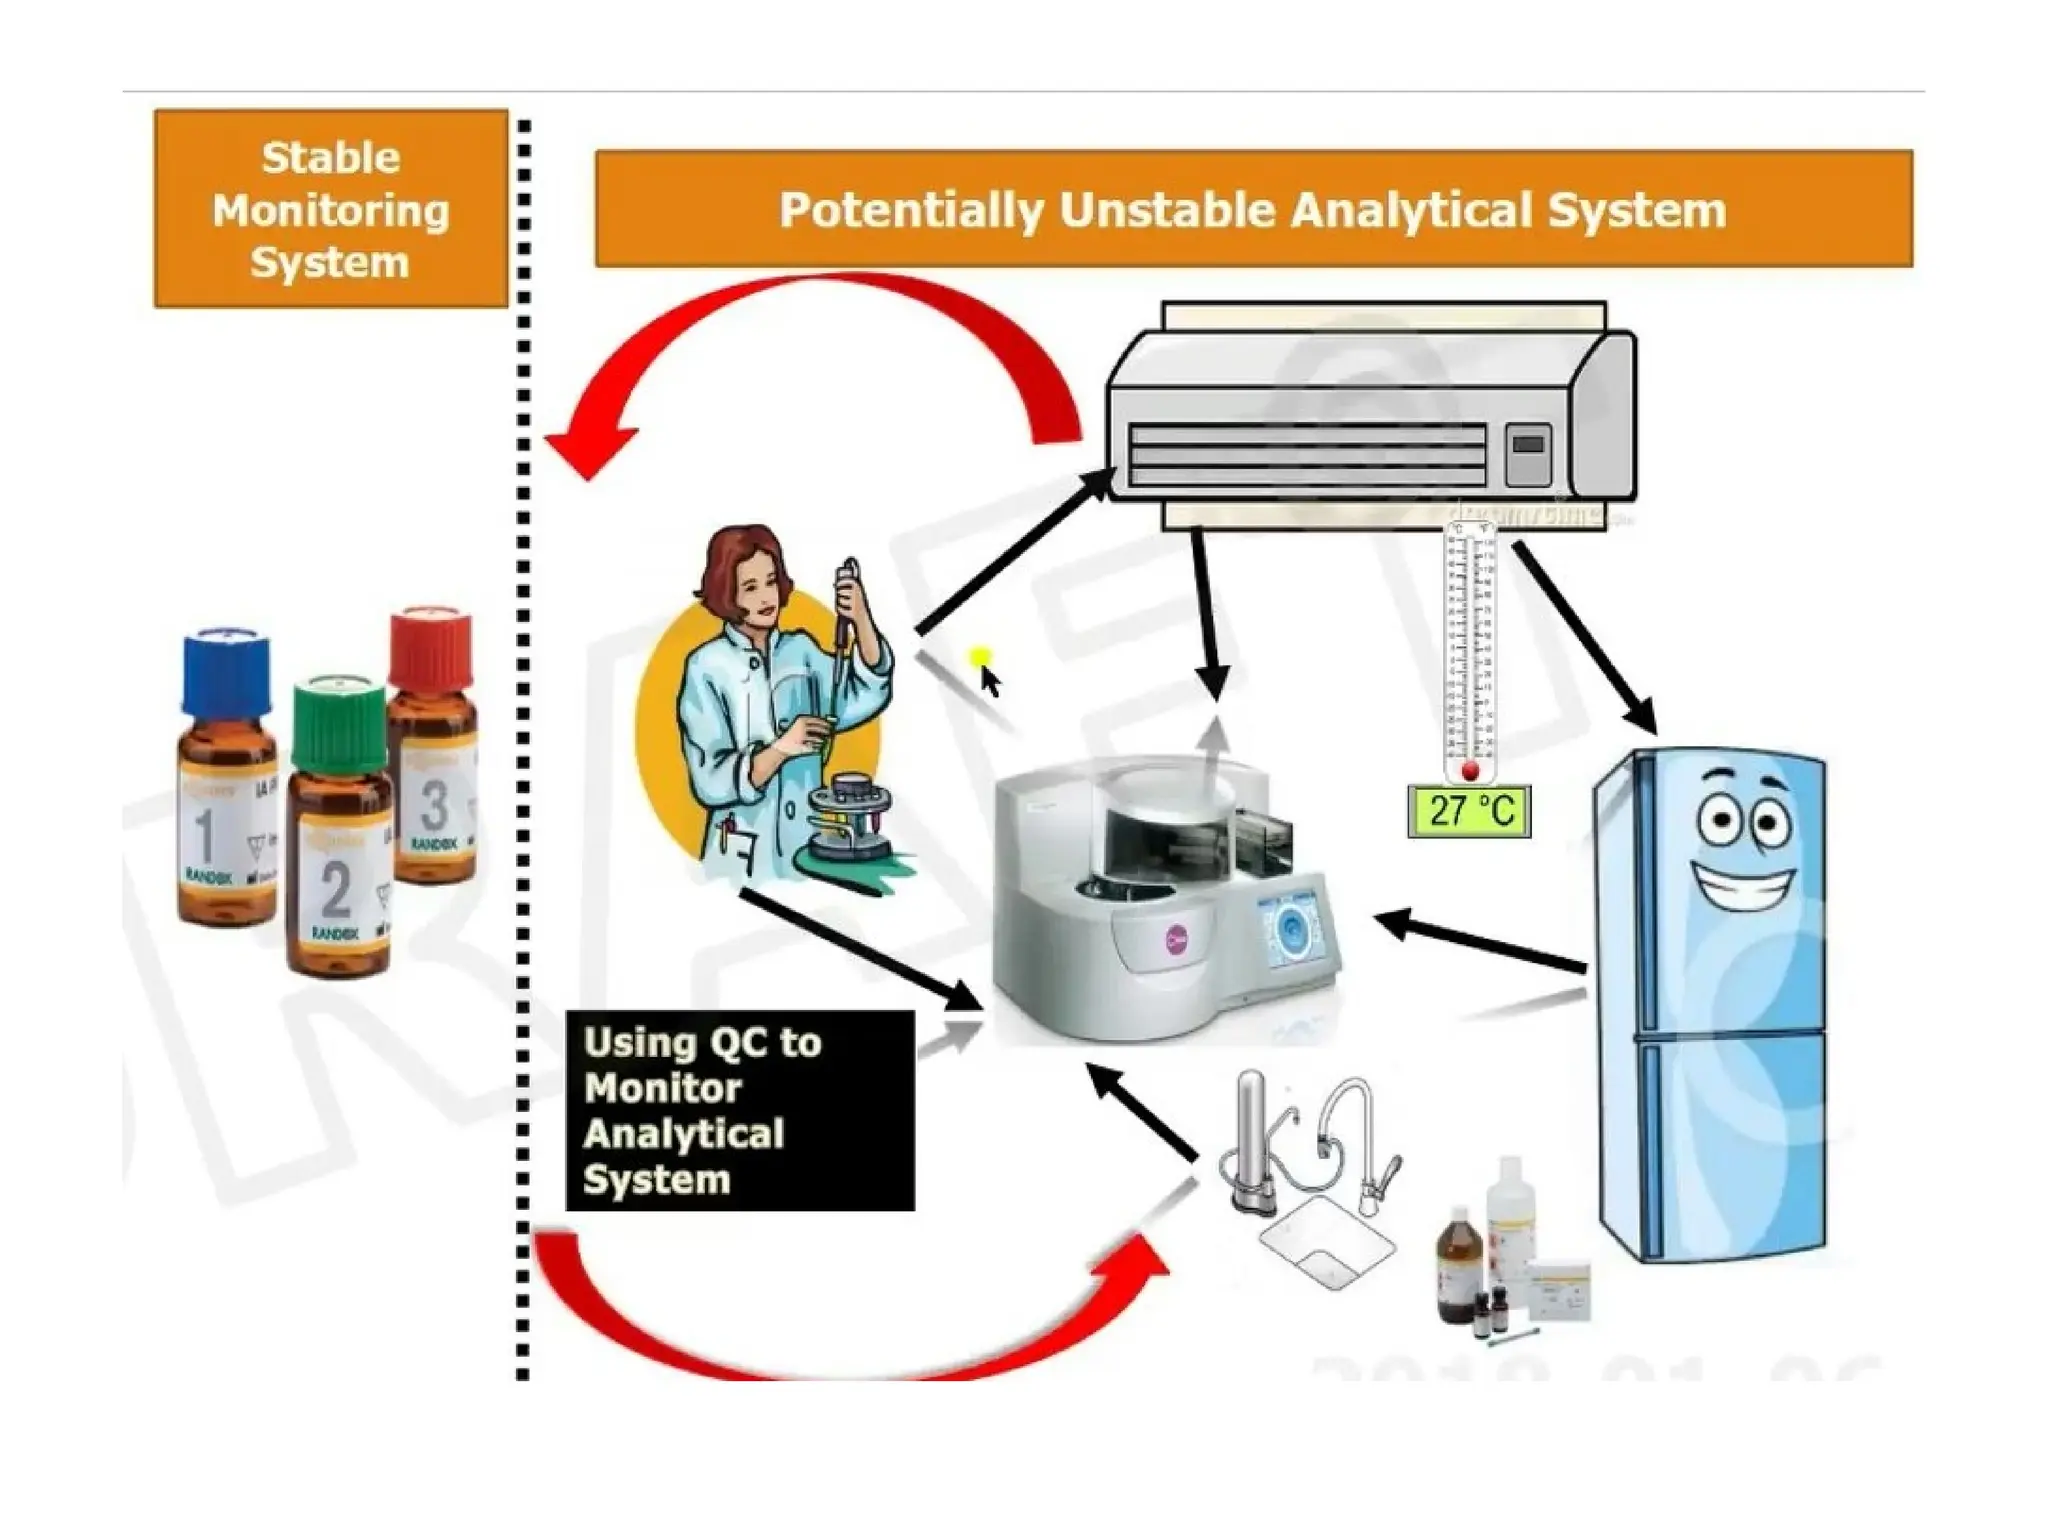
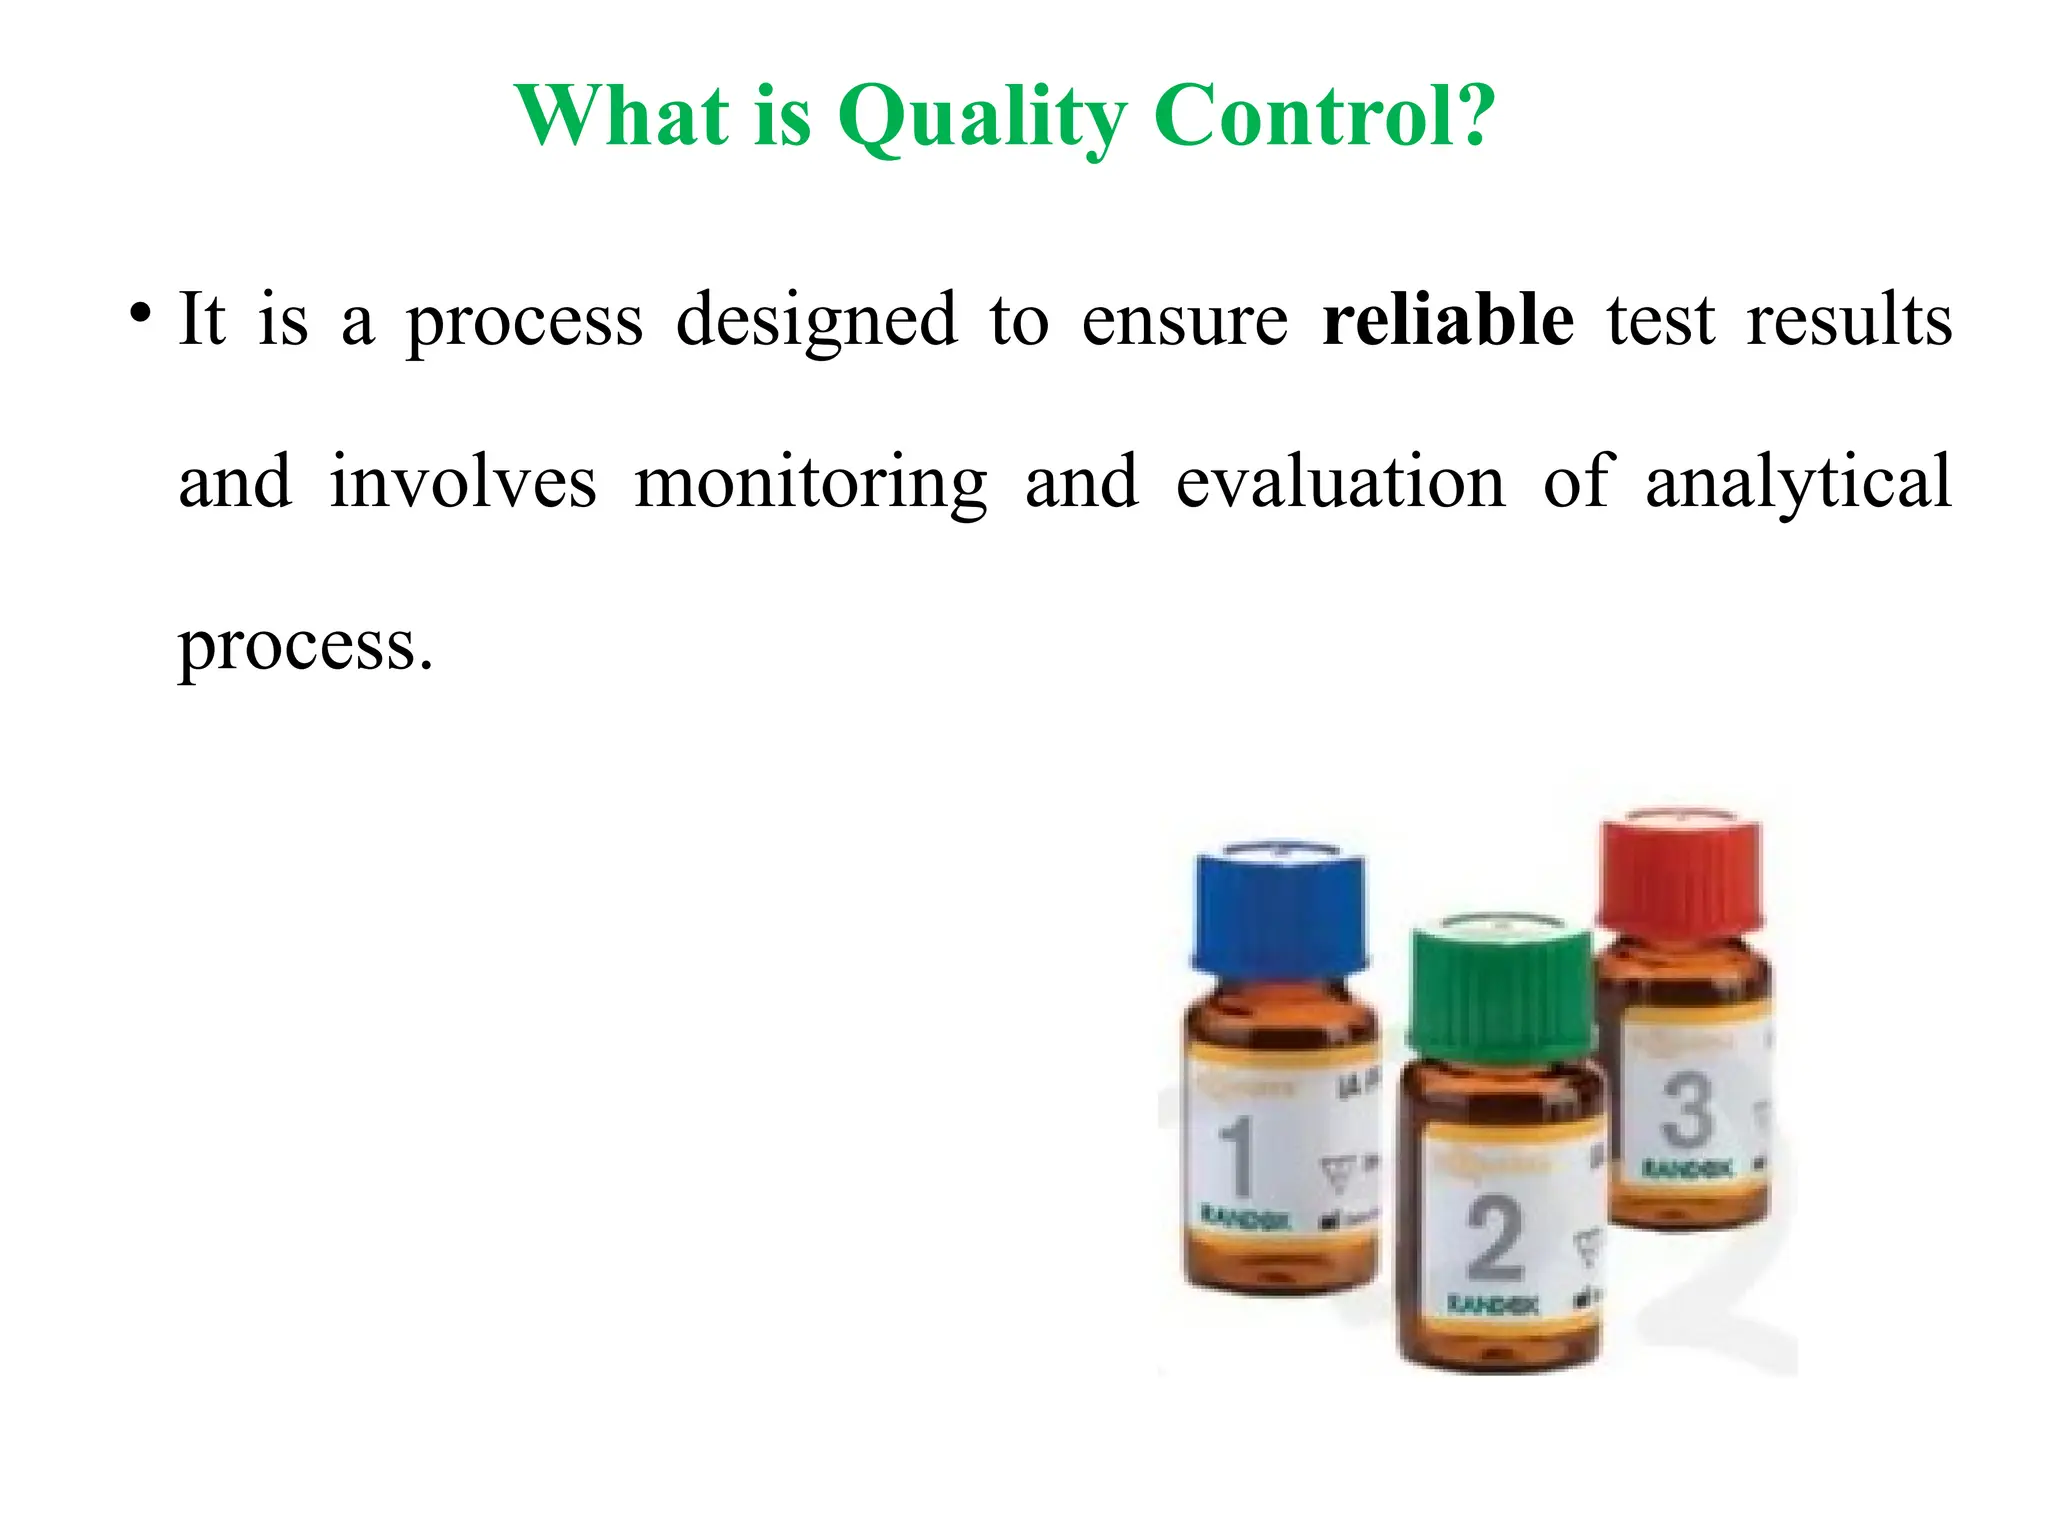
What is QualityControl?
• It is a process designed to ensure reliable test results
and involves monitoring and evaluation of analytical
process.
6.
How the reliabilityof report is ensured?
• Regular testing of quality control products.
• Monitoring and evaluation of quality control results
with the help of specific statistical methods.
7.
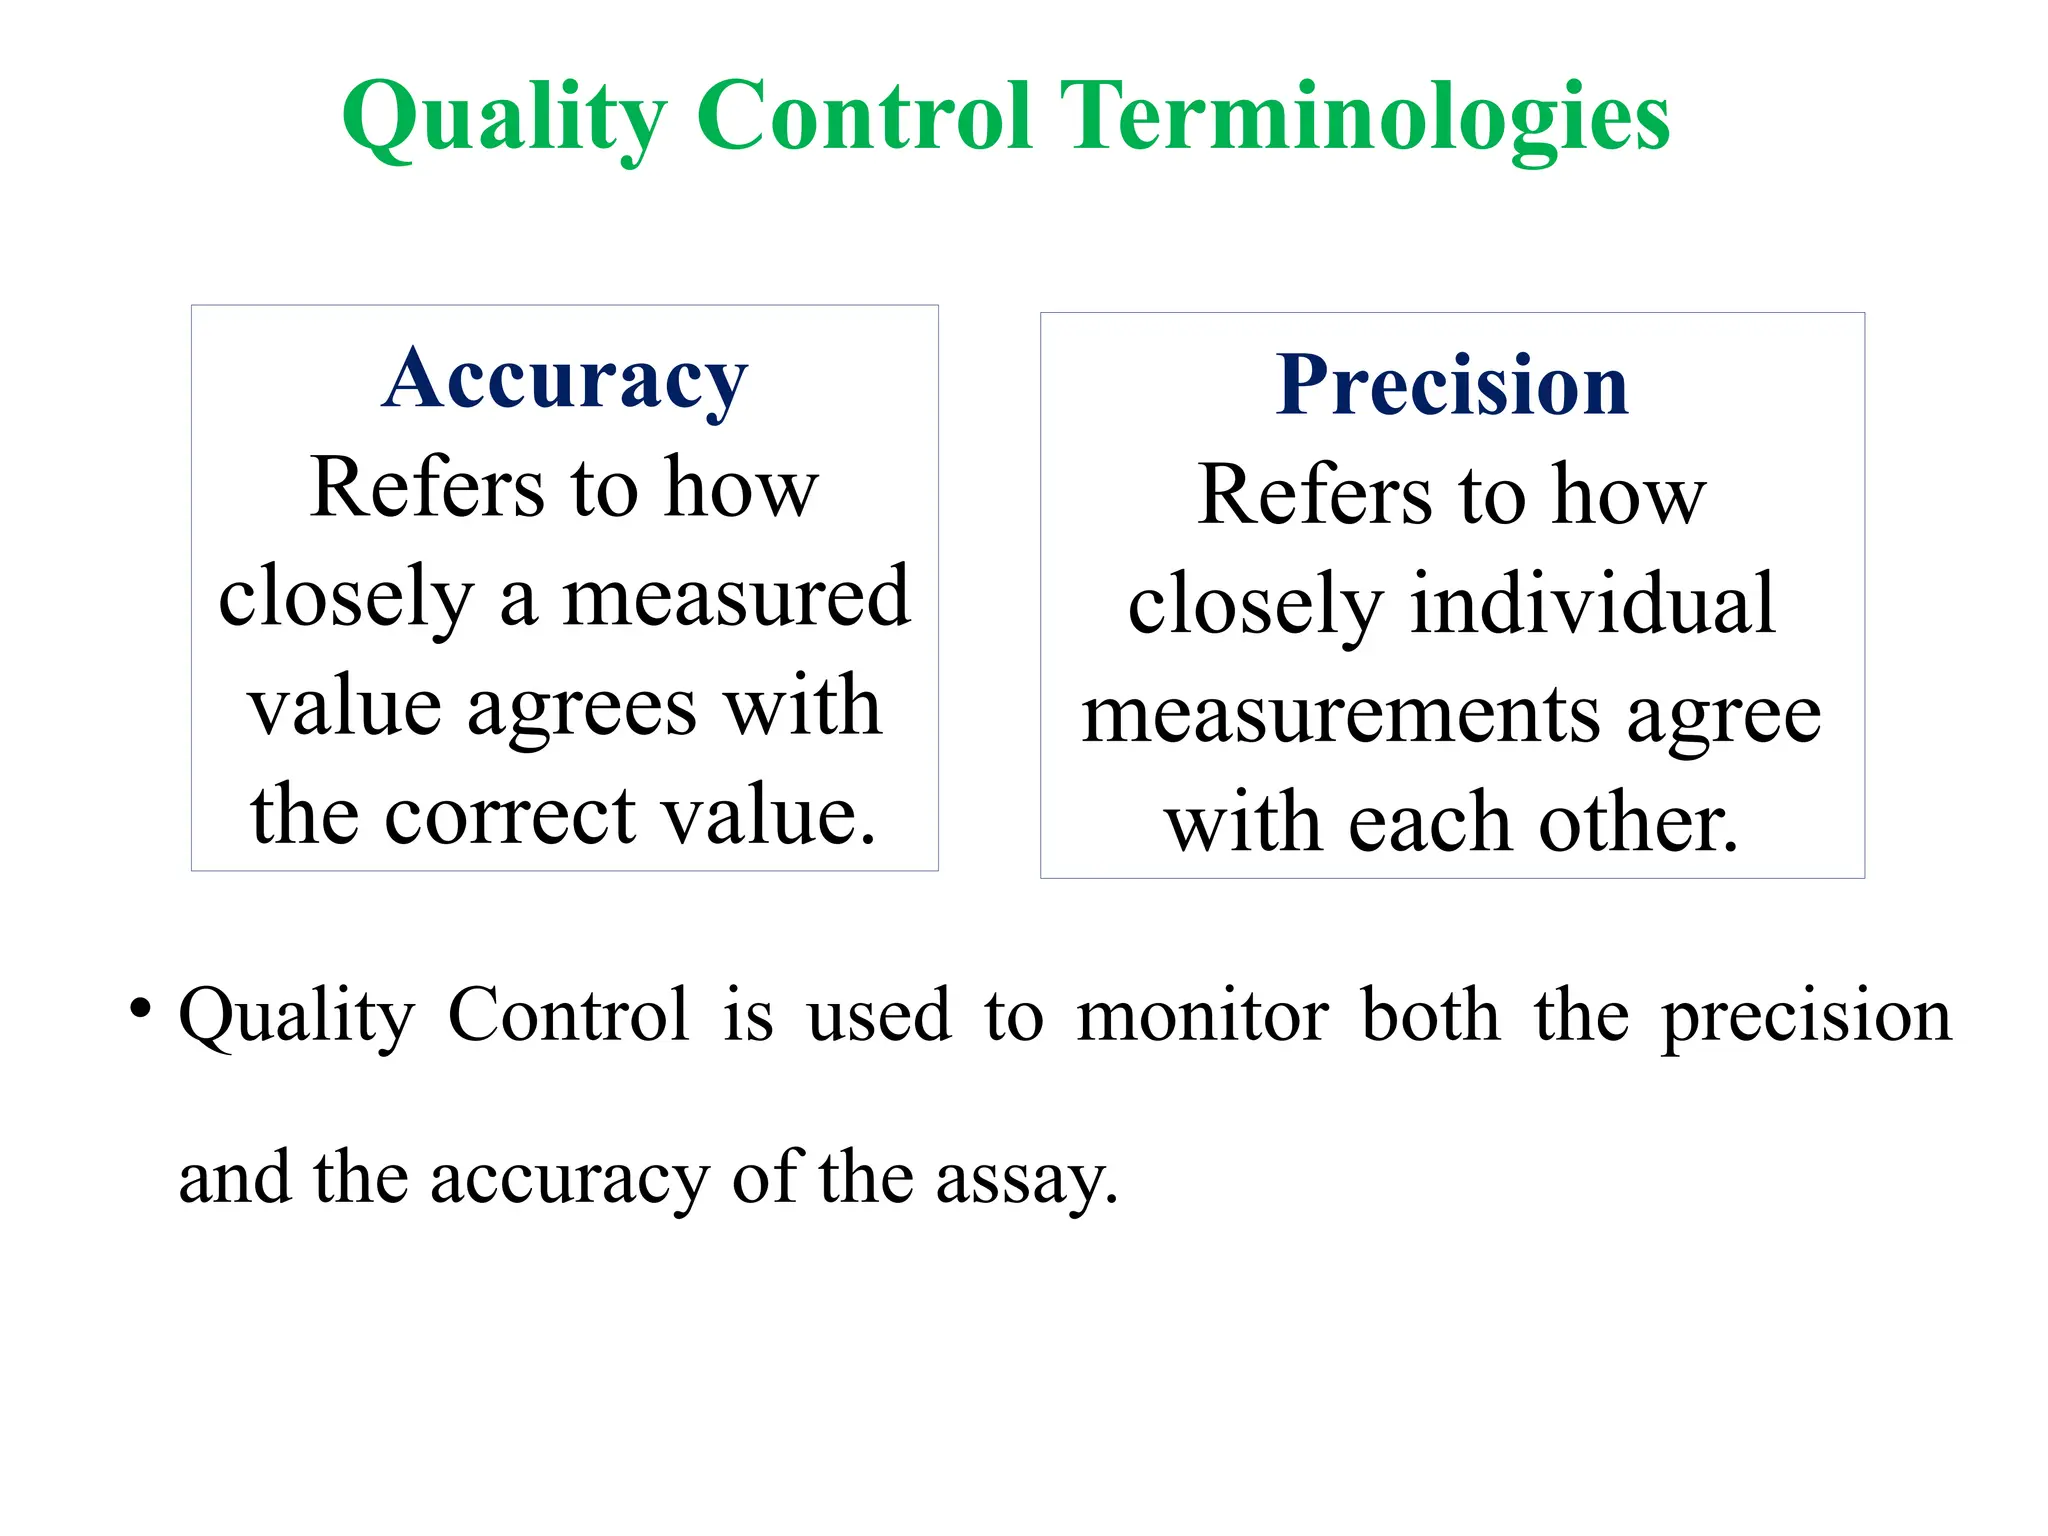
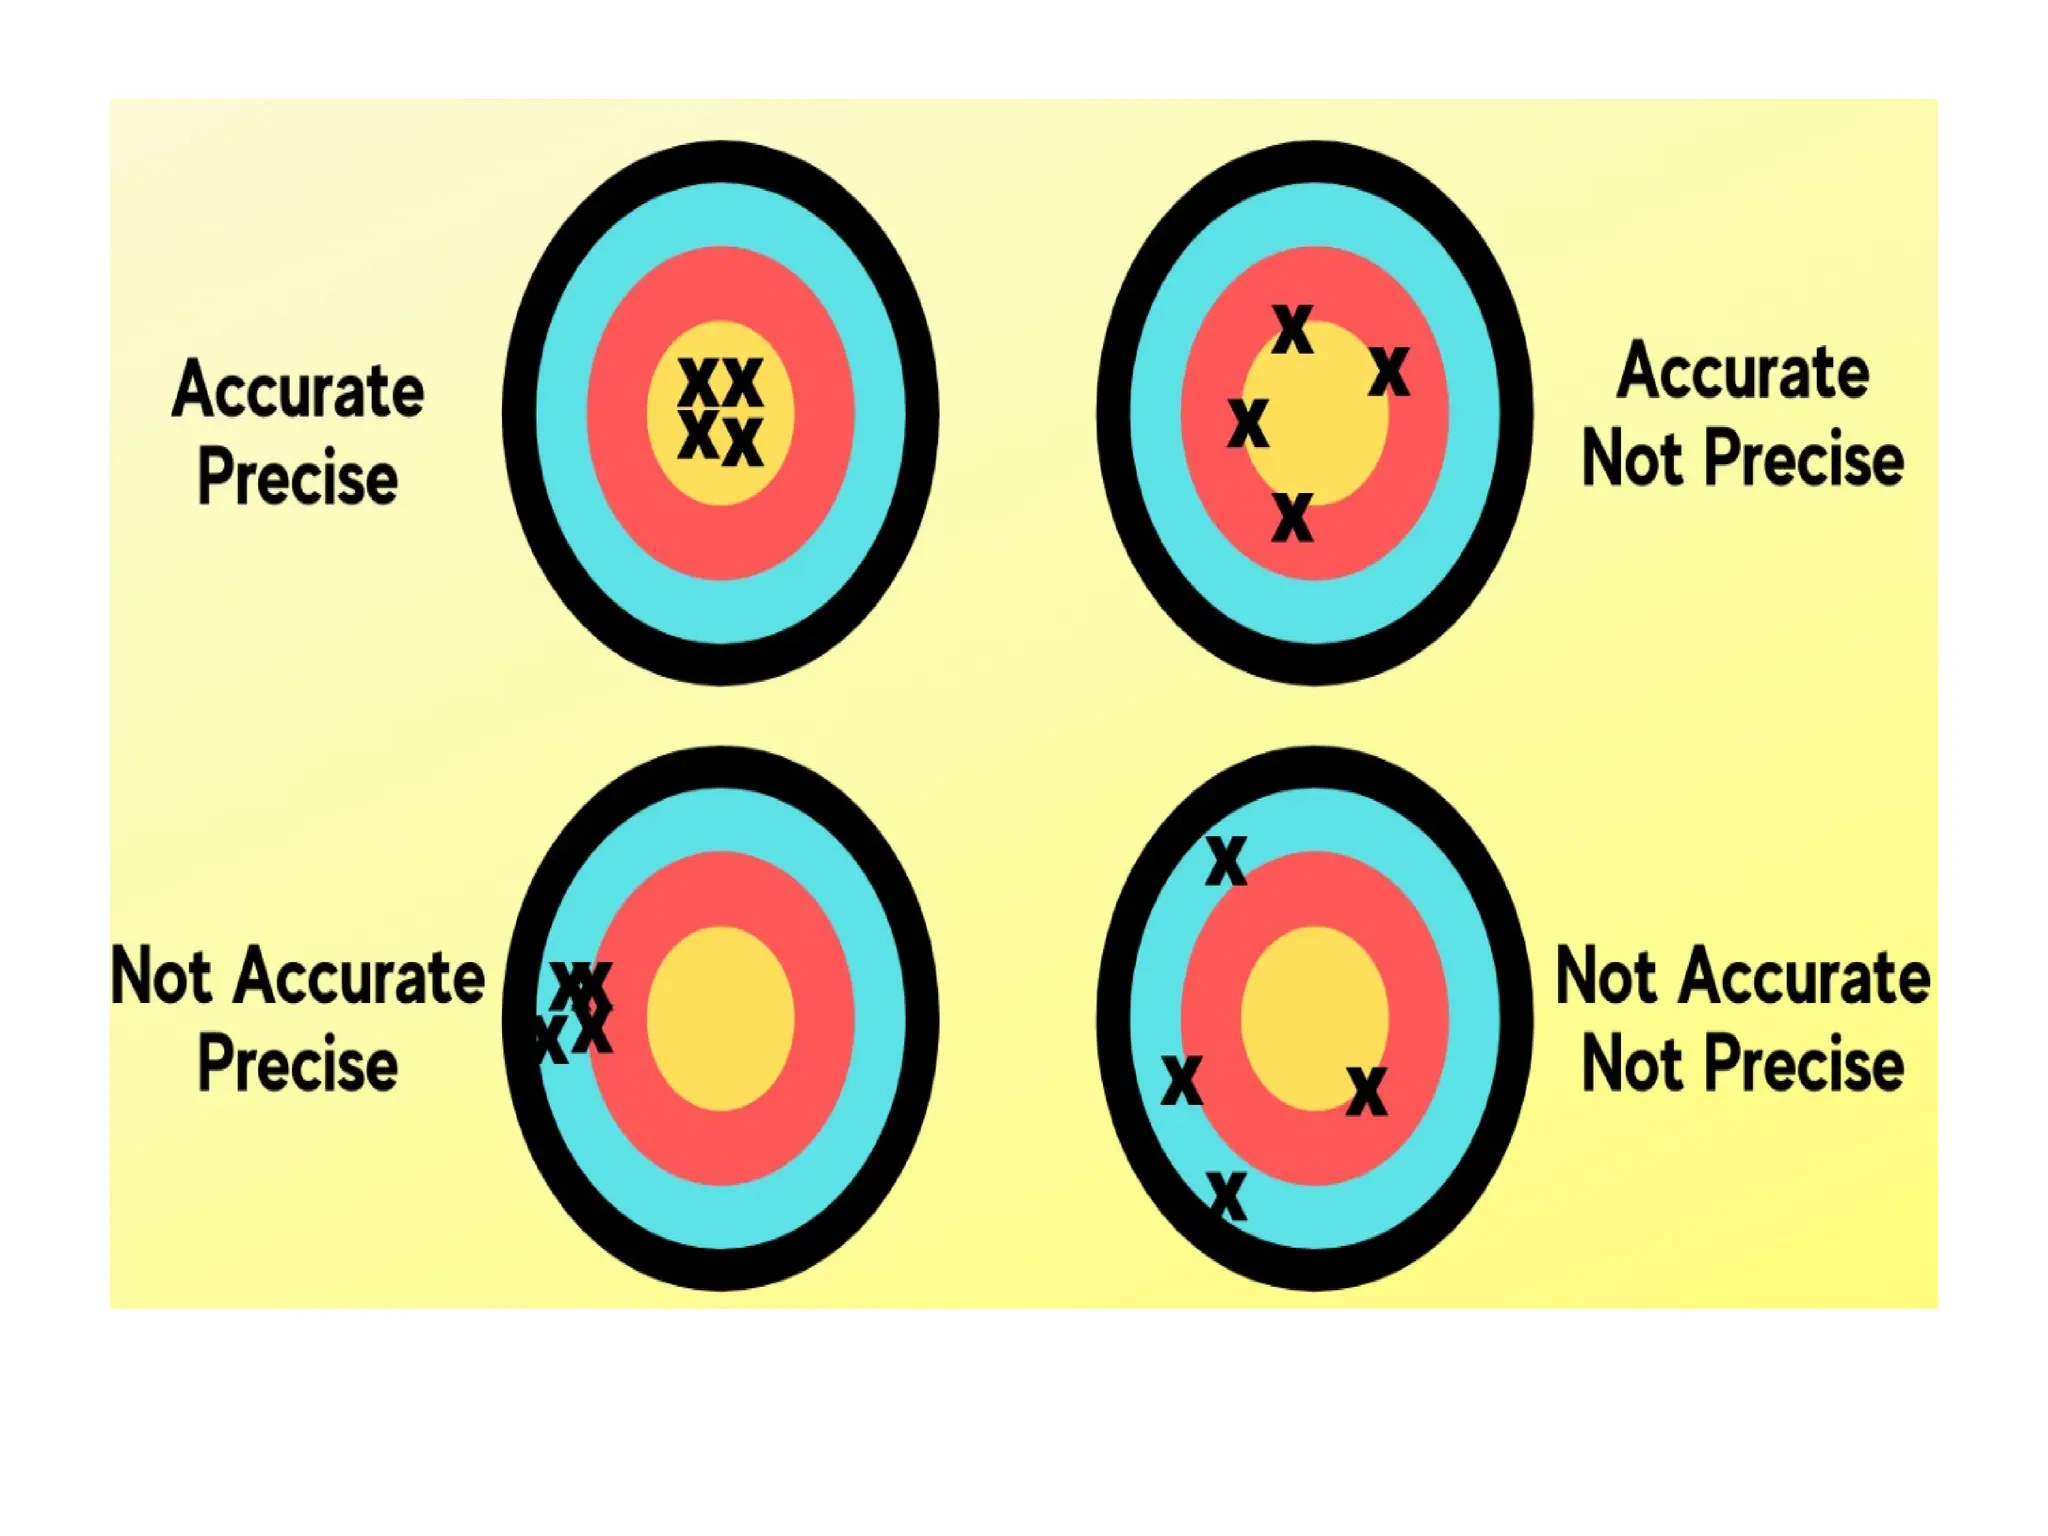
Quality Control Terminologies
•Quality Control is used to monitor both the precision
and the accuracy of the assay.
Accuracy
Refers to how
closely a measured
value agrees with
the correct value.
Precision
Refers to how
closely individual
measurements agree
with each other.
9.
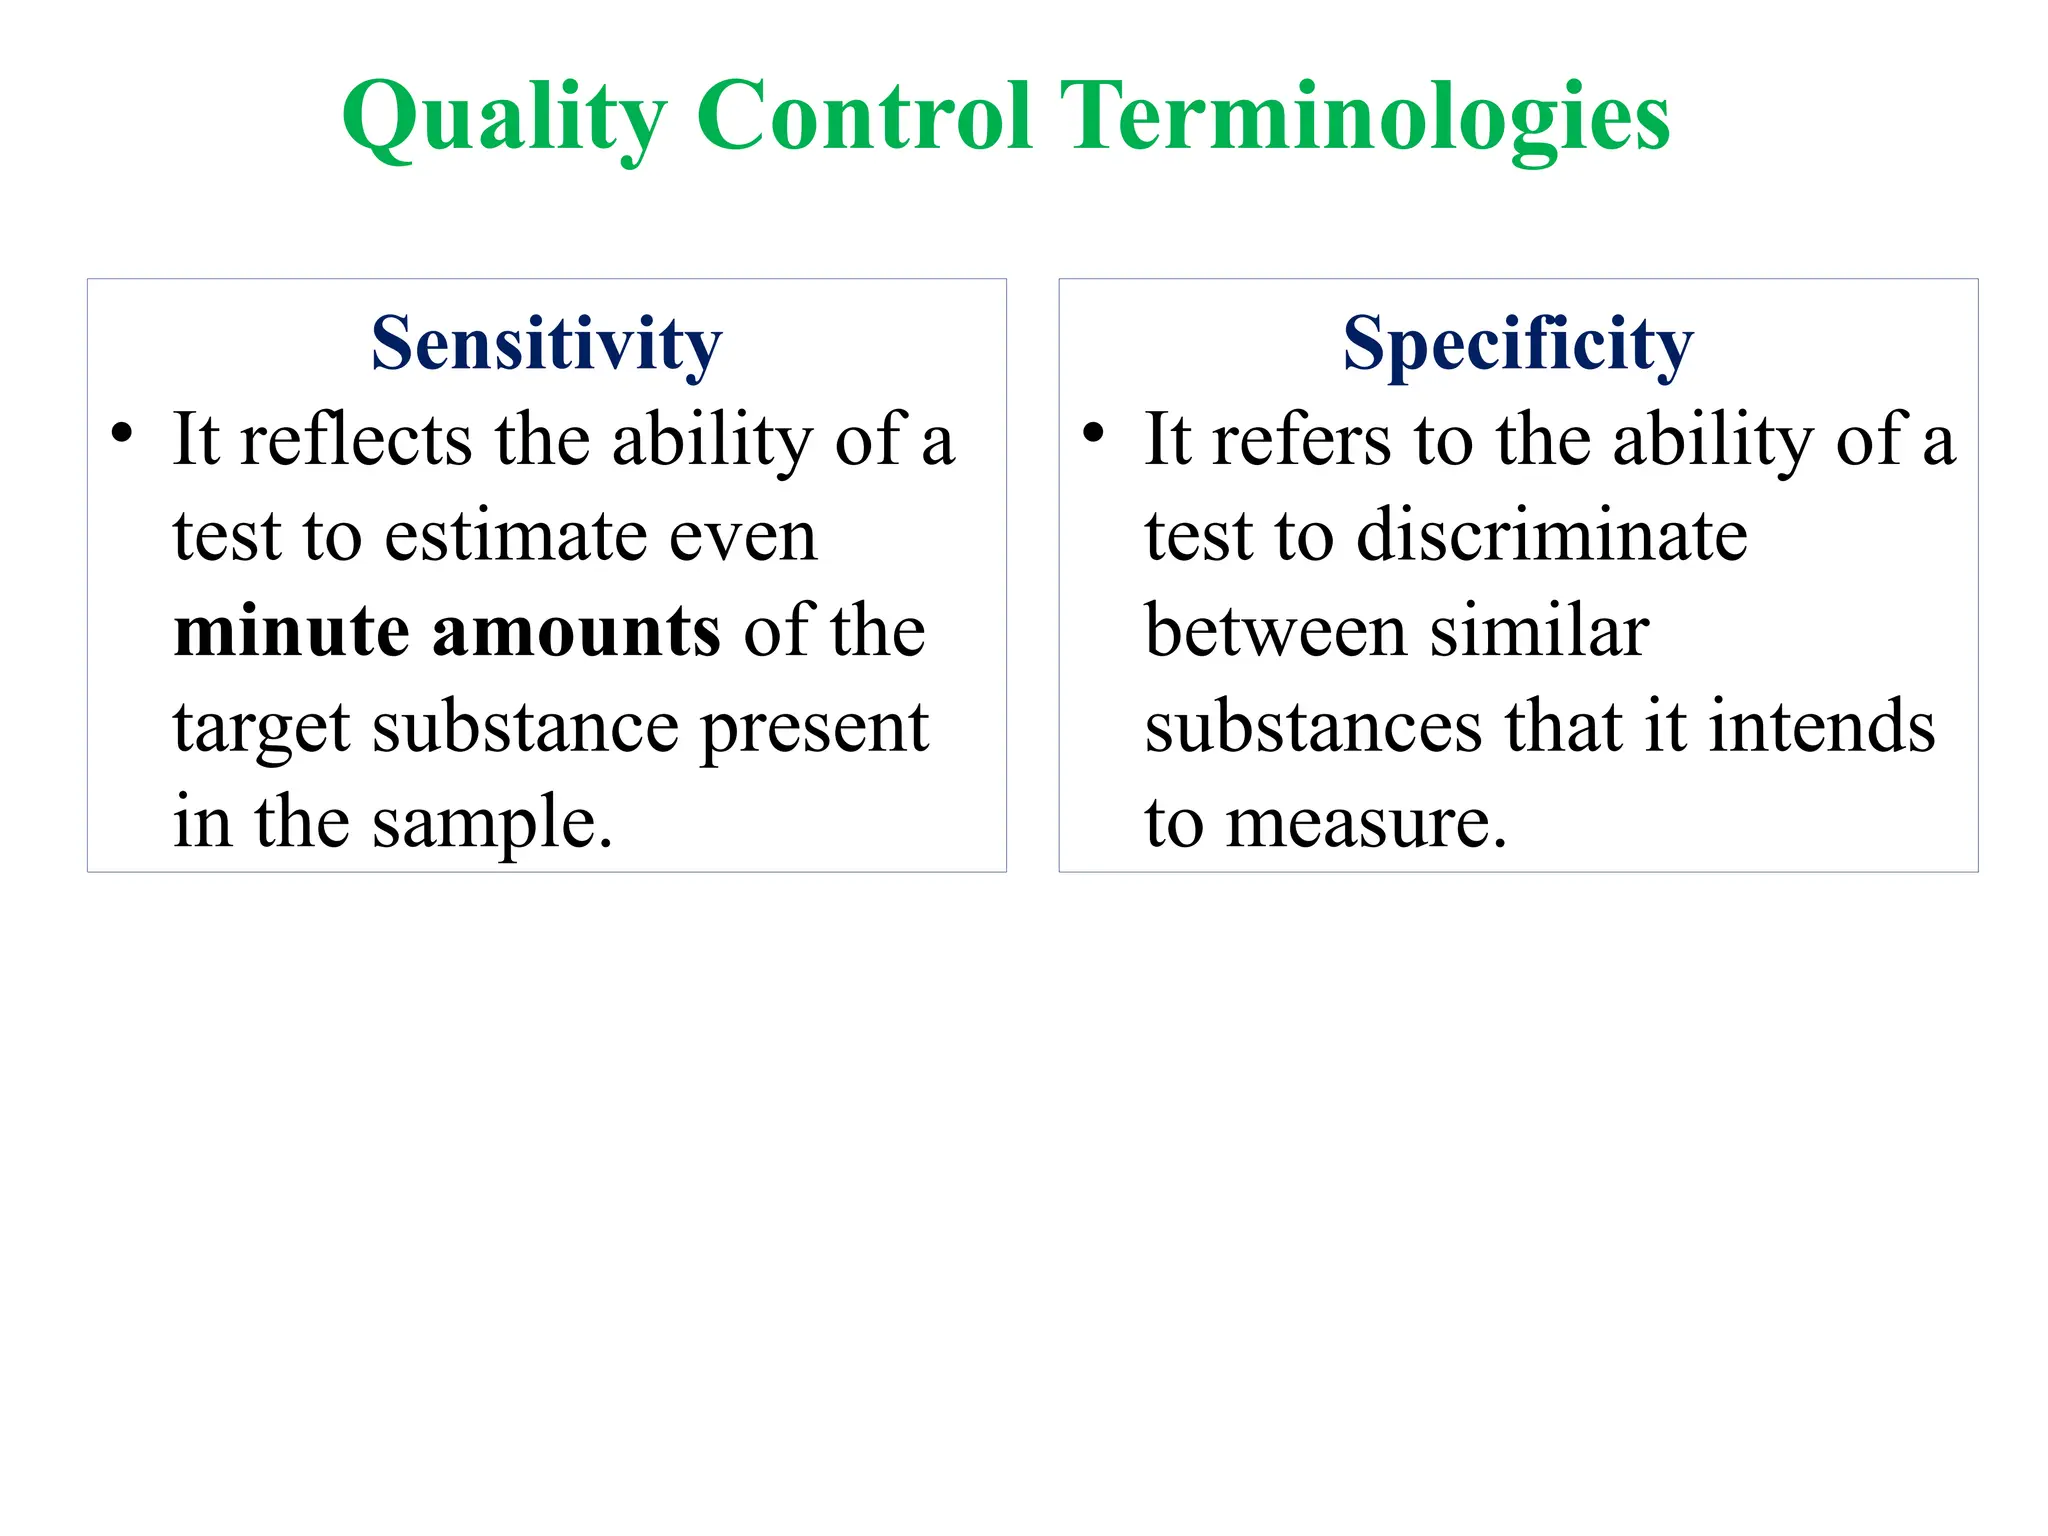
Sensitivity
• It reflectsthe ability of a
test to estimate even
minute amounts of the
target substance present
in the sample.
Specificity
• It refers to the ability of a
test to discriminate
between similar
substances that it intends
to measure.
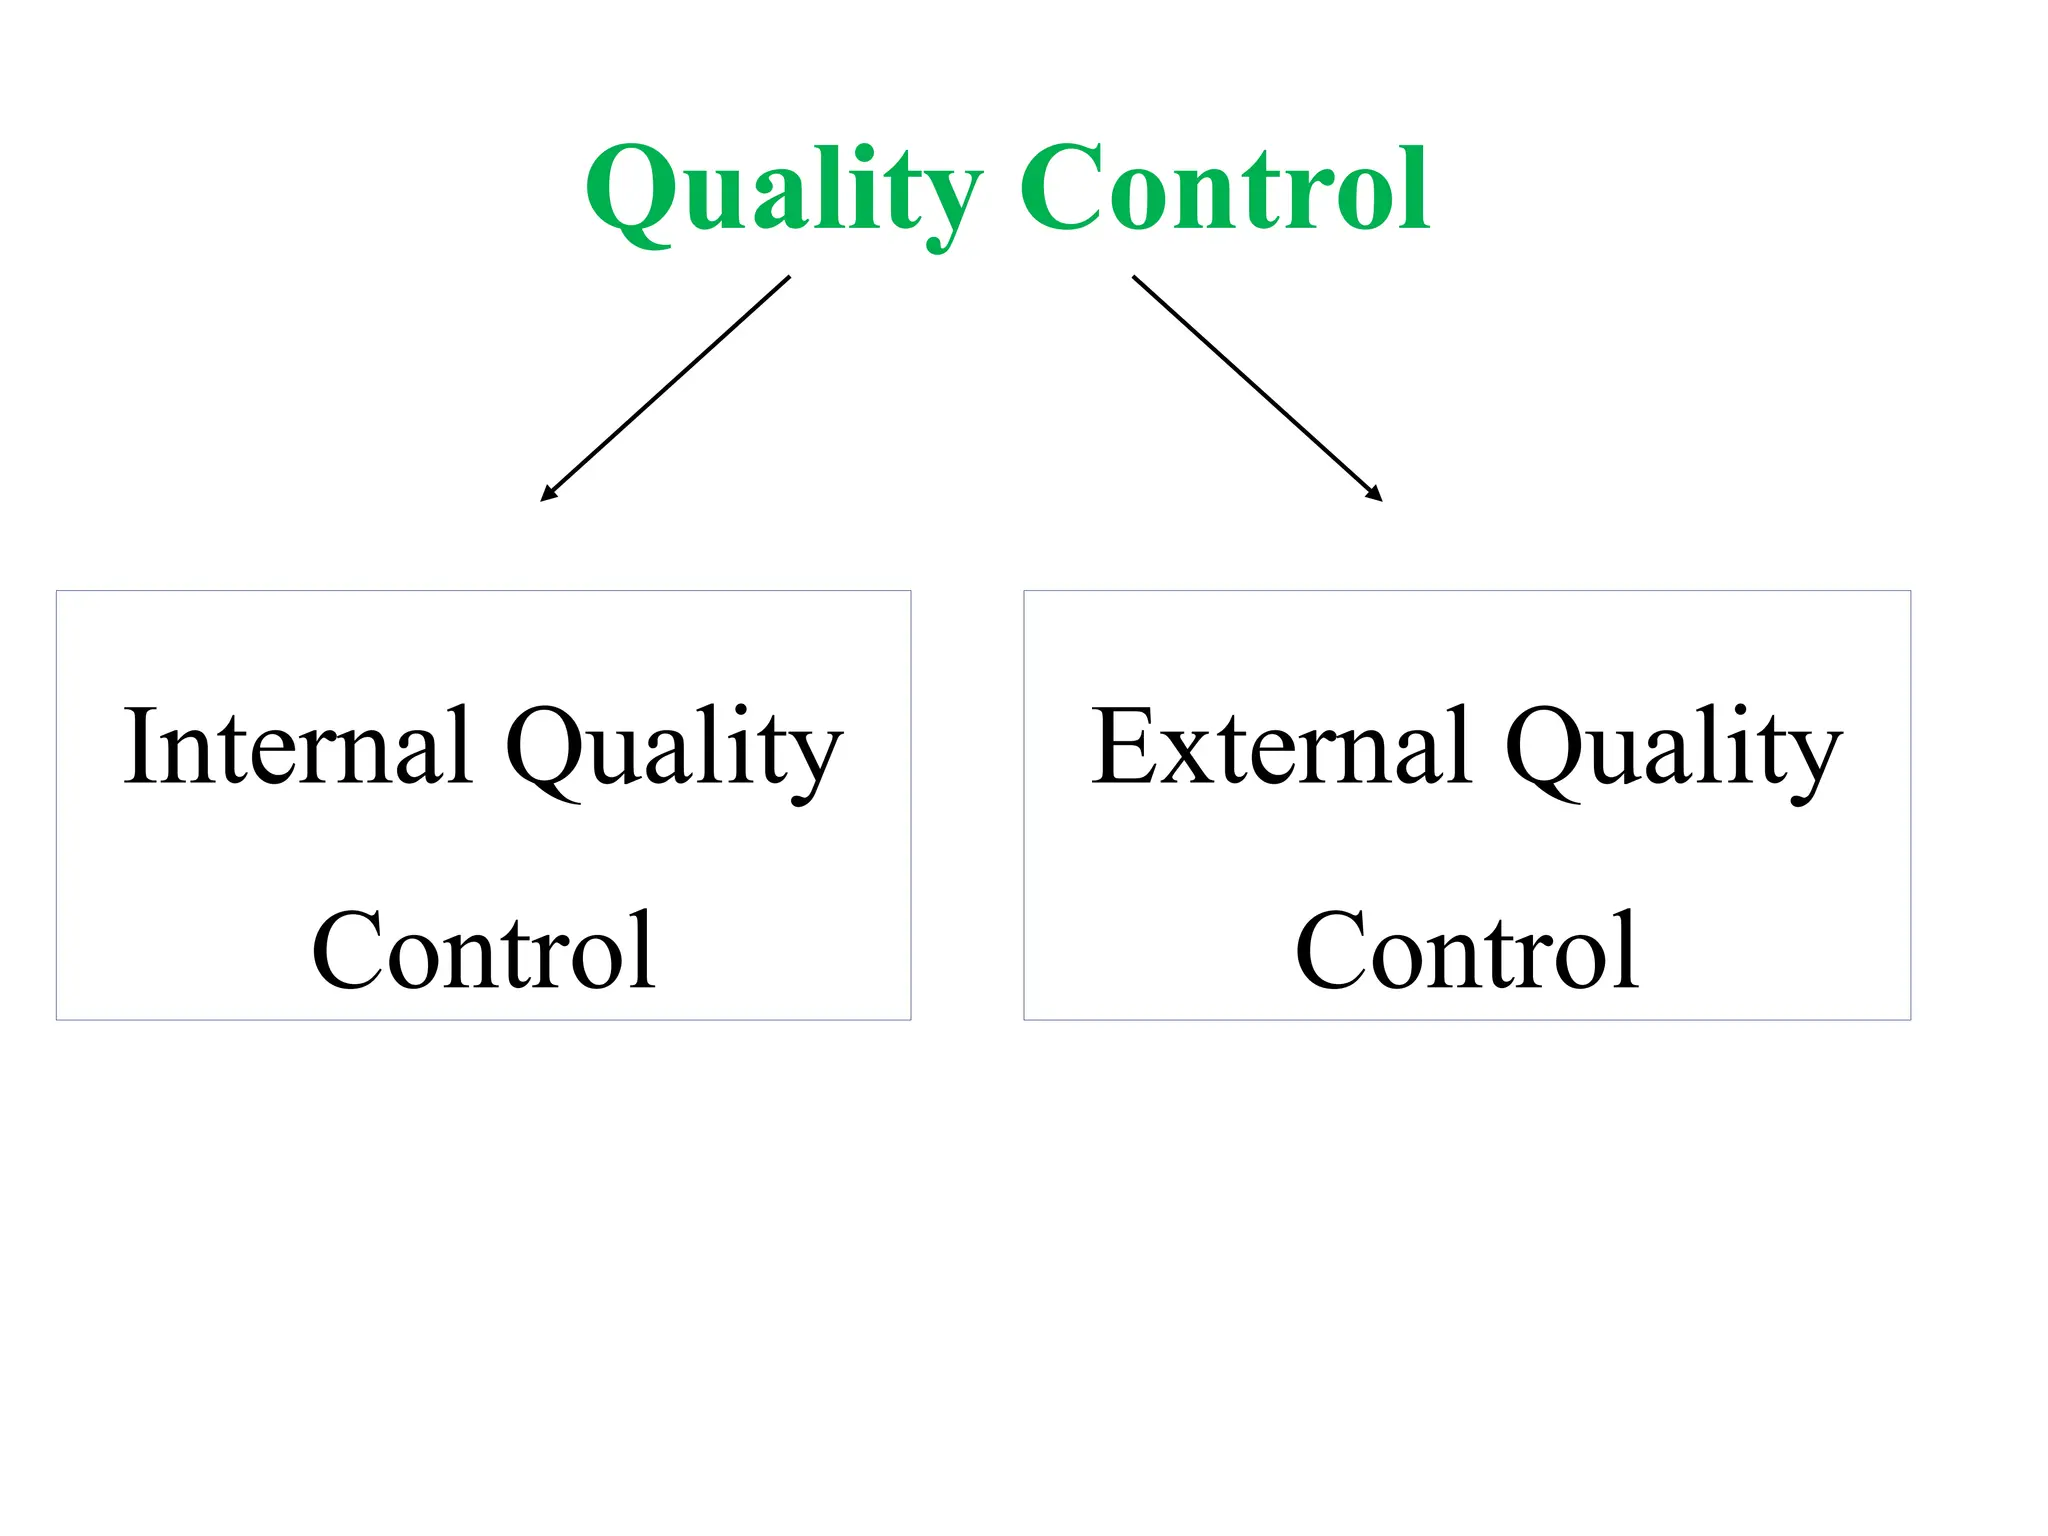
Quality Control Terminologies
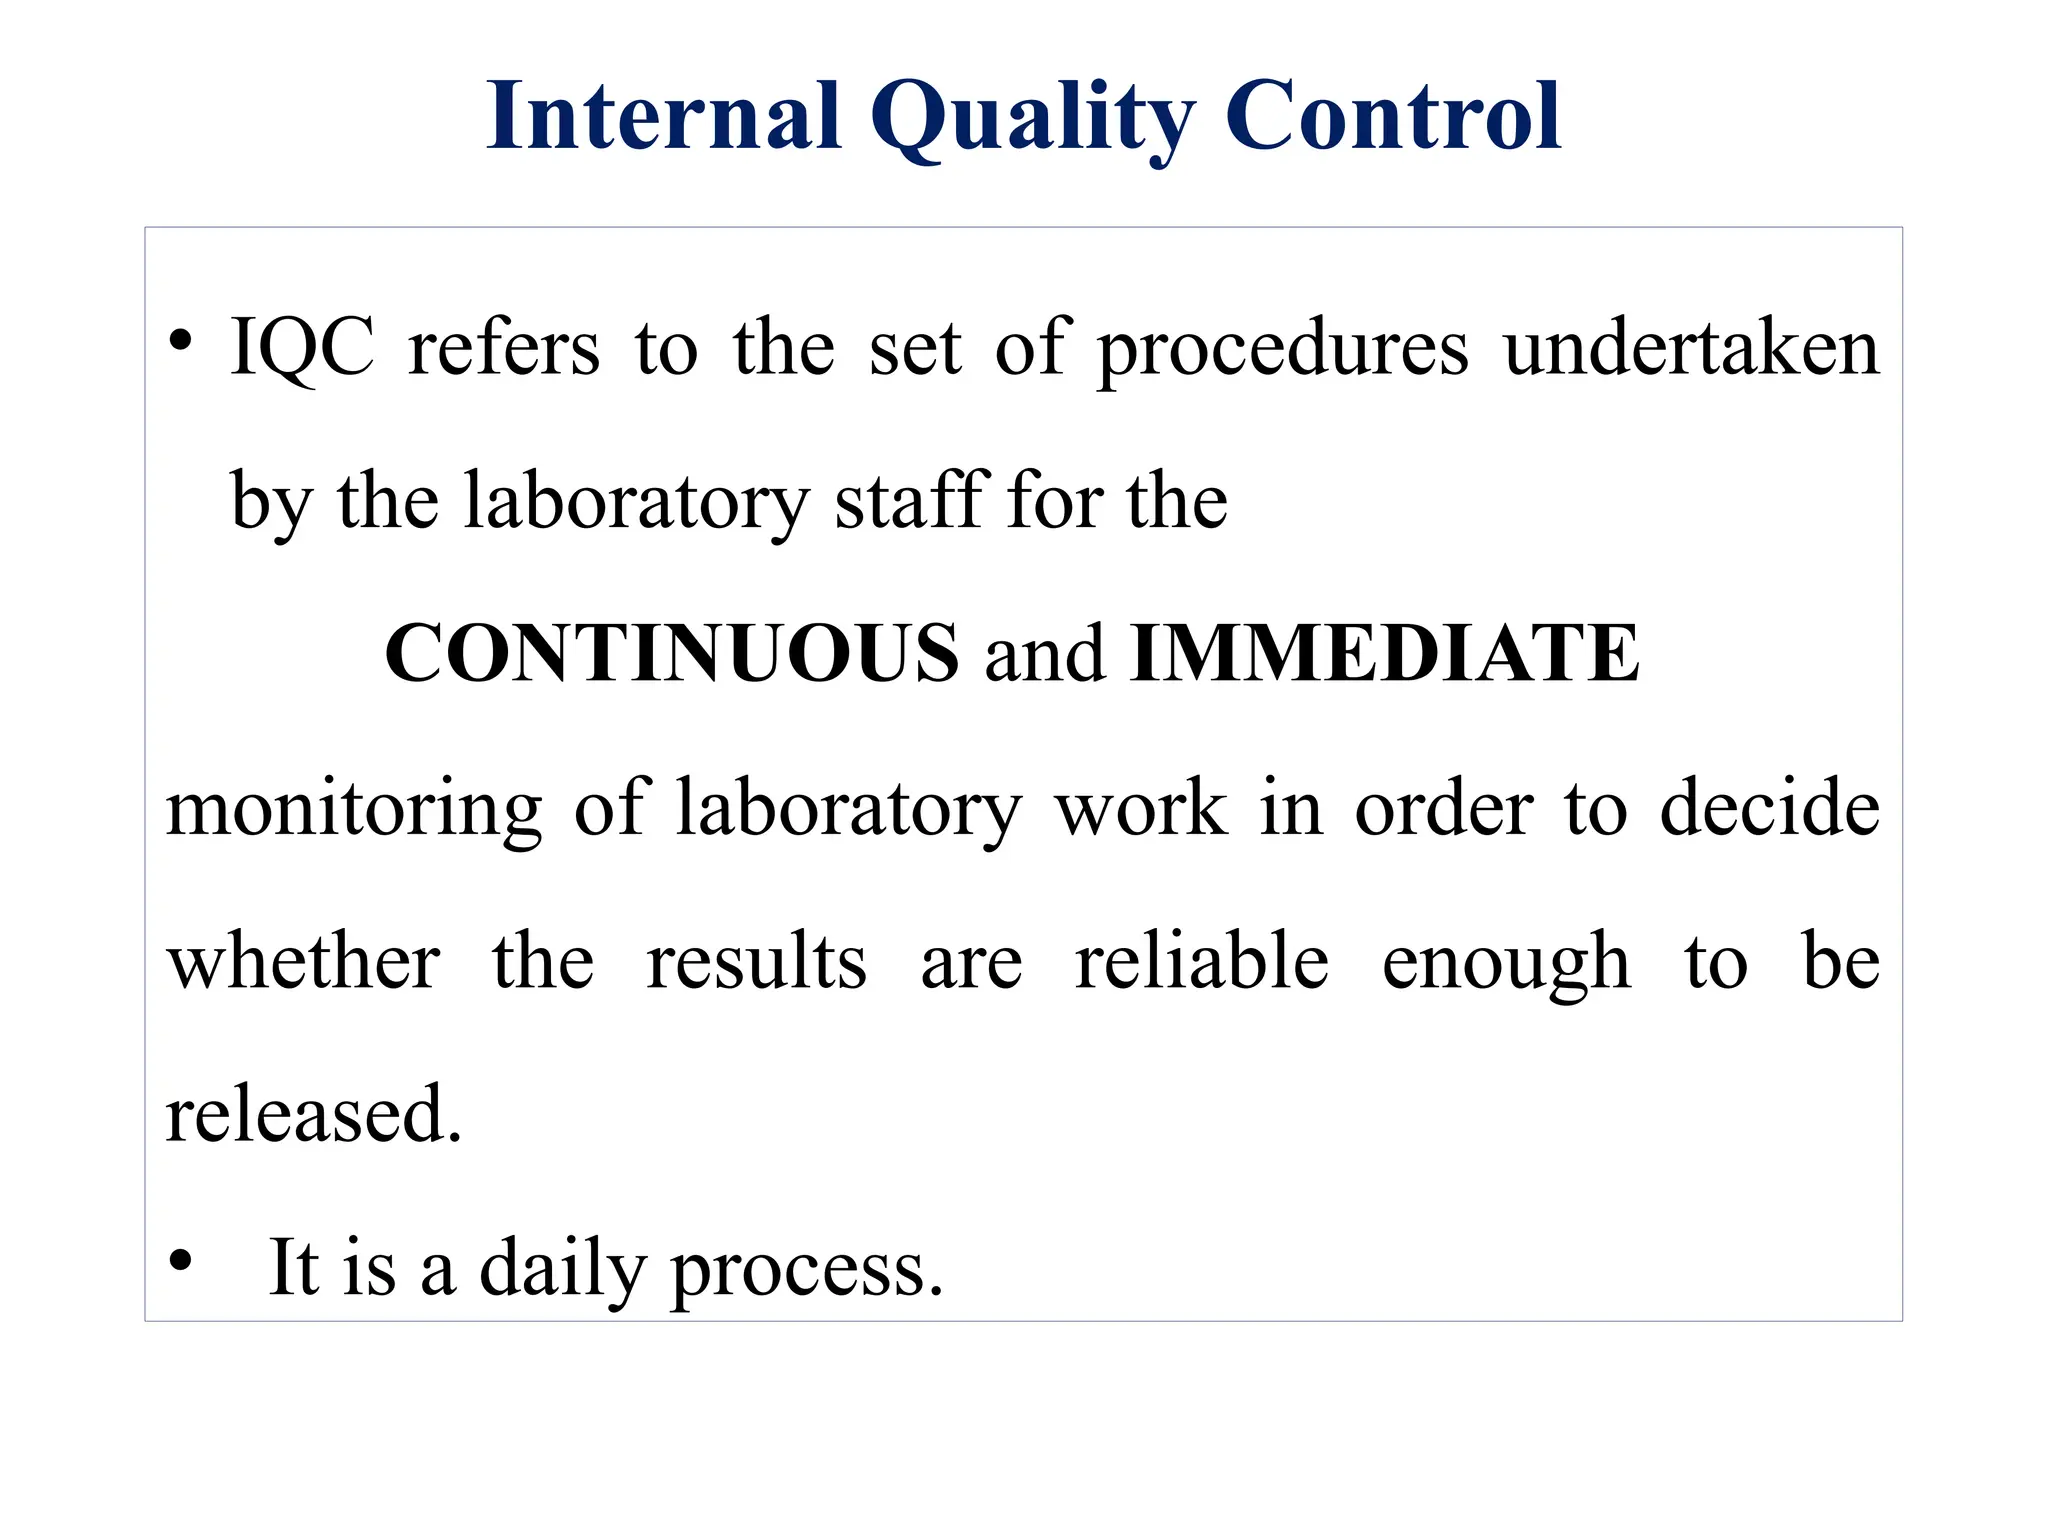
Internal Quality Control
•IQC refers to the set of procedures undertaken
by the laboratory staff for the
CONTINUOUS and IMMEDIATE
monitoring of laboratory work in order to decide
whether the results are reliable enough to be
released.
• It is a daily process.
12.
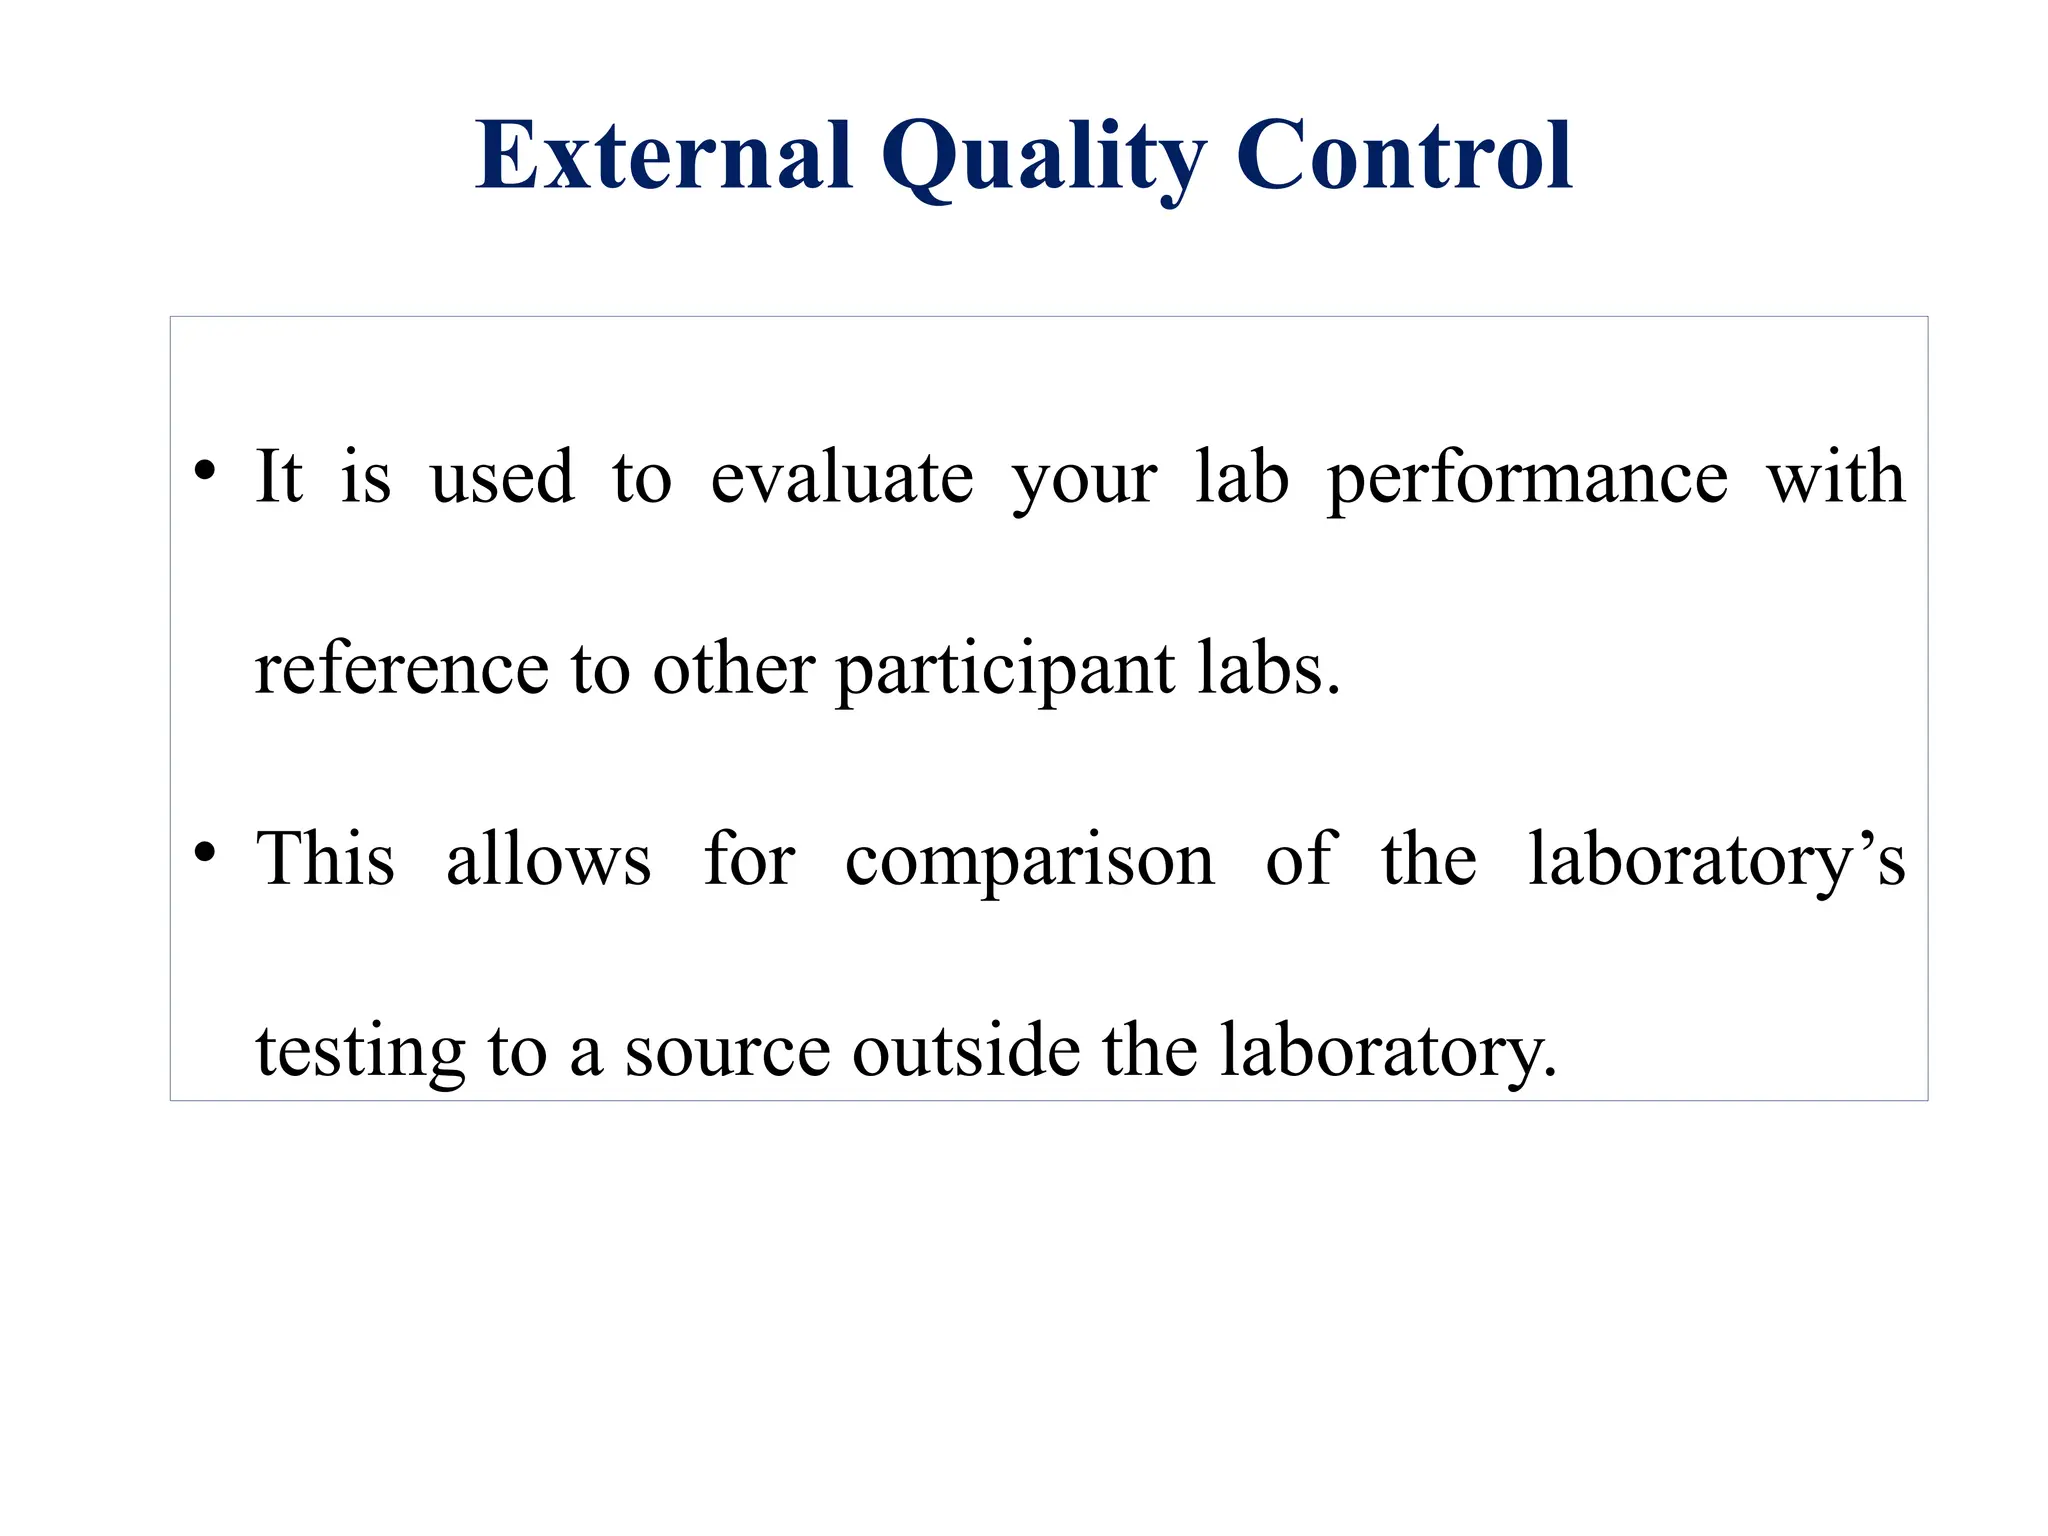
External Quality Control
•It is used to evaluate your lab performance with
reference to other participant labs.
• This allows for comparison of the laboratory’s
testing to a source outside the laboratory.
13.
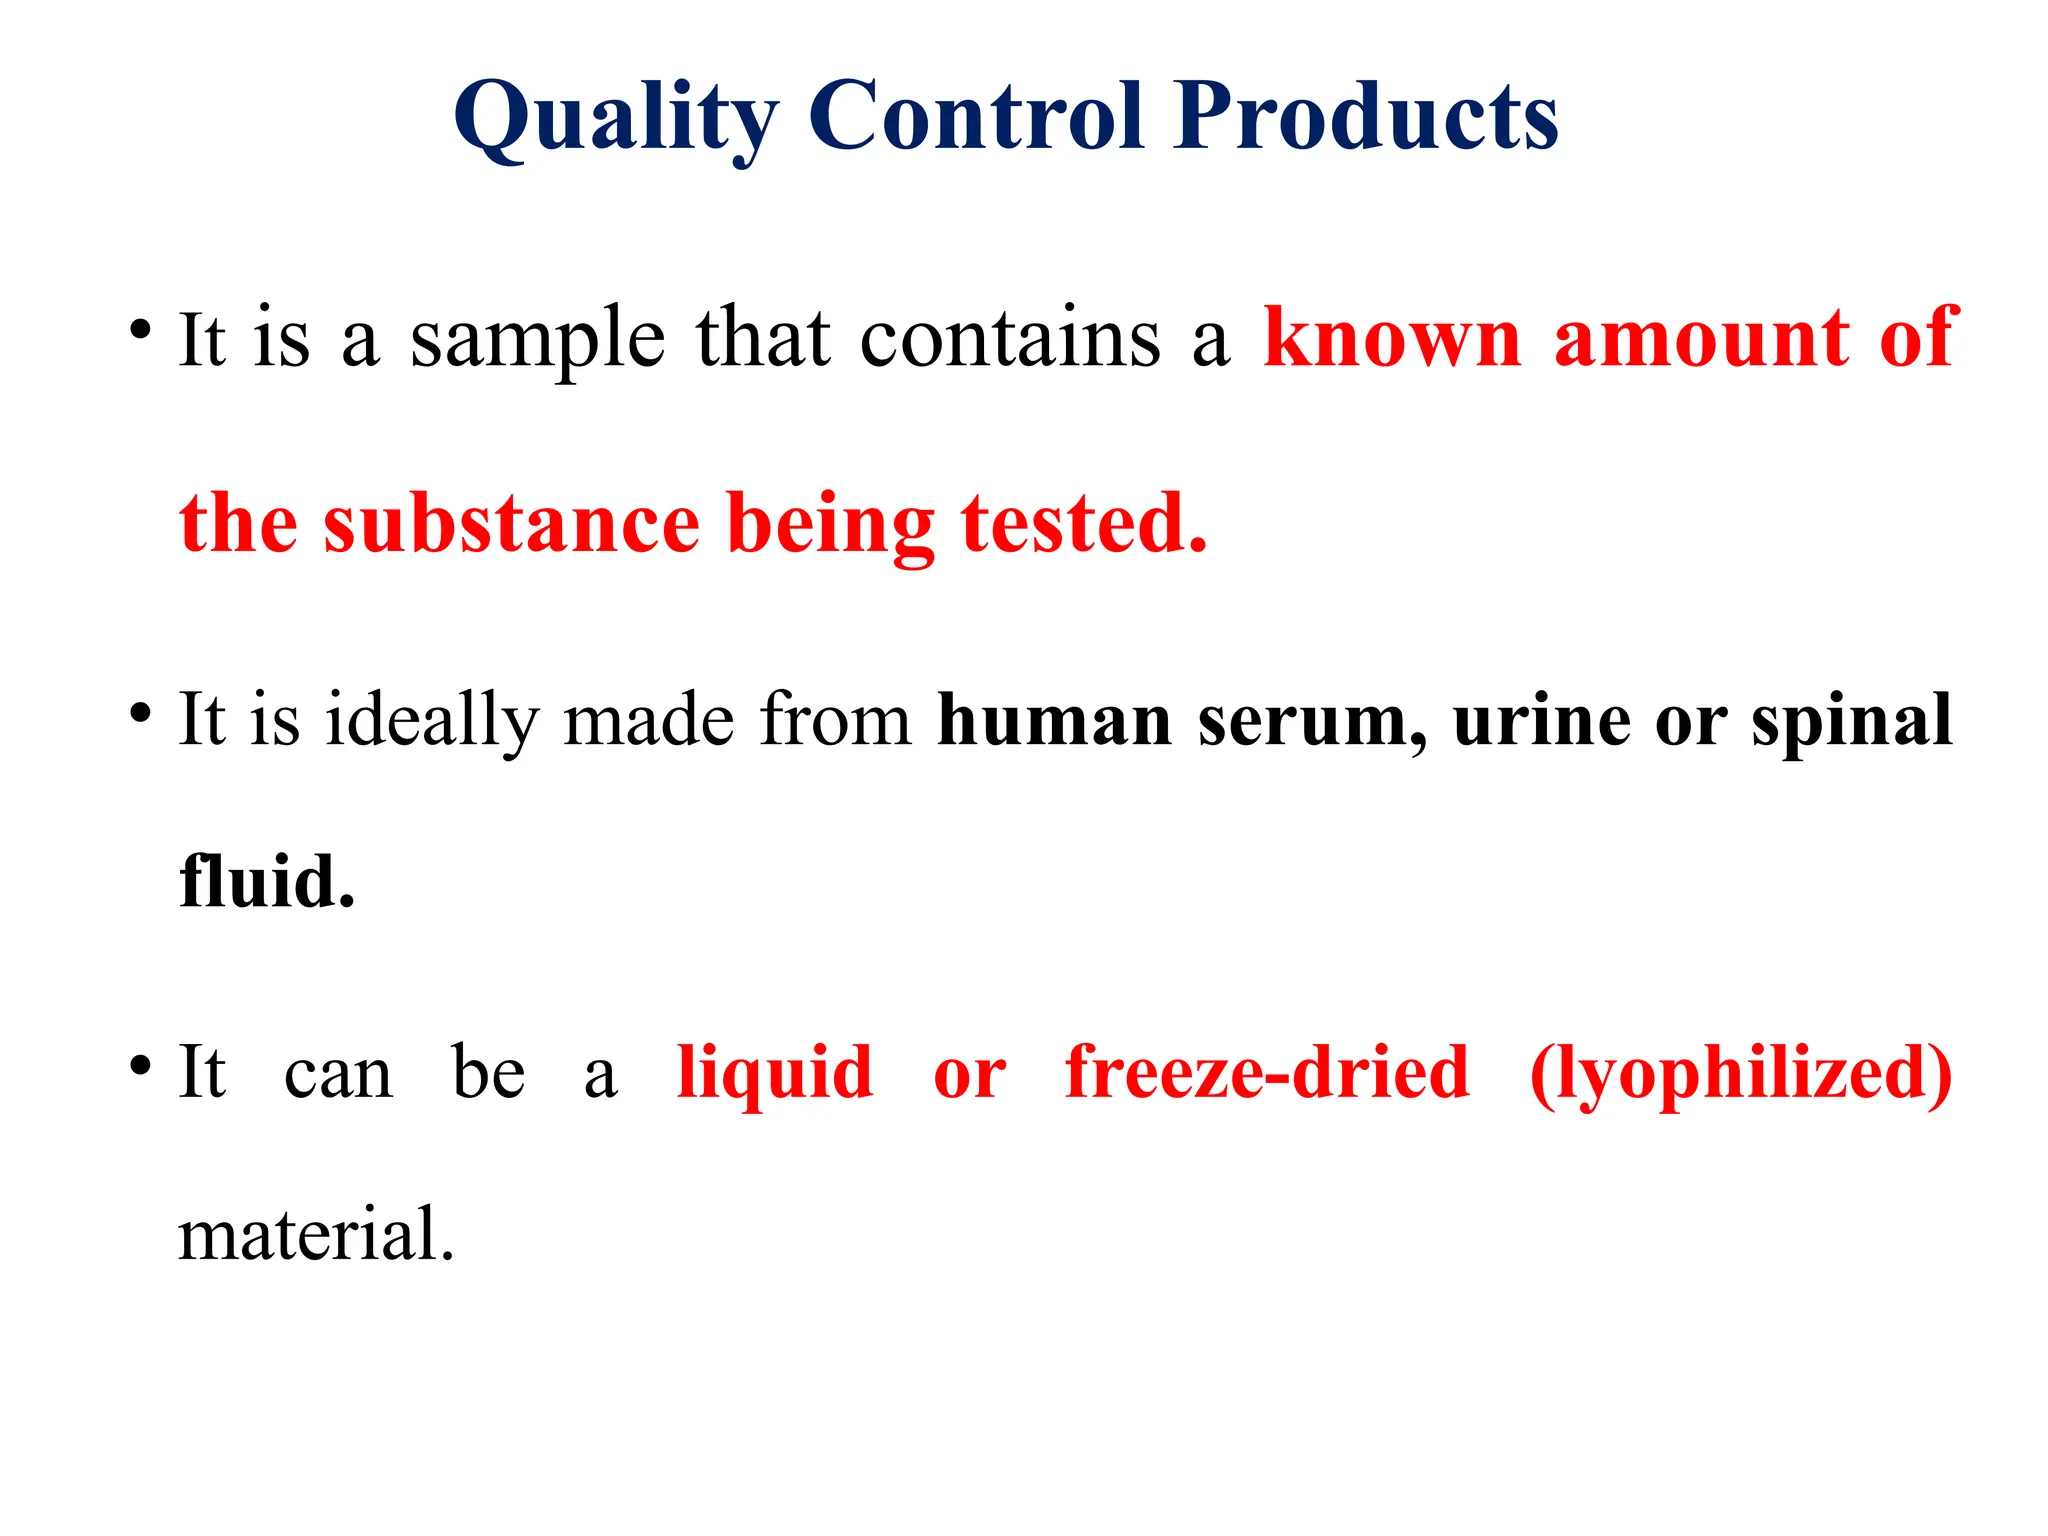
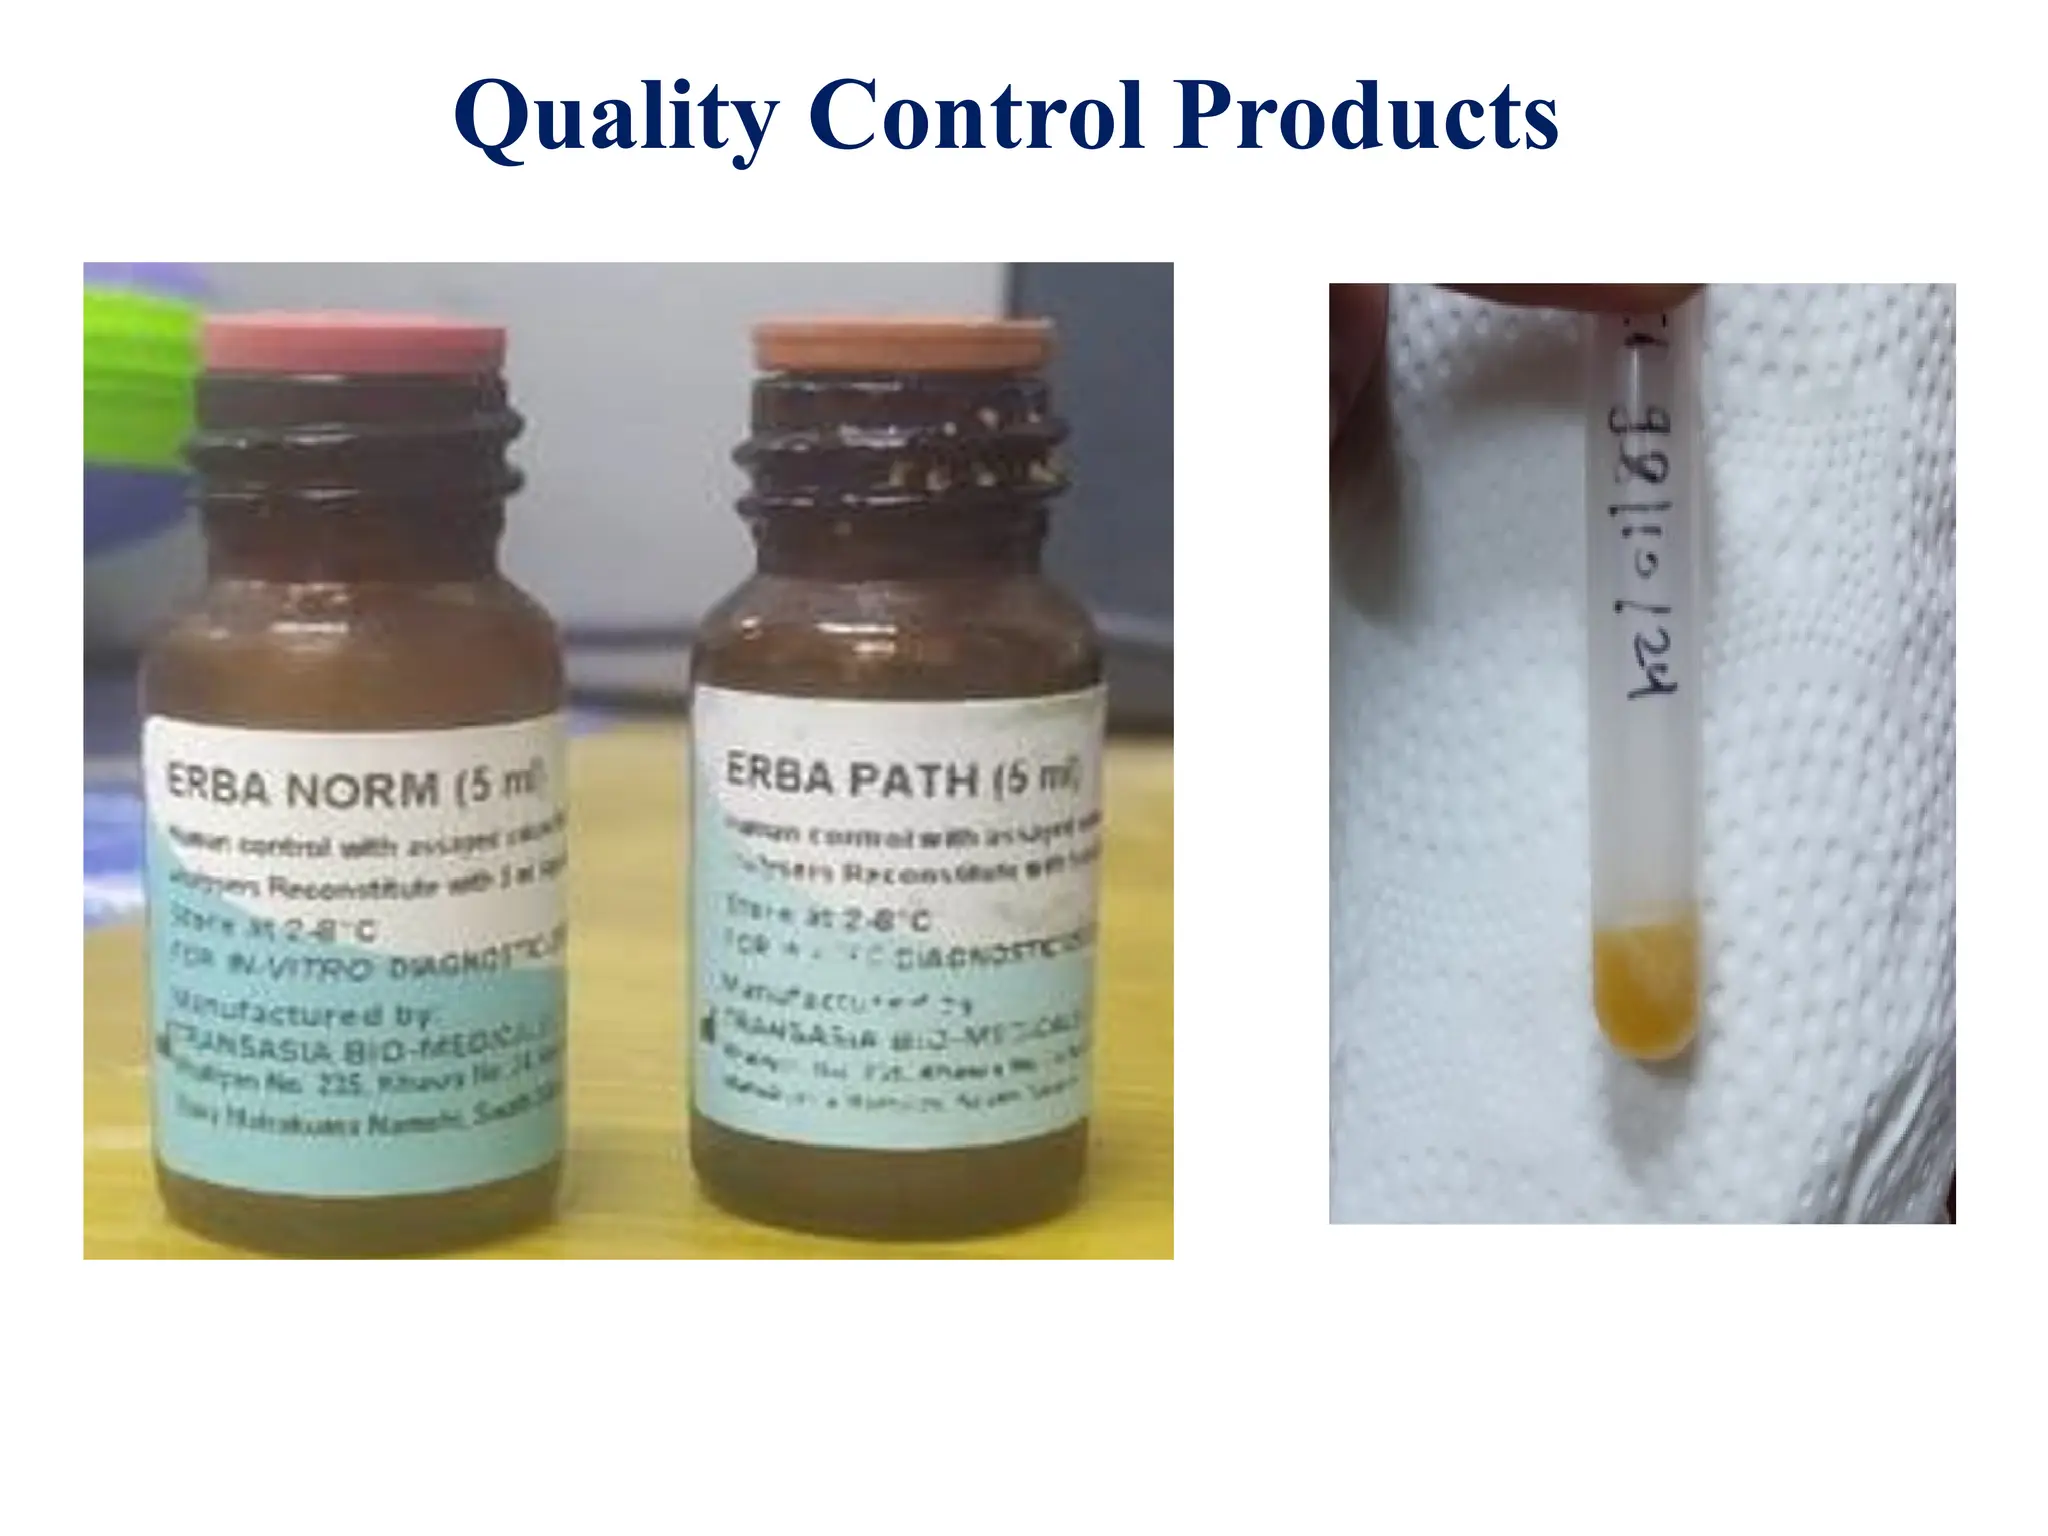
Quality Control Products
•It is a sample that contains a known amount of
the substance being tested.
• It is ideally made from human serum, urine or spinal
fluid.
• It can be a liquid or freeze-dried (lyophilized)
material.
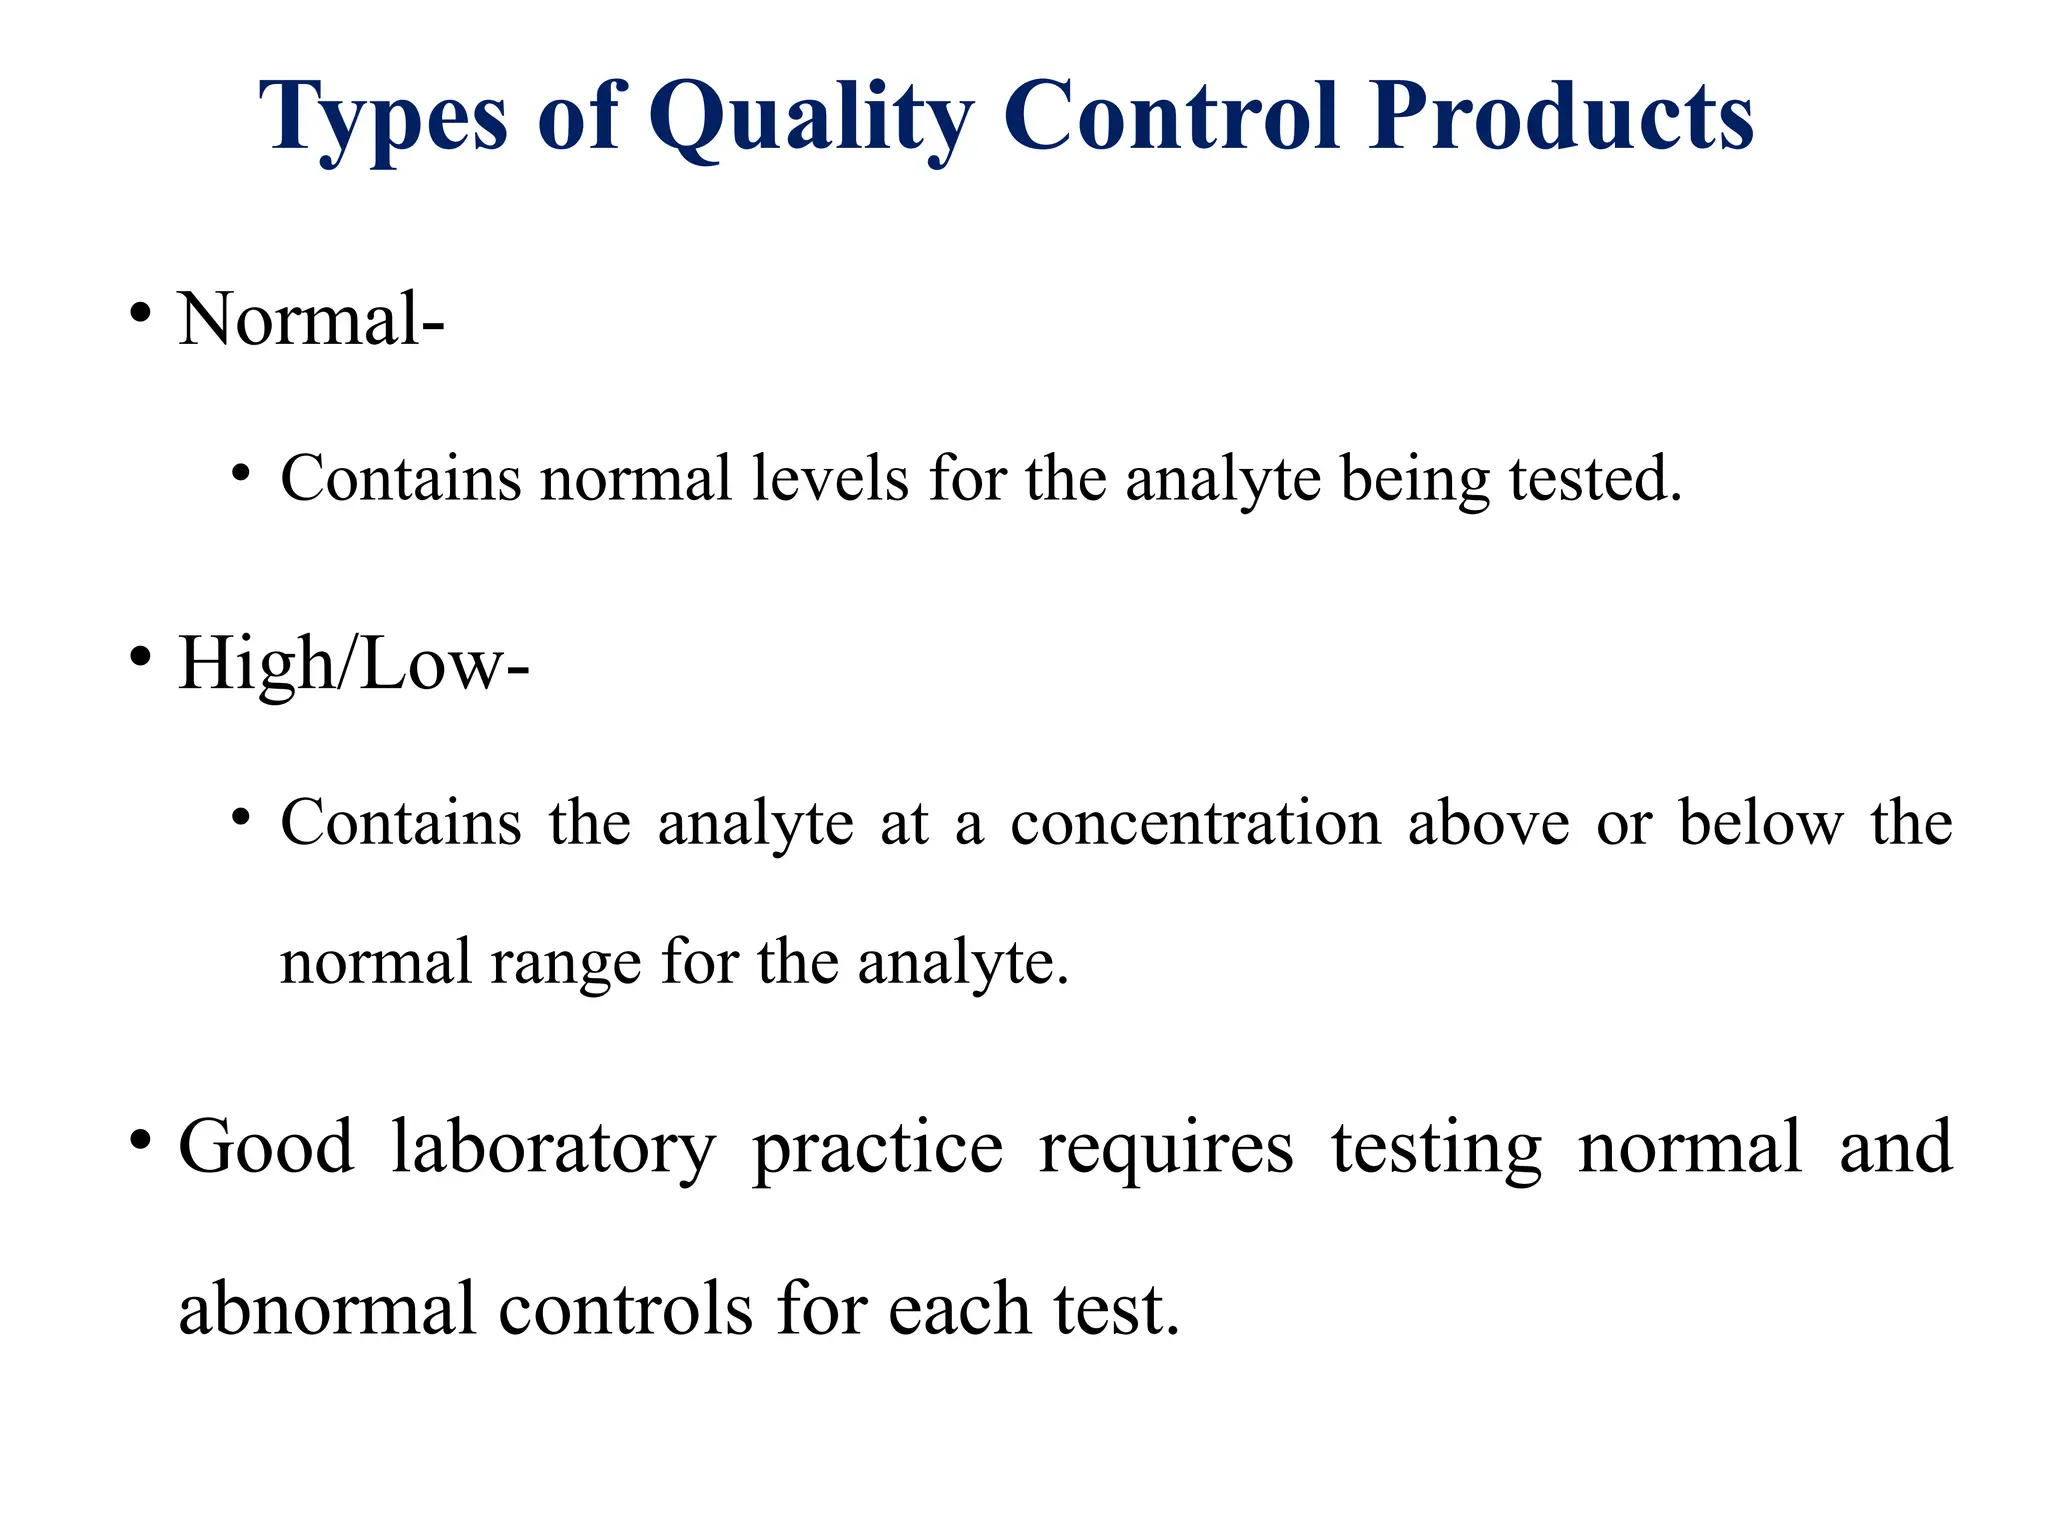
Types of QualityControl Products
• Normal-
• Contains normal levels for the analyte being tested.
• High/Low-
• Contains the analyte at a concentration above or below the
normal range for the analyte.
• Good laboratory practice requires testing normal and
abnormal controls for each test.
16.
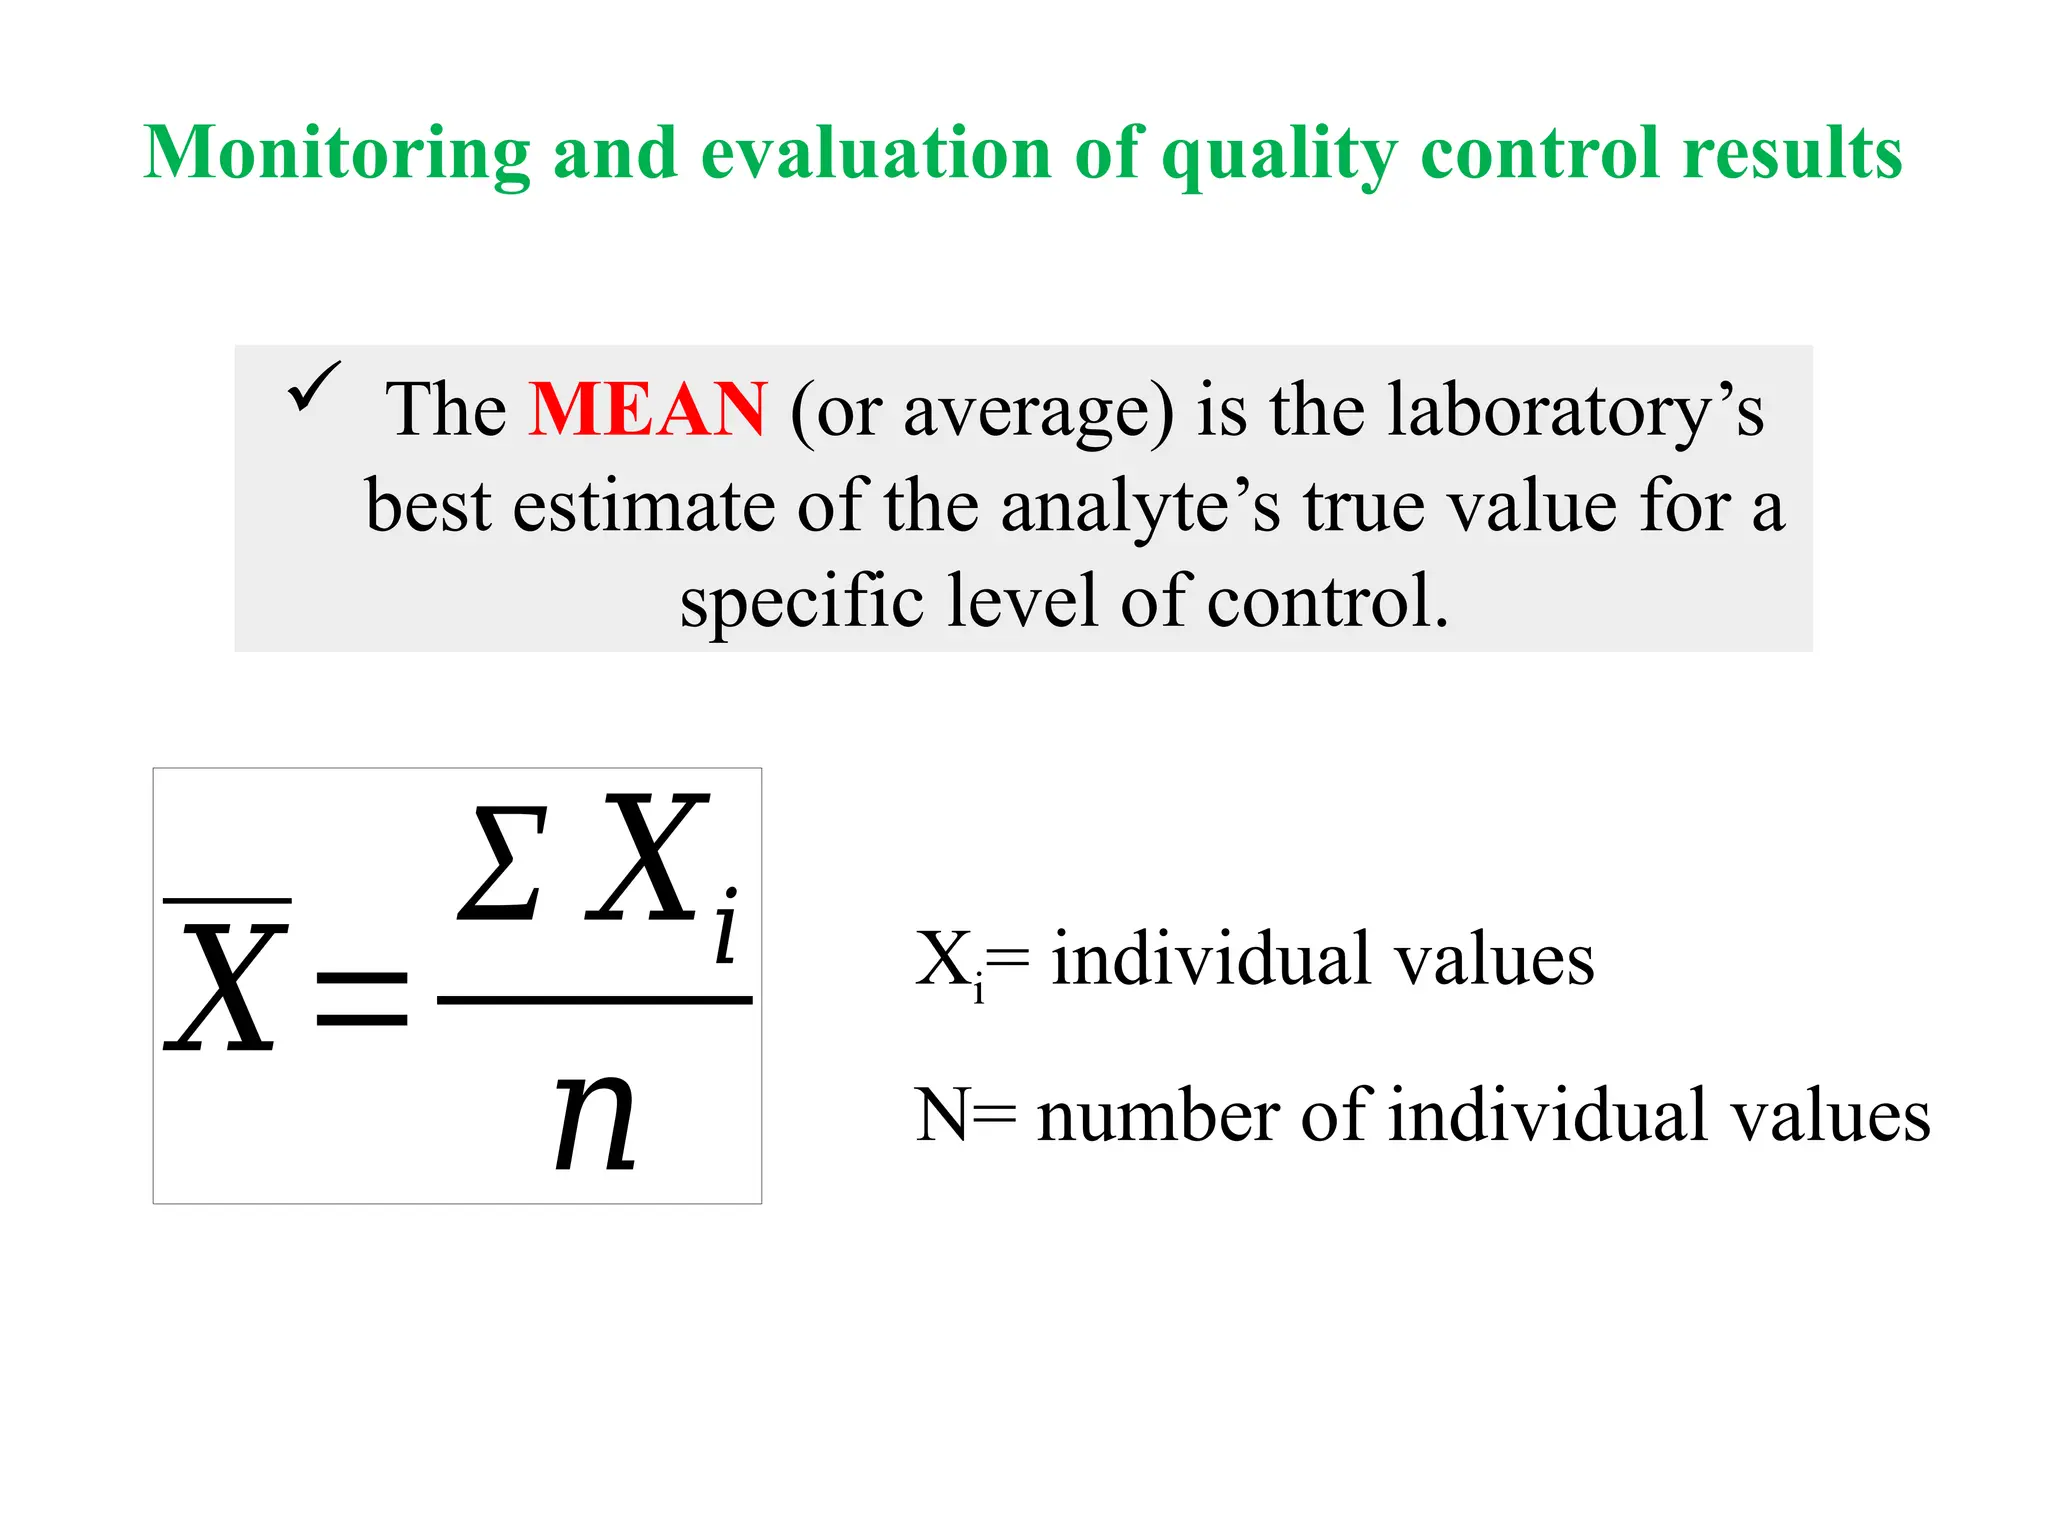
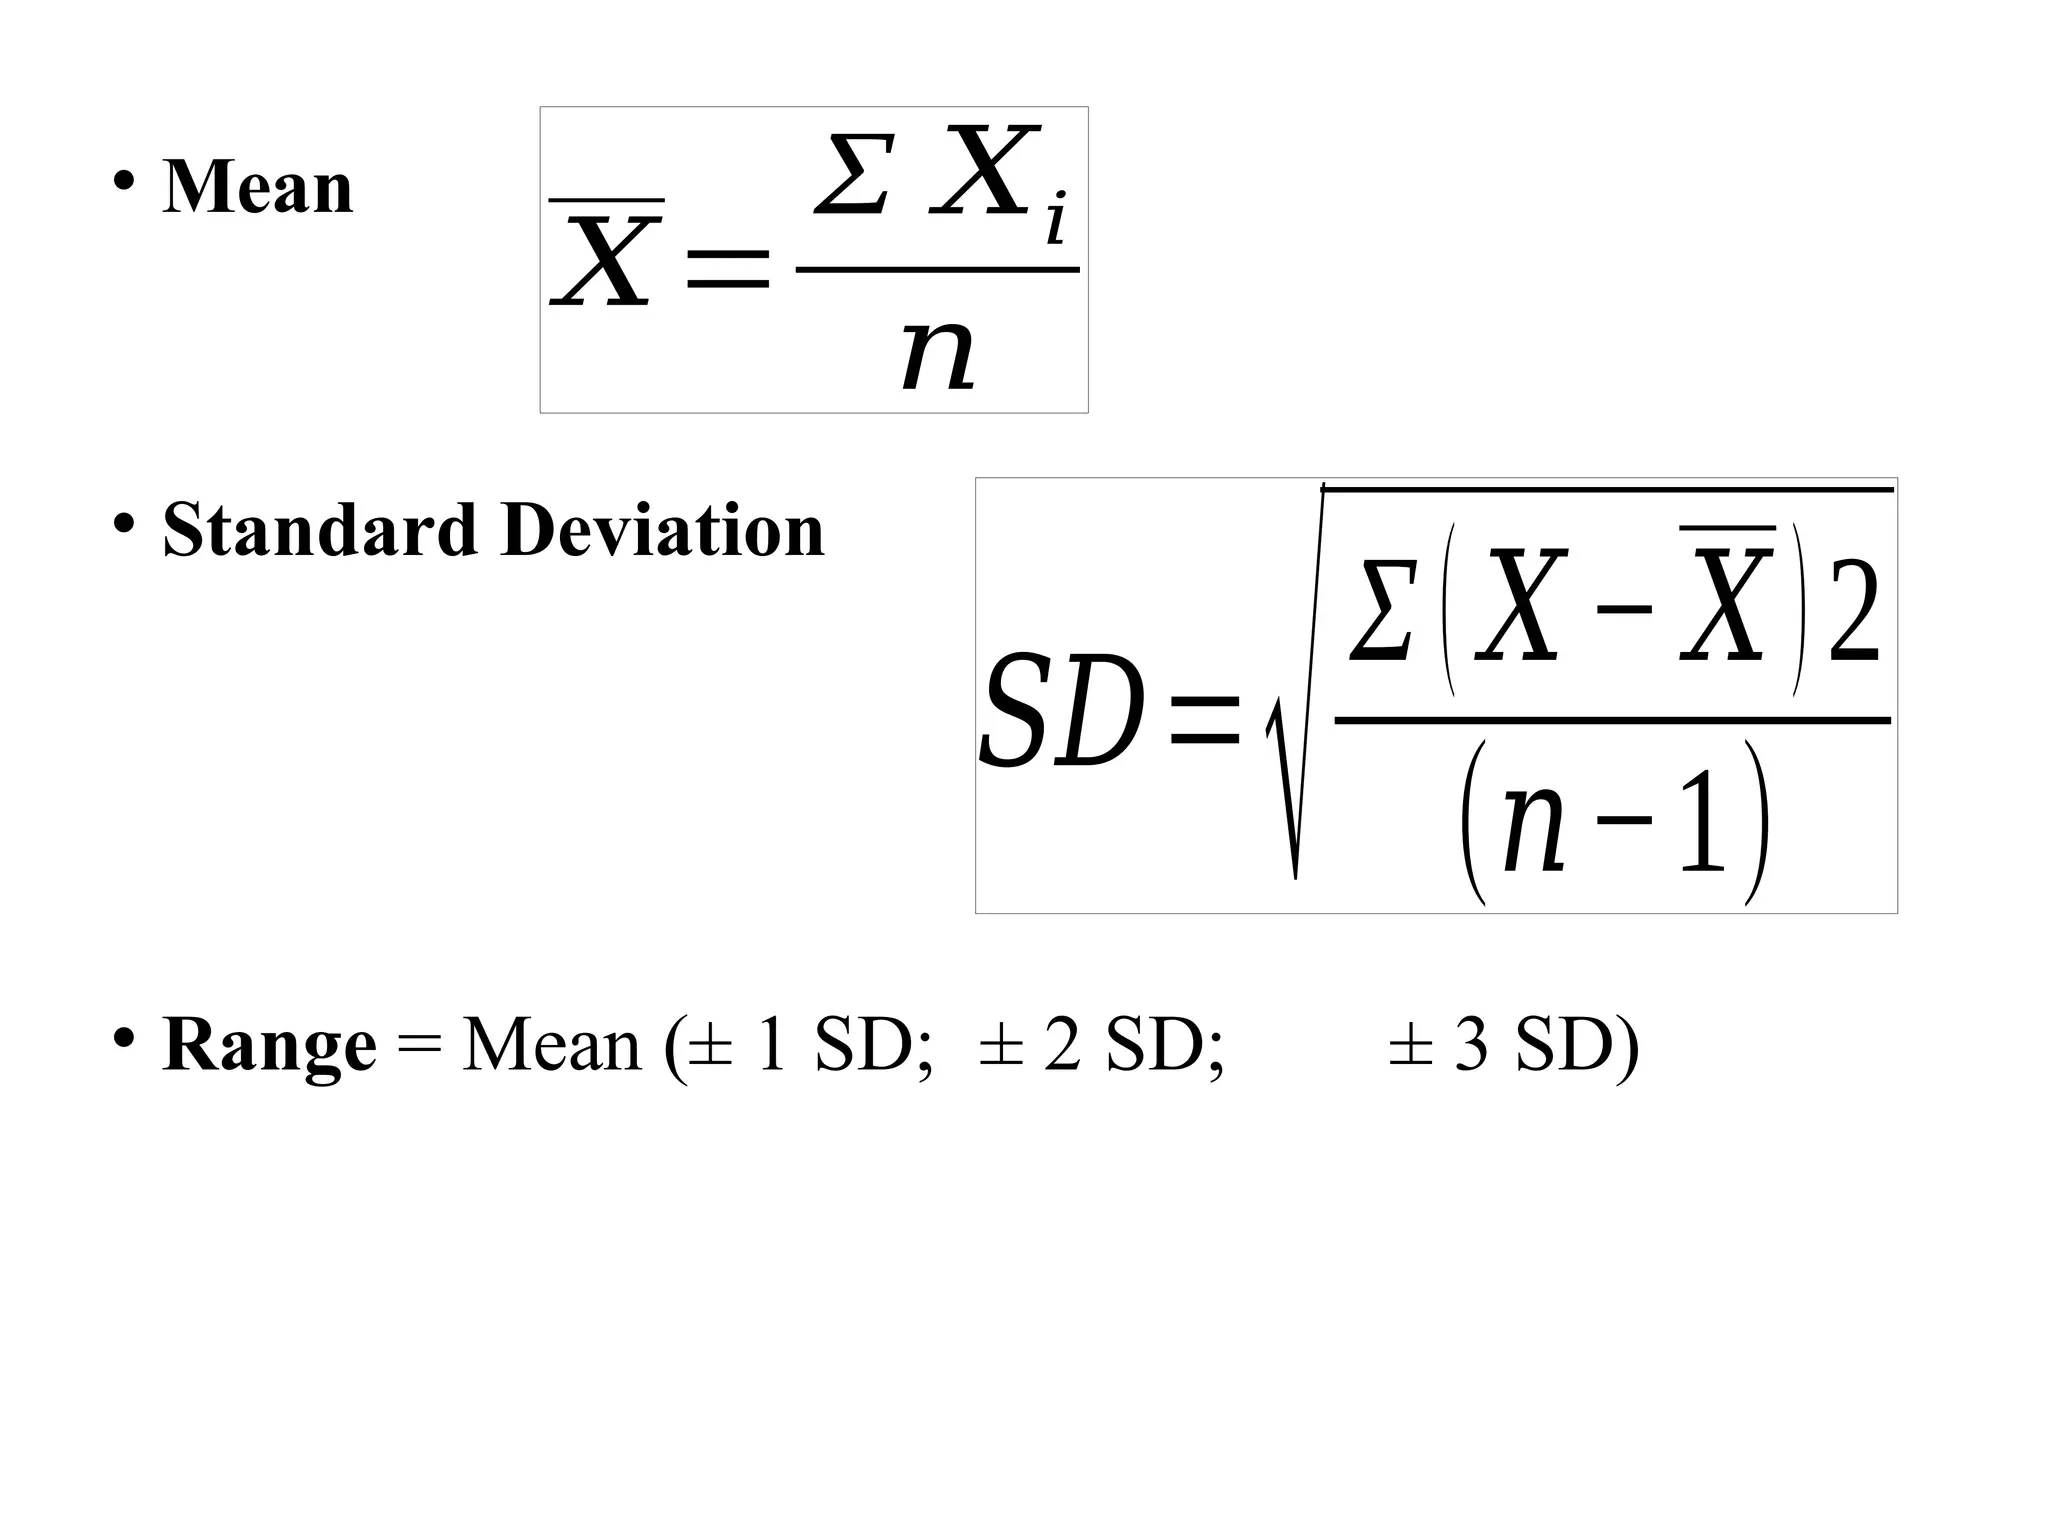
𝑋=
Σ 𝑋𝑖
𝑛
TheMEAN (or average) is the laboratory’s
best estimate of the analyte’s true value for a
specific level of control.
Xi= individual values
N= number of individual values
Monitoring and evaluation of quality control results
17.
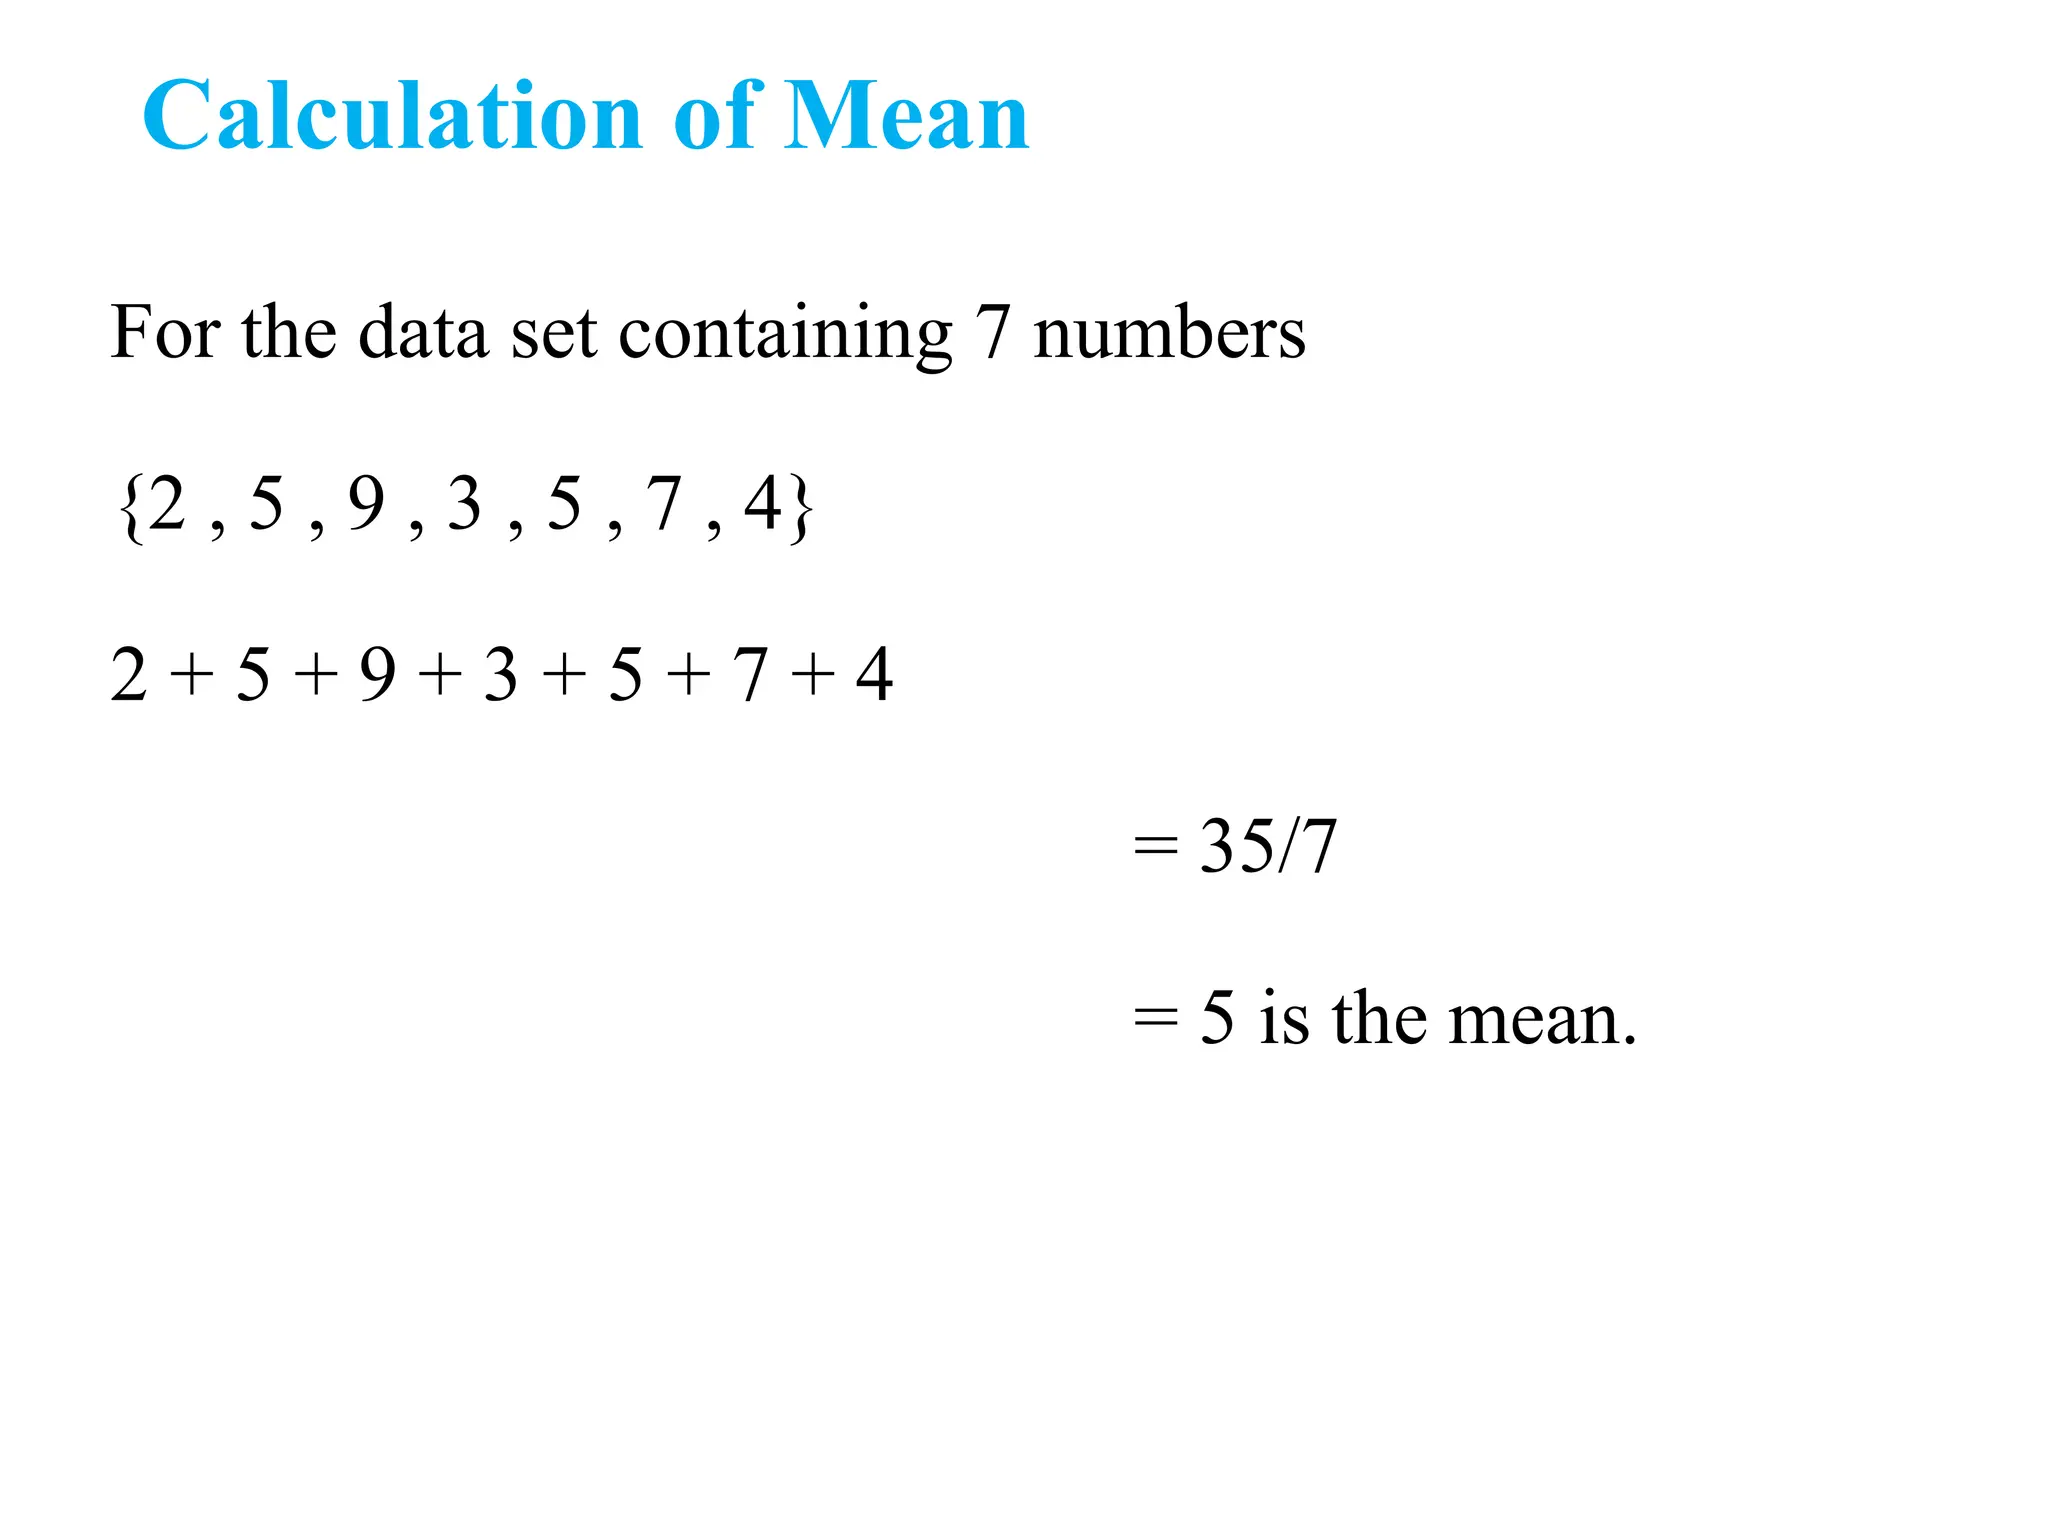
Calculation of Mean
Forthe data set containing 7 numbers
{2 , 5 , 9 , 3 , 5 , 7 , 4}
2 + 5 + 9 + 3 + 5 + 7 + 4
= 35/7
= 5 is the mean.
18.
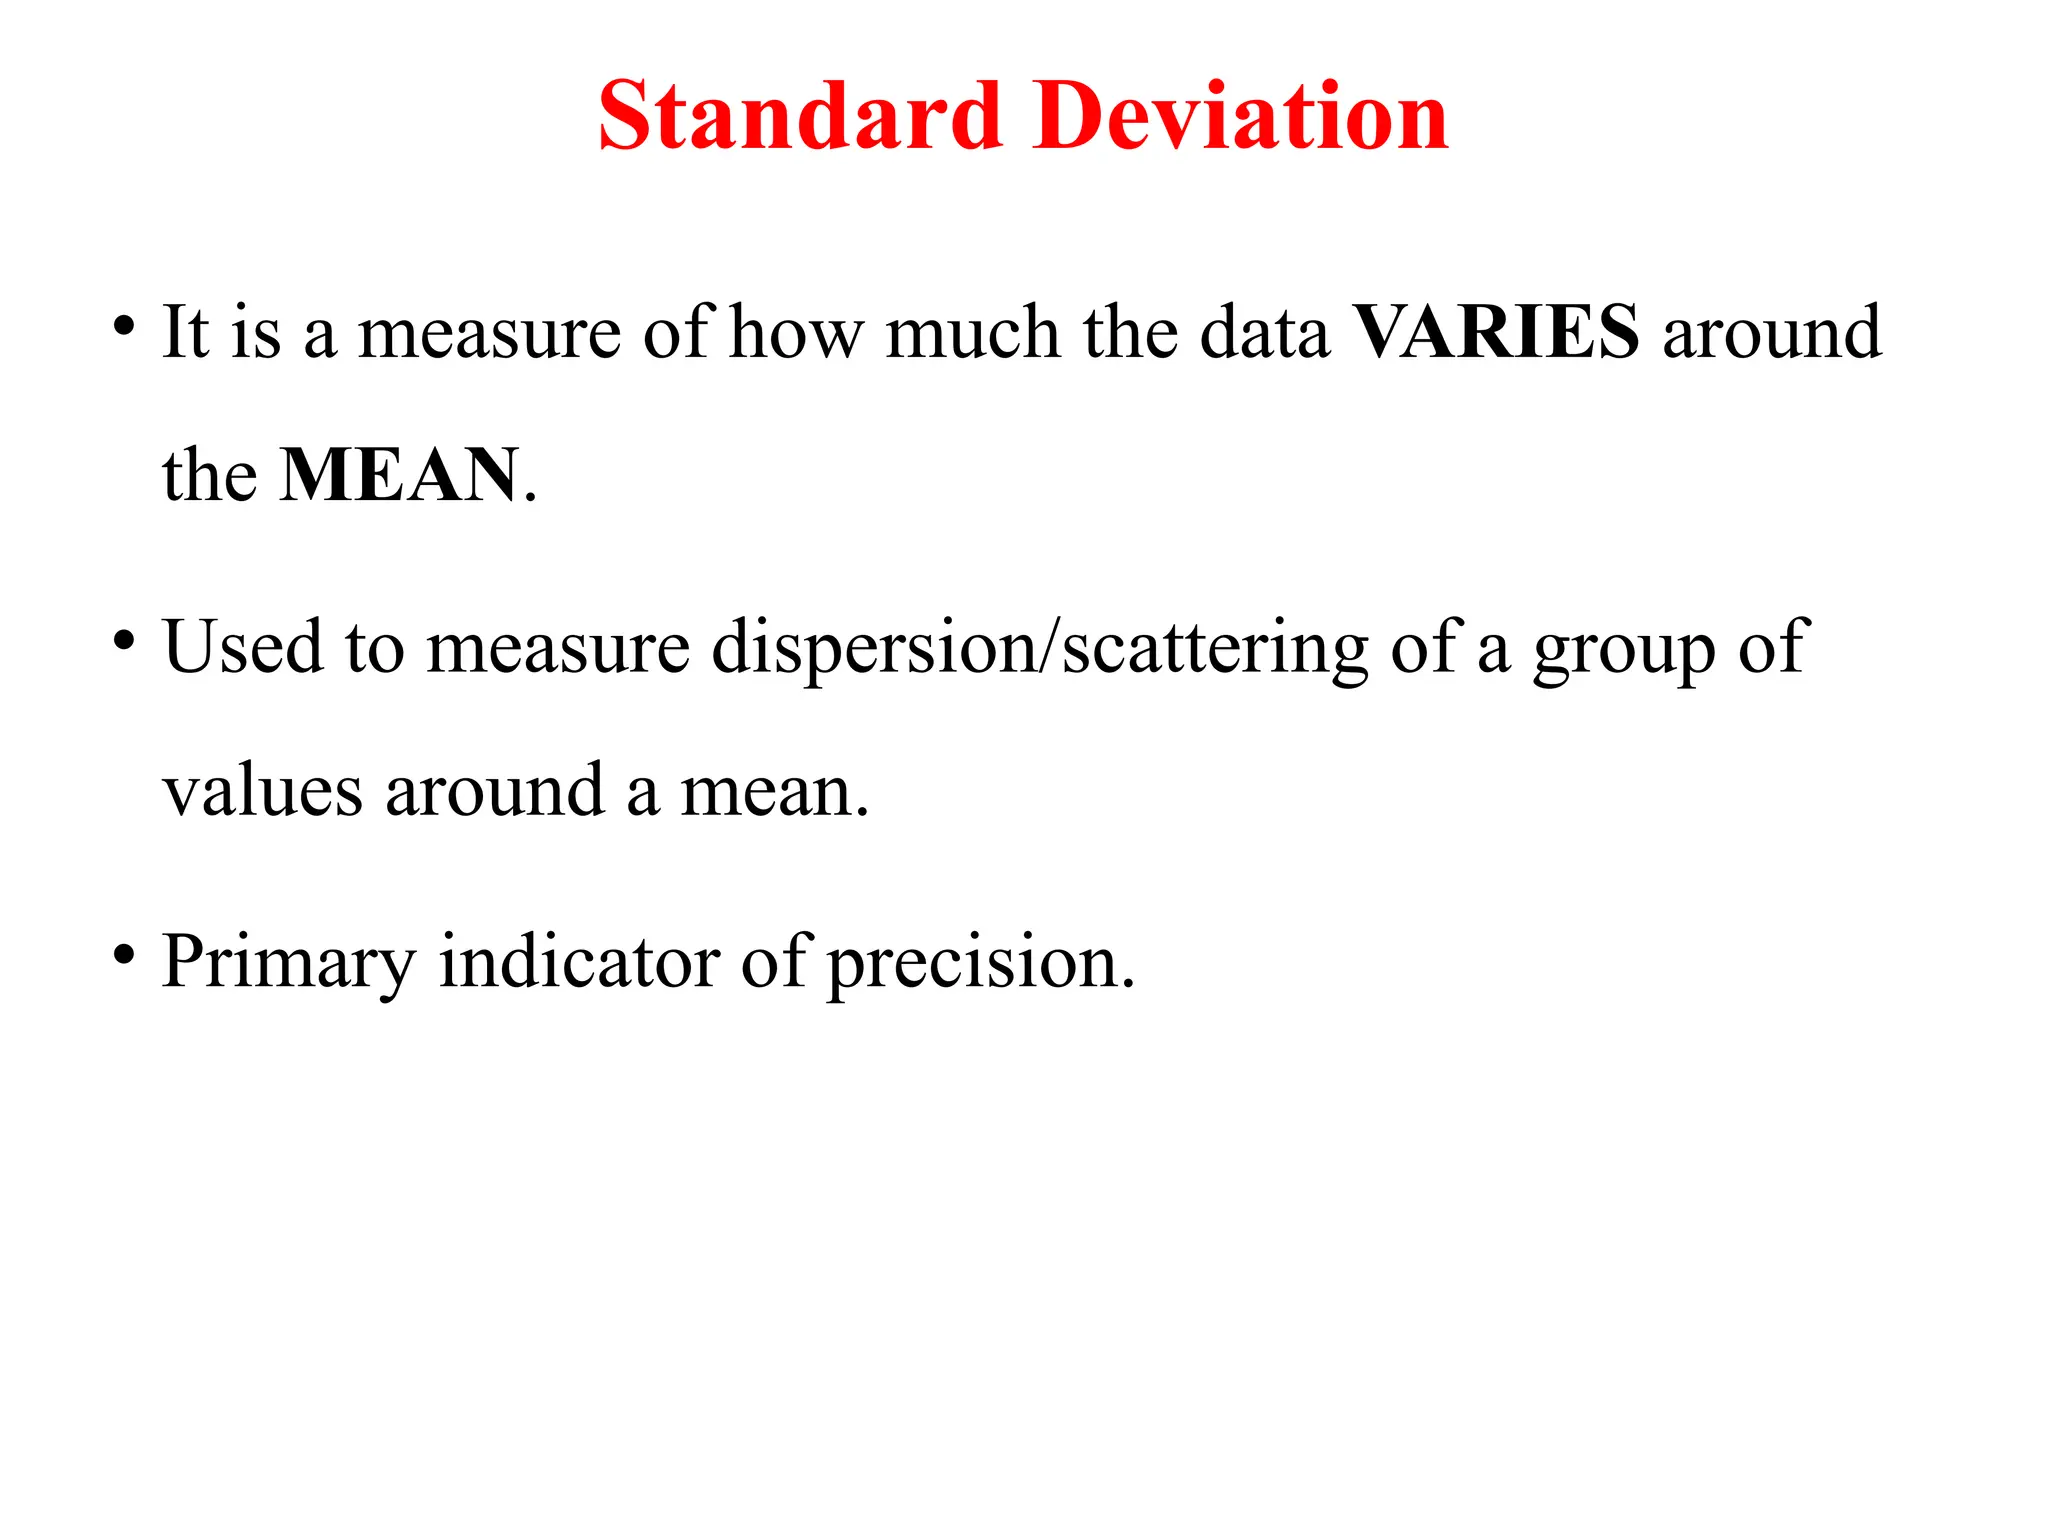
Standard Deviation
• Itis a measure of how much the data VARIES around
the MEAN.
• Used to measure dispersion/scattering of a group of
values around a mean.
• Primary indicator of precision.
19.
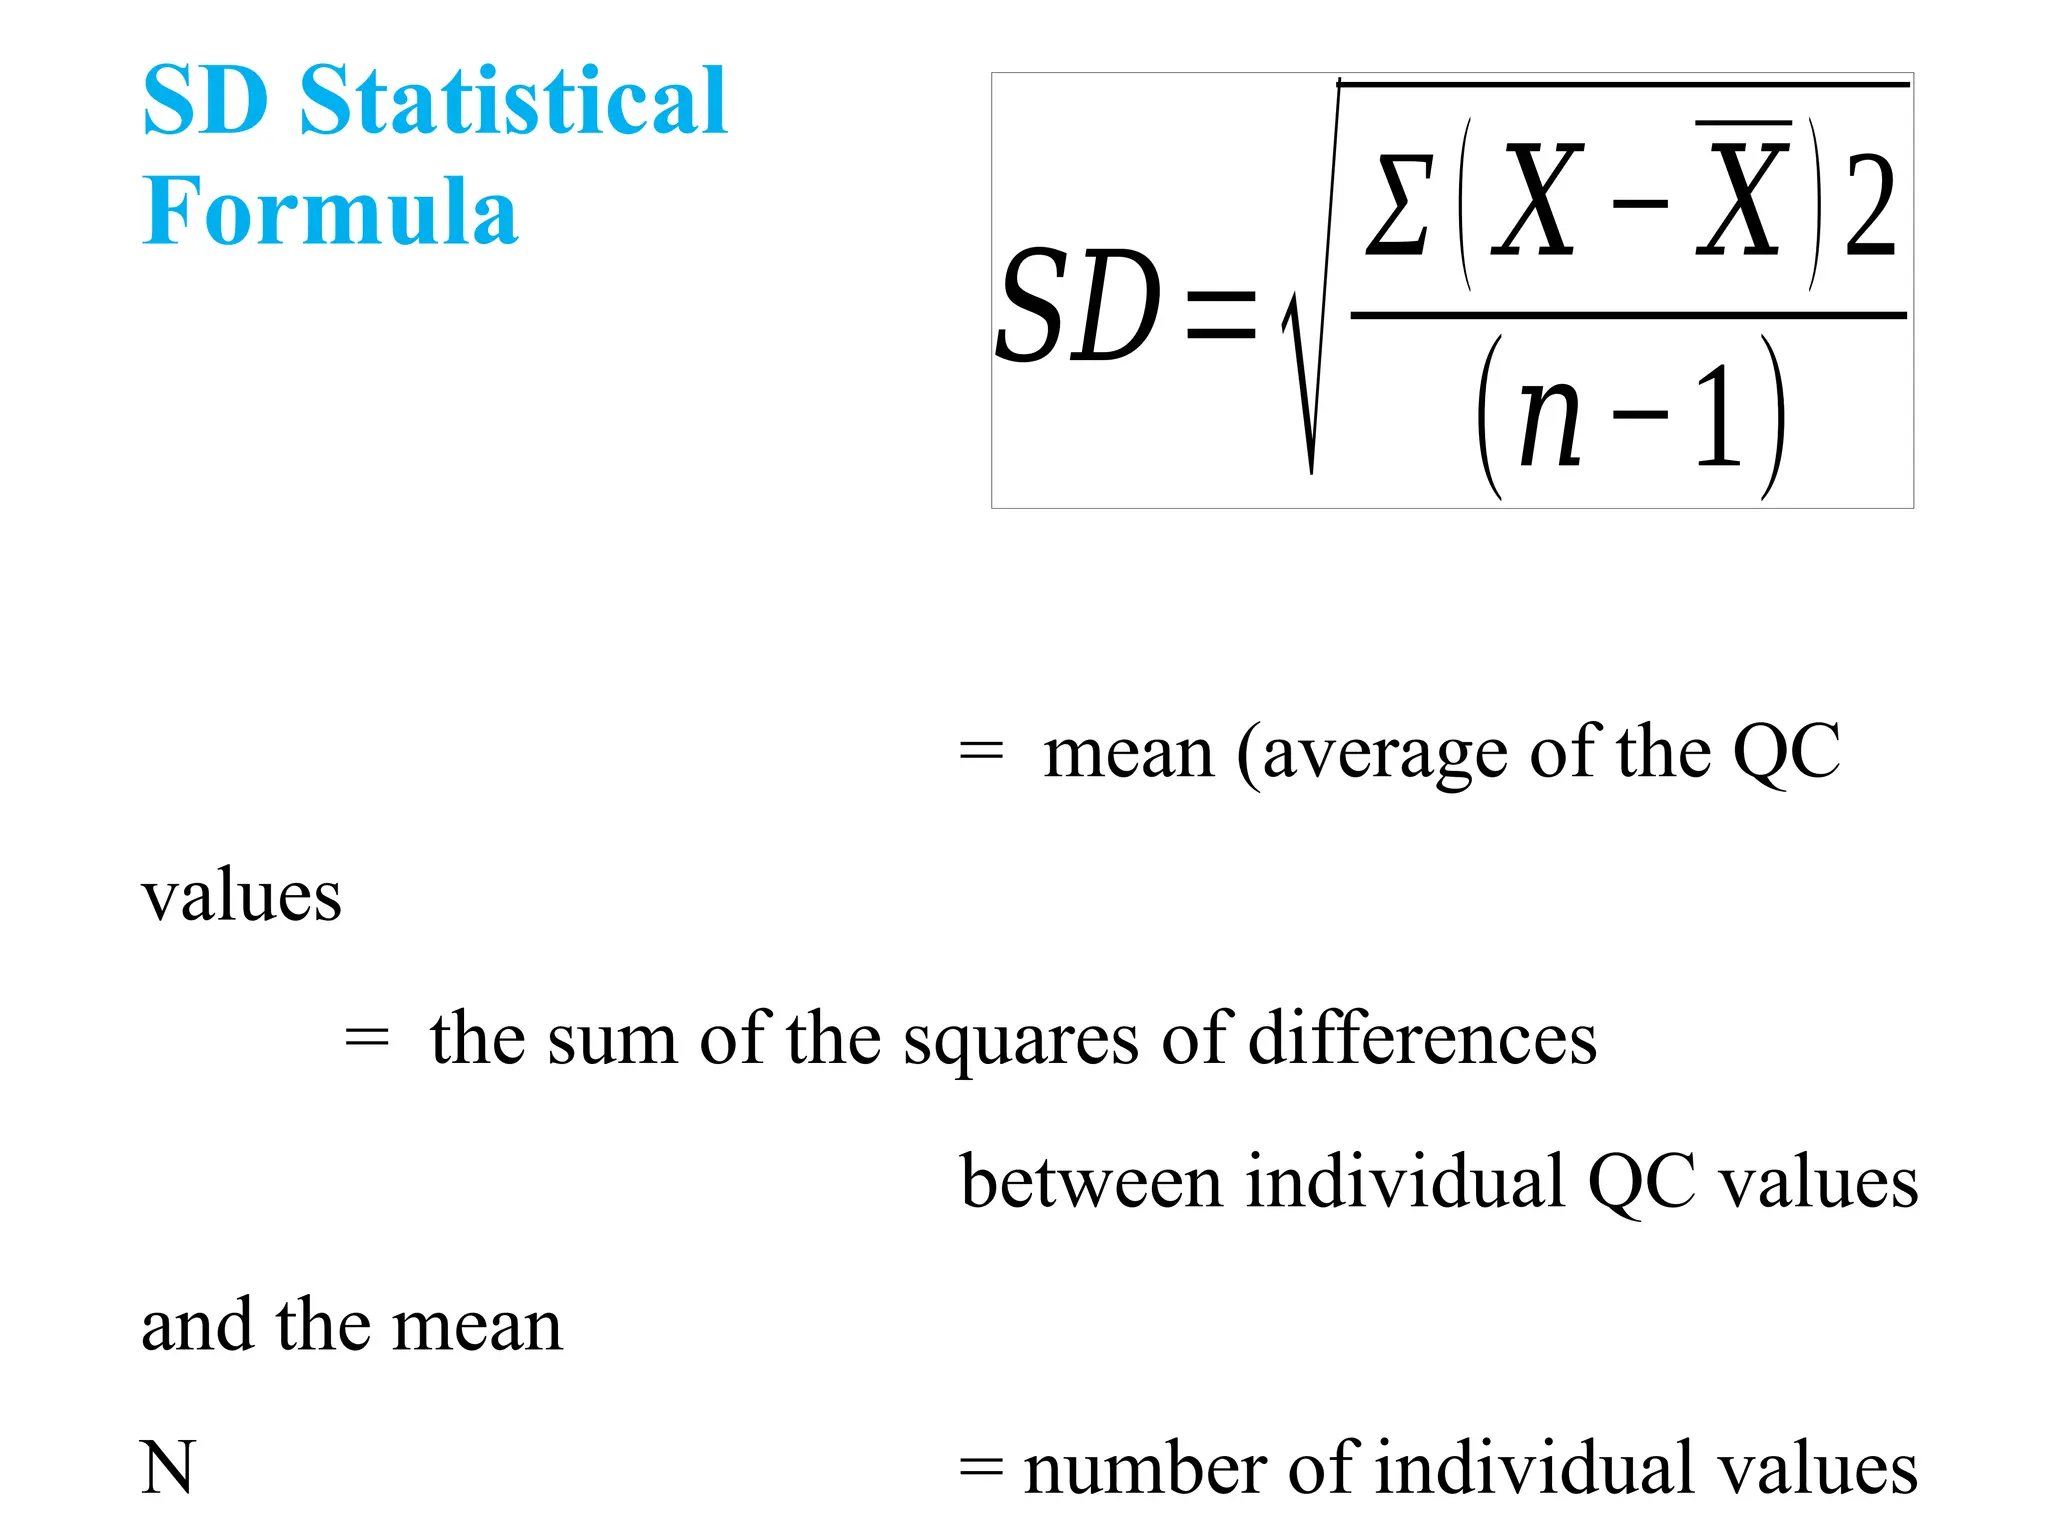
SD Statistical
Formula
𝑆𝐷=
√Σ(𝑋− 𝑋)2
(𝑛−1)
=mean (average of the QC
values
= the sum of the squares of differences
between individual QC values
and the mean
N = number of individual values
20.
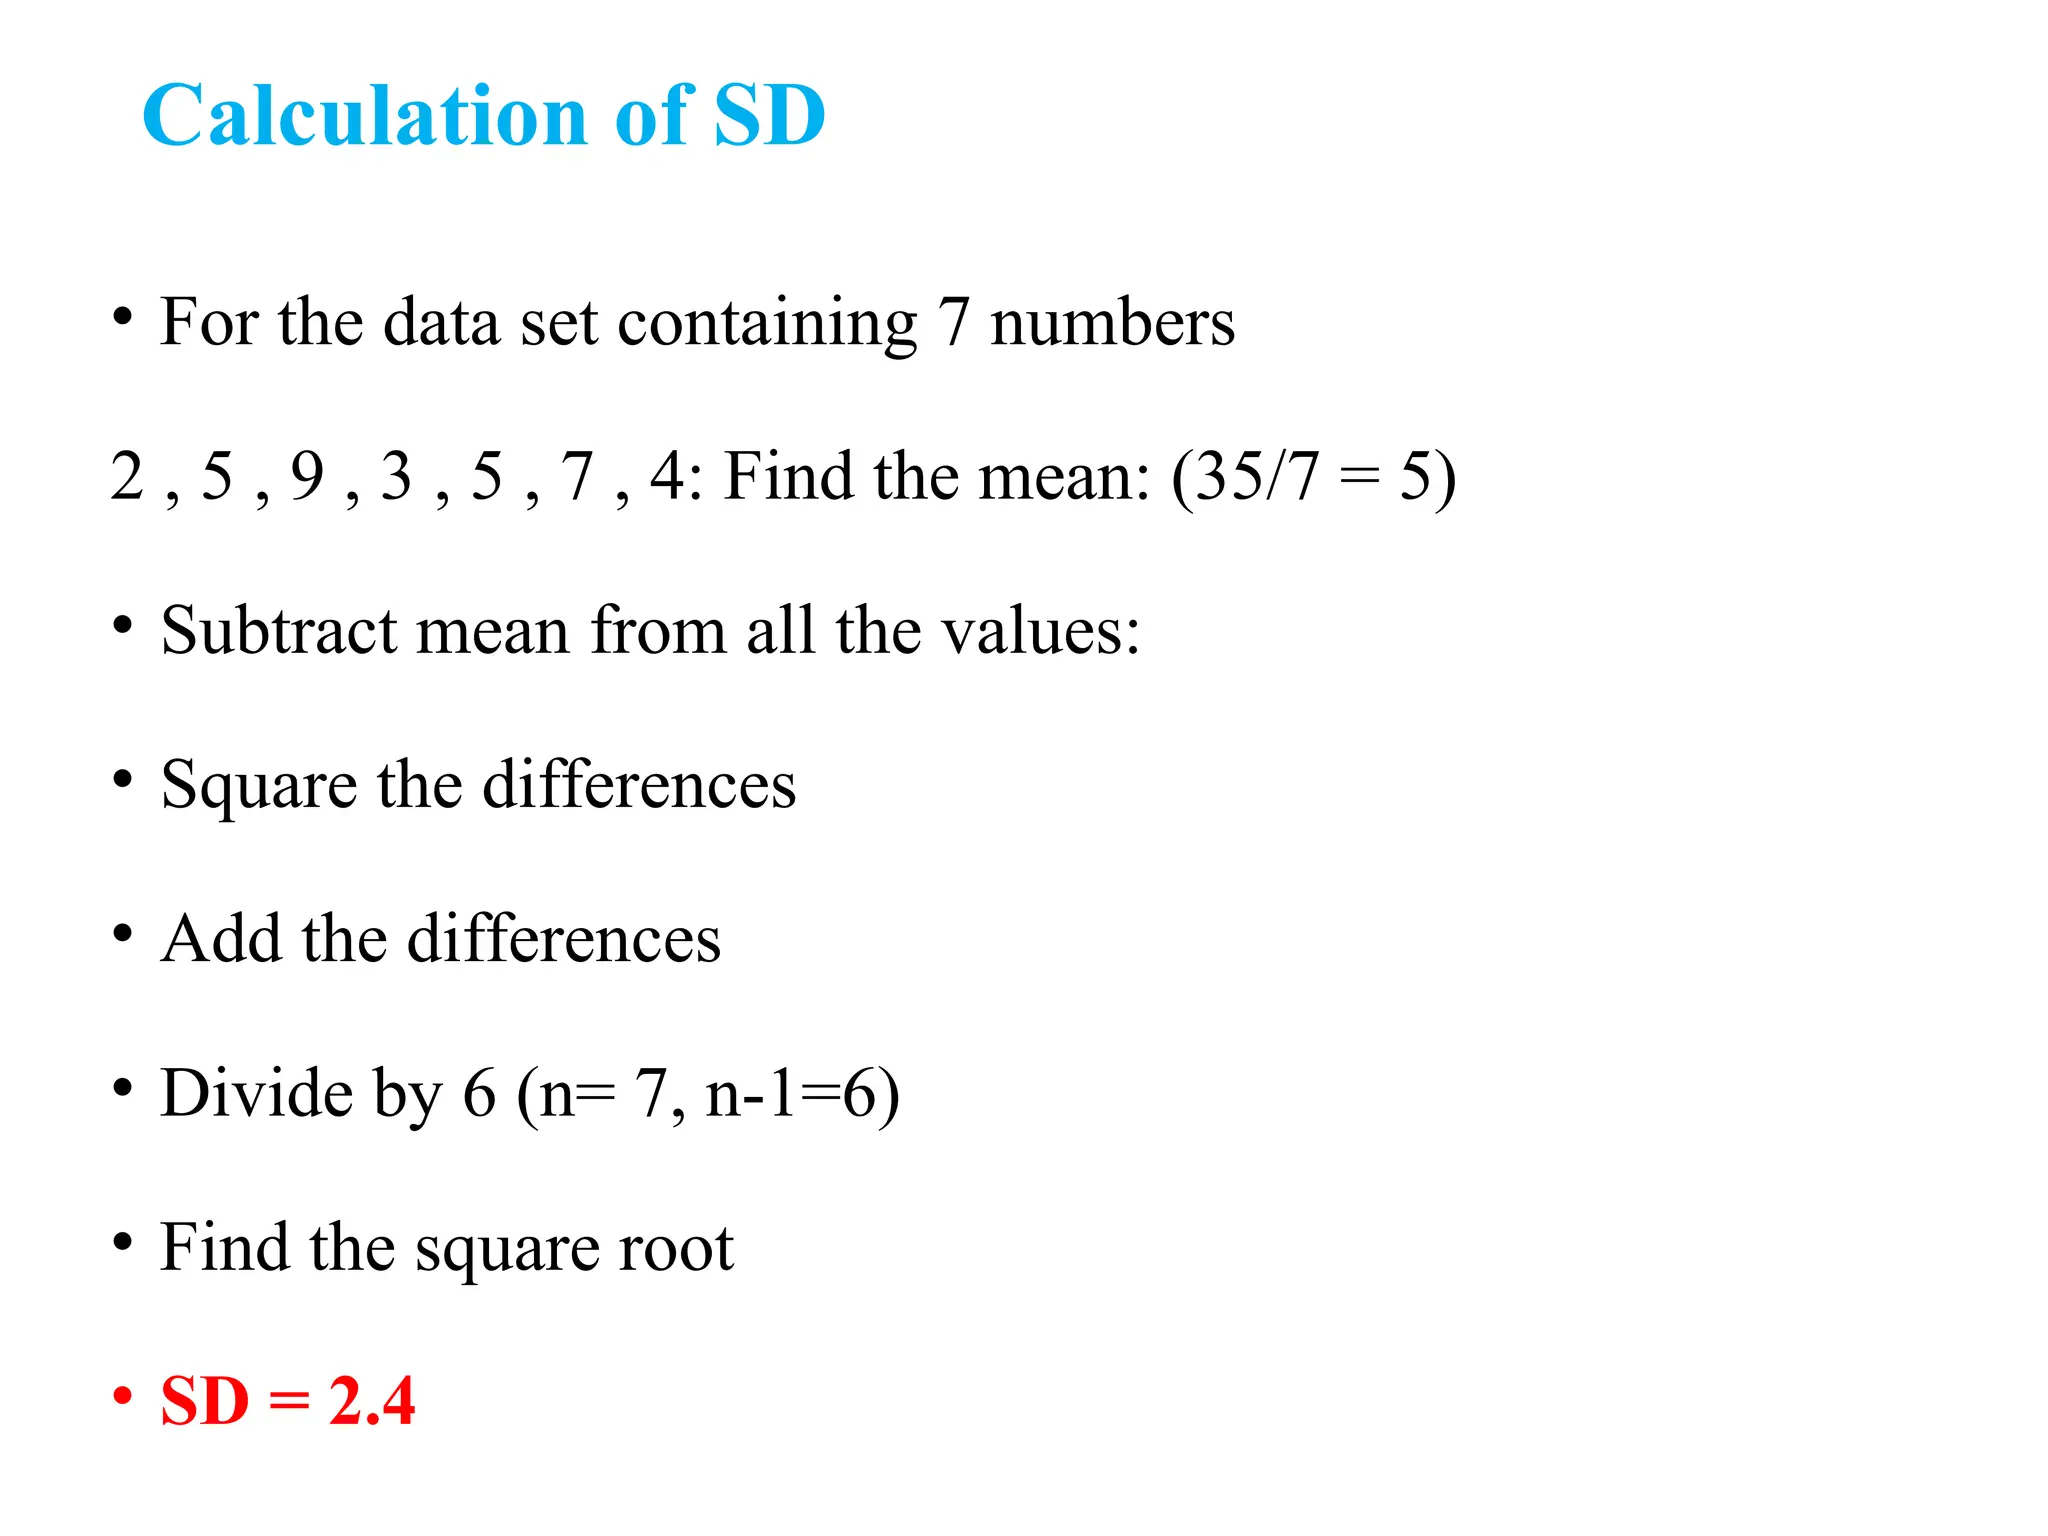
Calculation of SD
•For the data set containing 7 numbers
2 , 5 , 9 , 3 , 5 , 7 , 4: Find the mean: (35/7 = 5)
• Subtract mean from all the values:
• Square the differences
• Add the differences
• Divide by 6 (n= 7, n-1=6)
• Find the square root
• SD = 2.4
21.
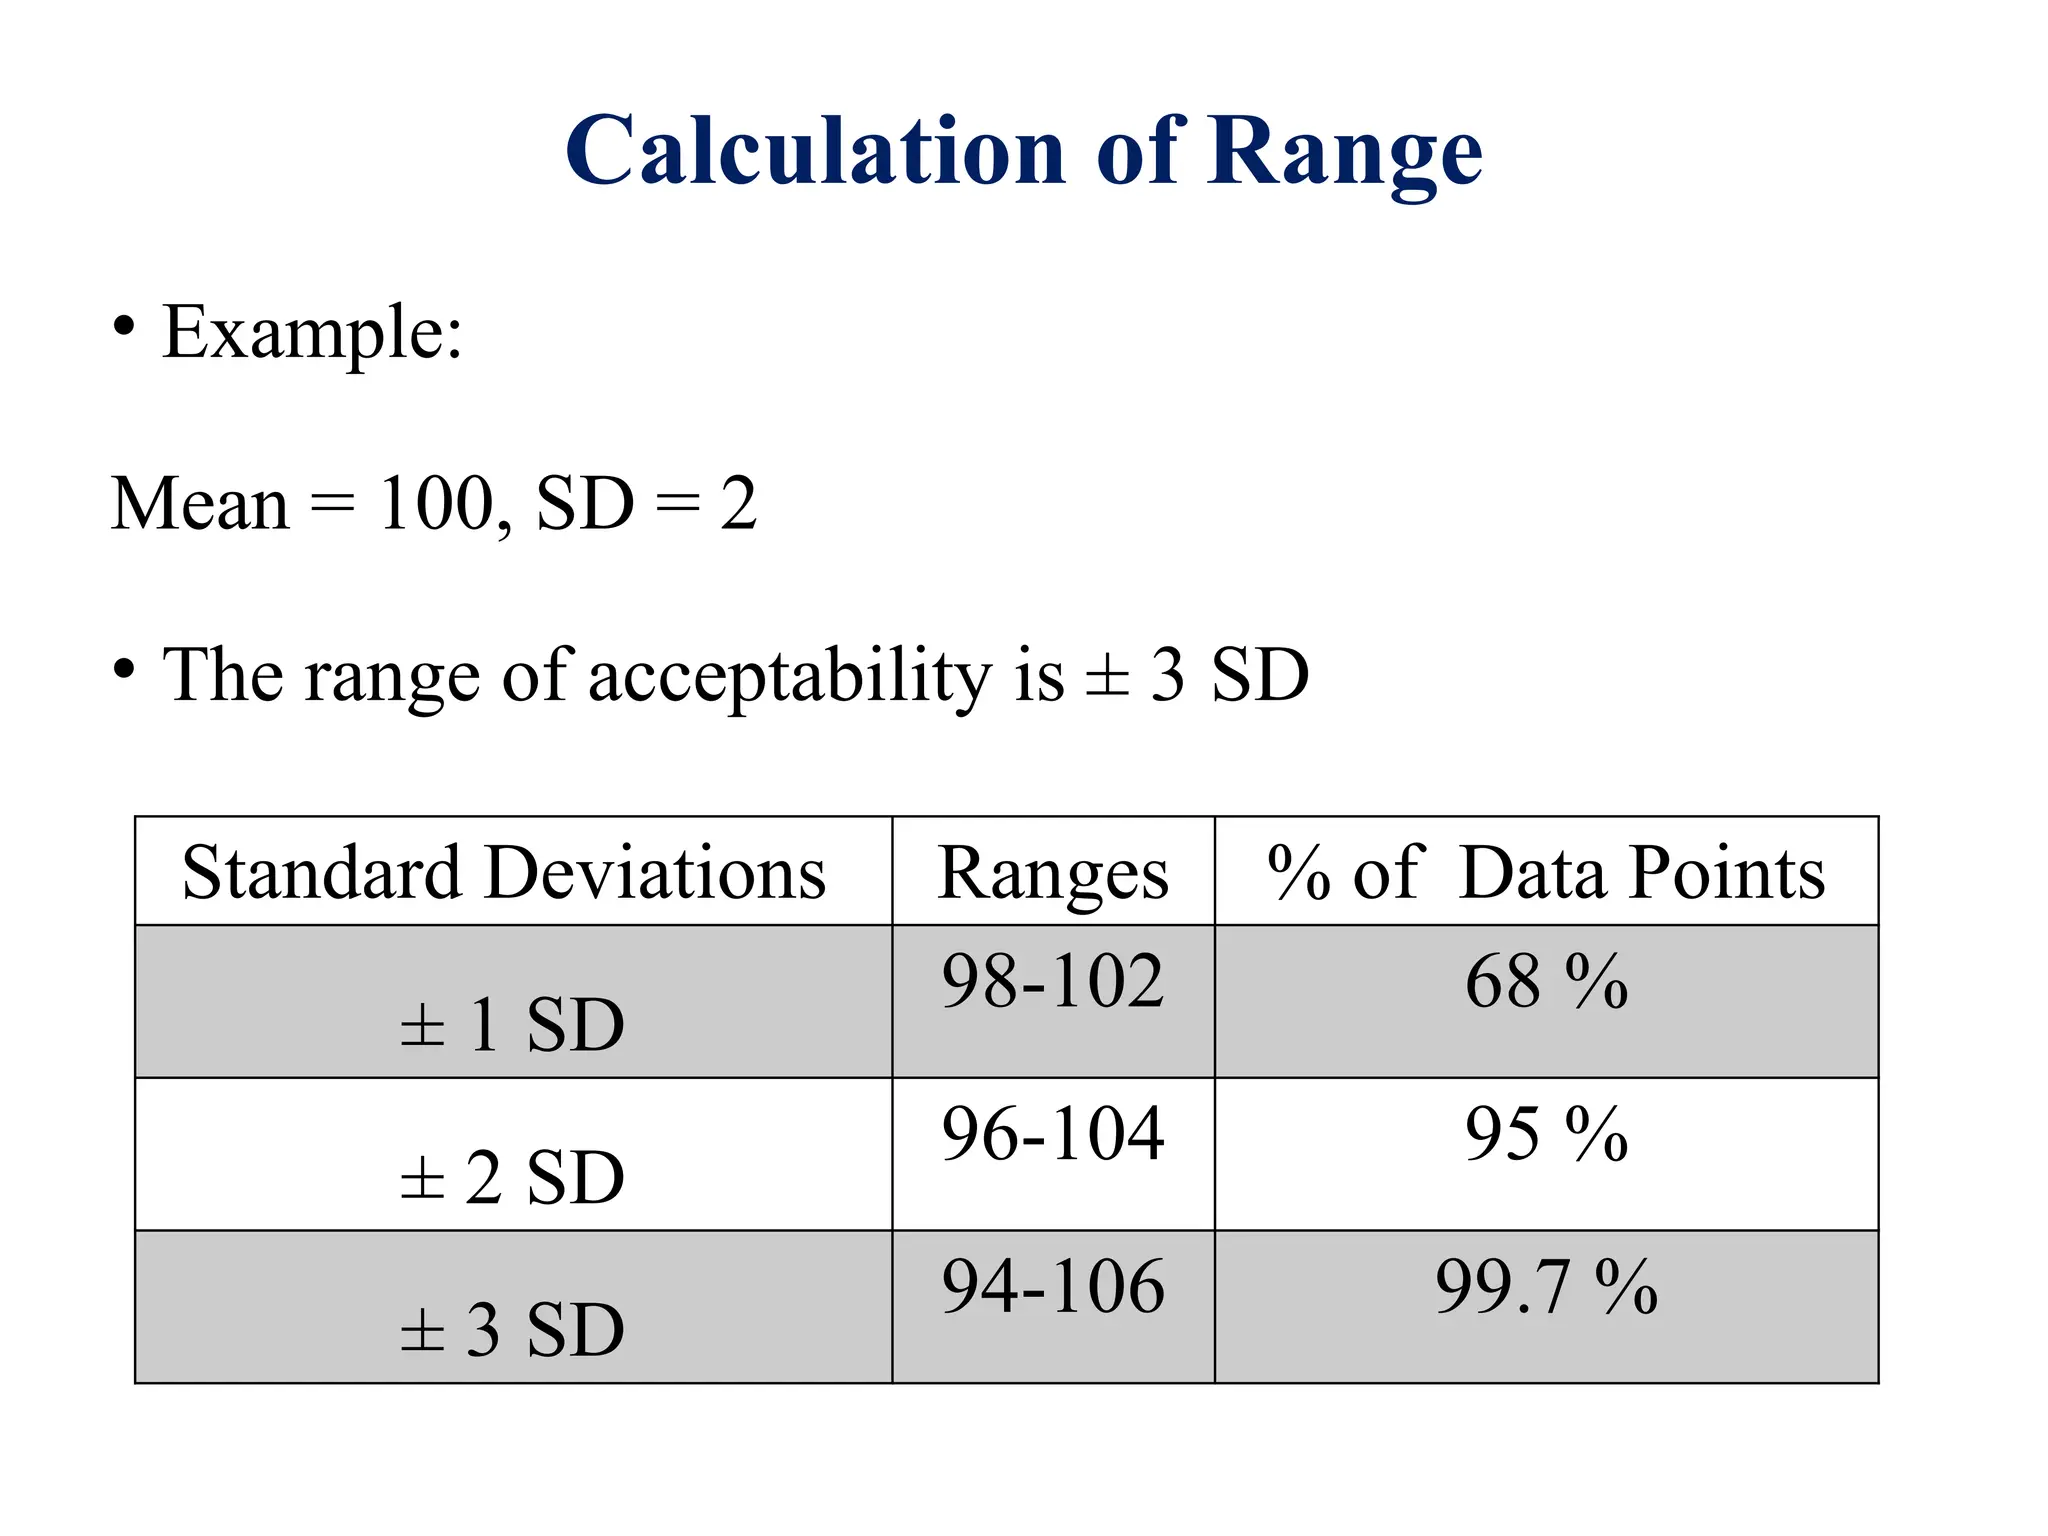
Calculation of Range
•Example:
Mean = 100, SD = 2
• The range of acceptability is ± 3 SD
Standard Deviations Ranges % of Data Points
± 1 SD
98-102 68 %
± 2 SD
96-104 95 %
± 3 SD
94-106 99.7 %
22.
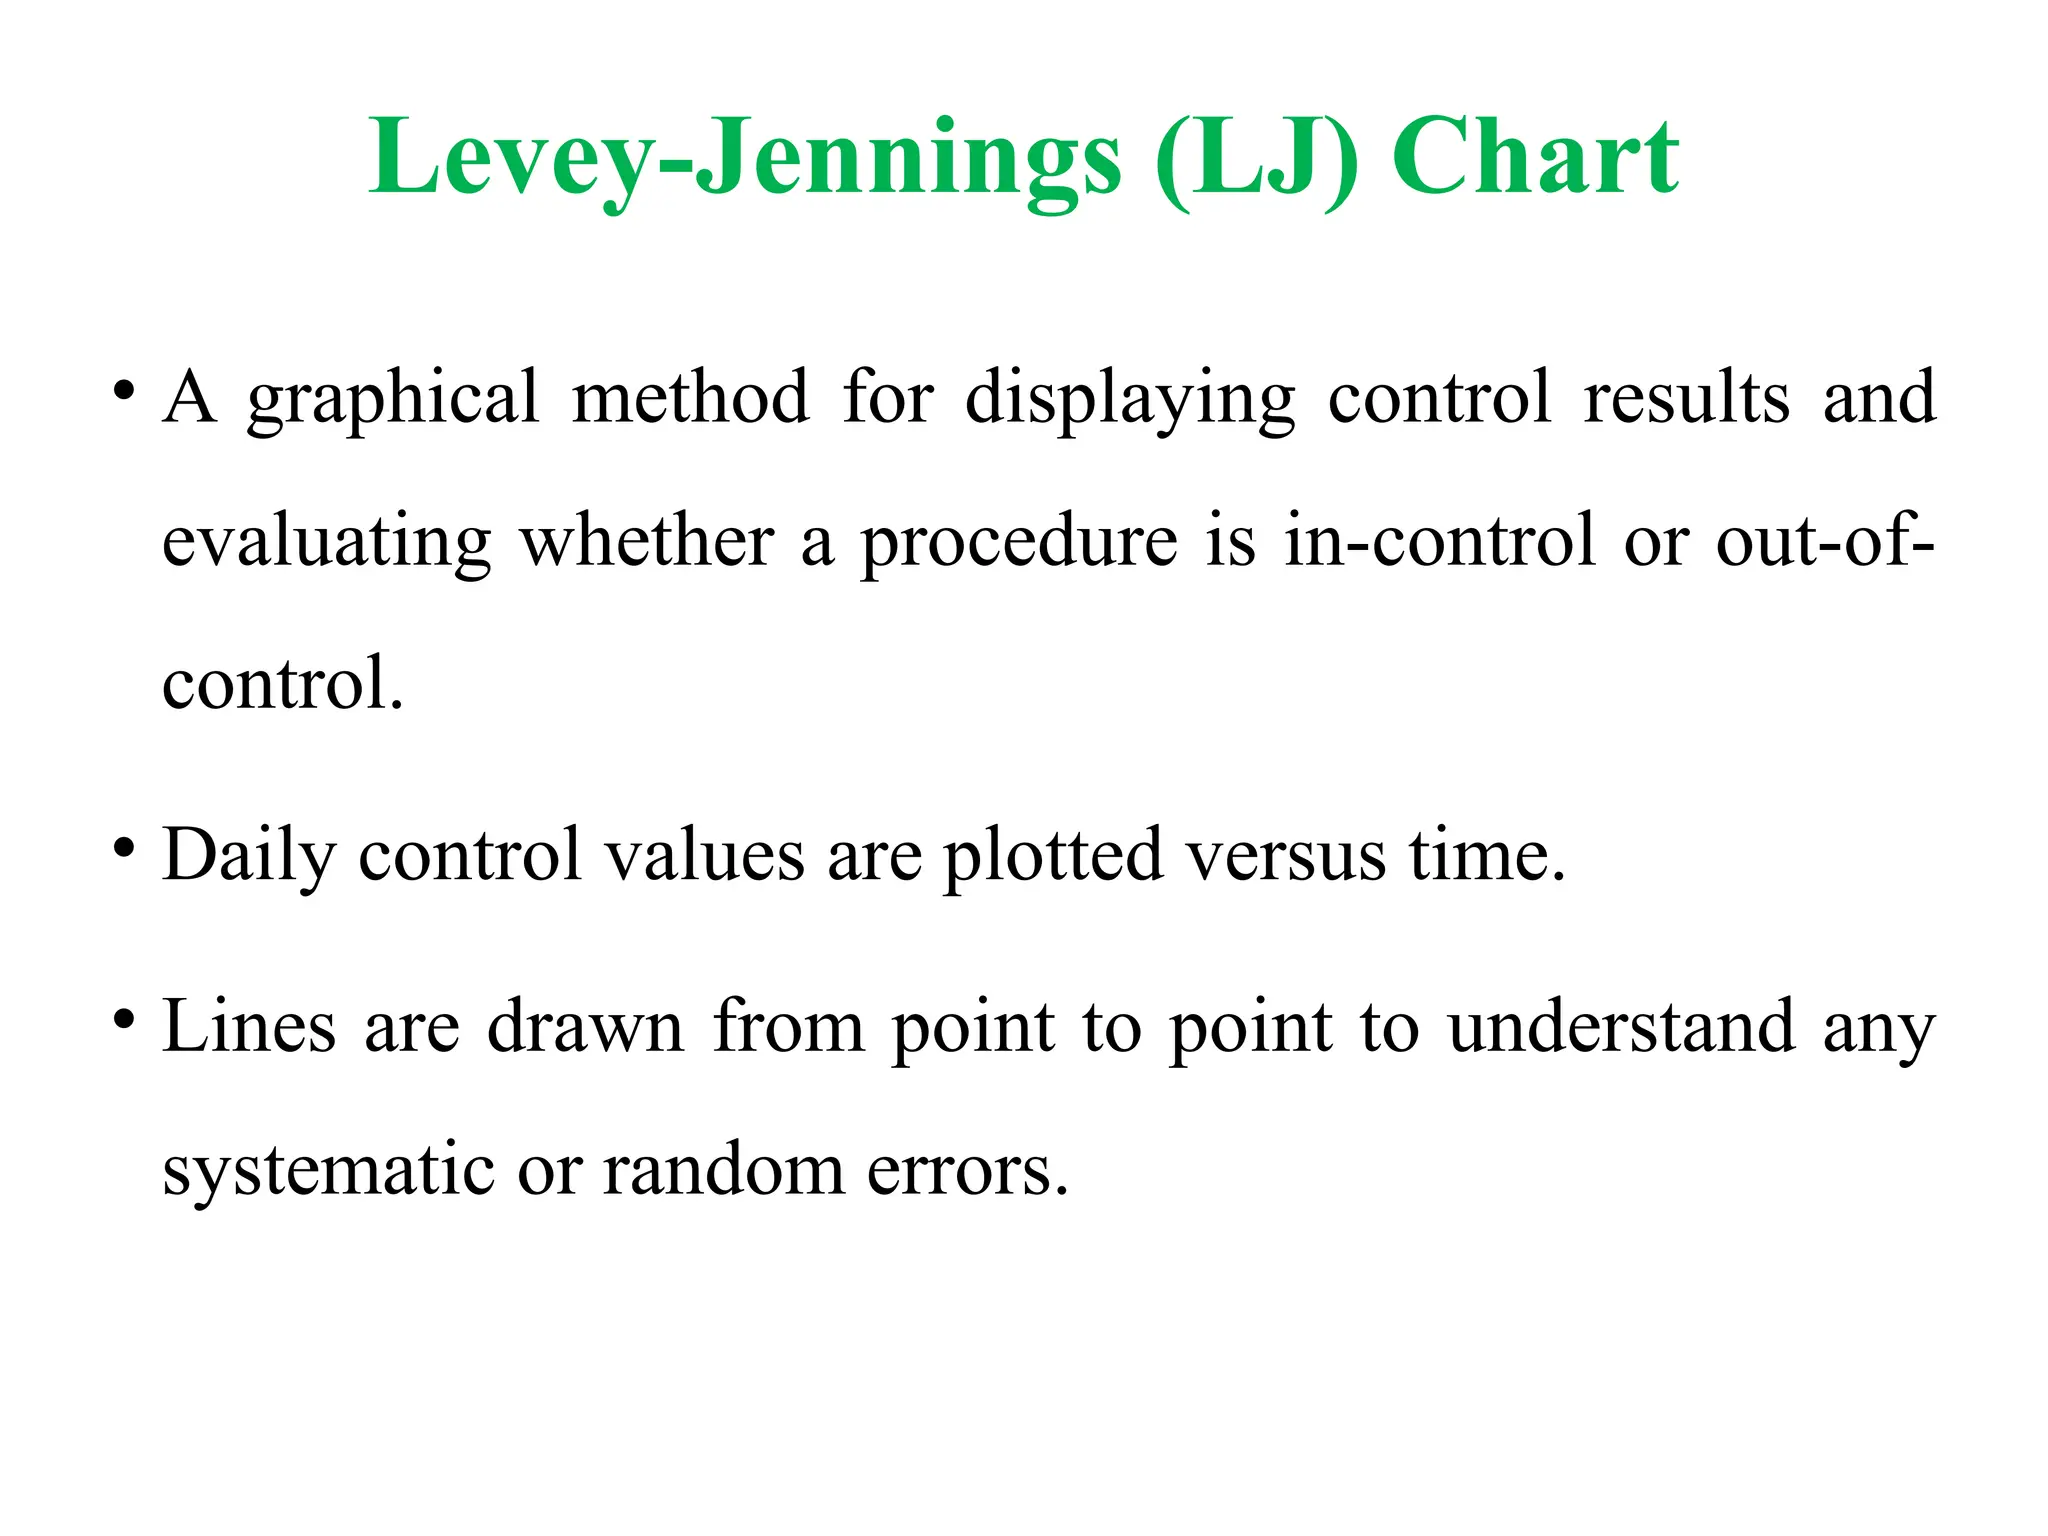
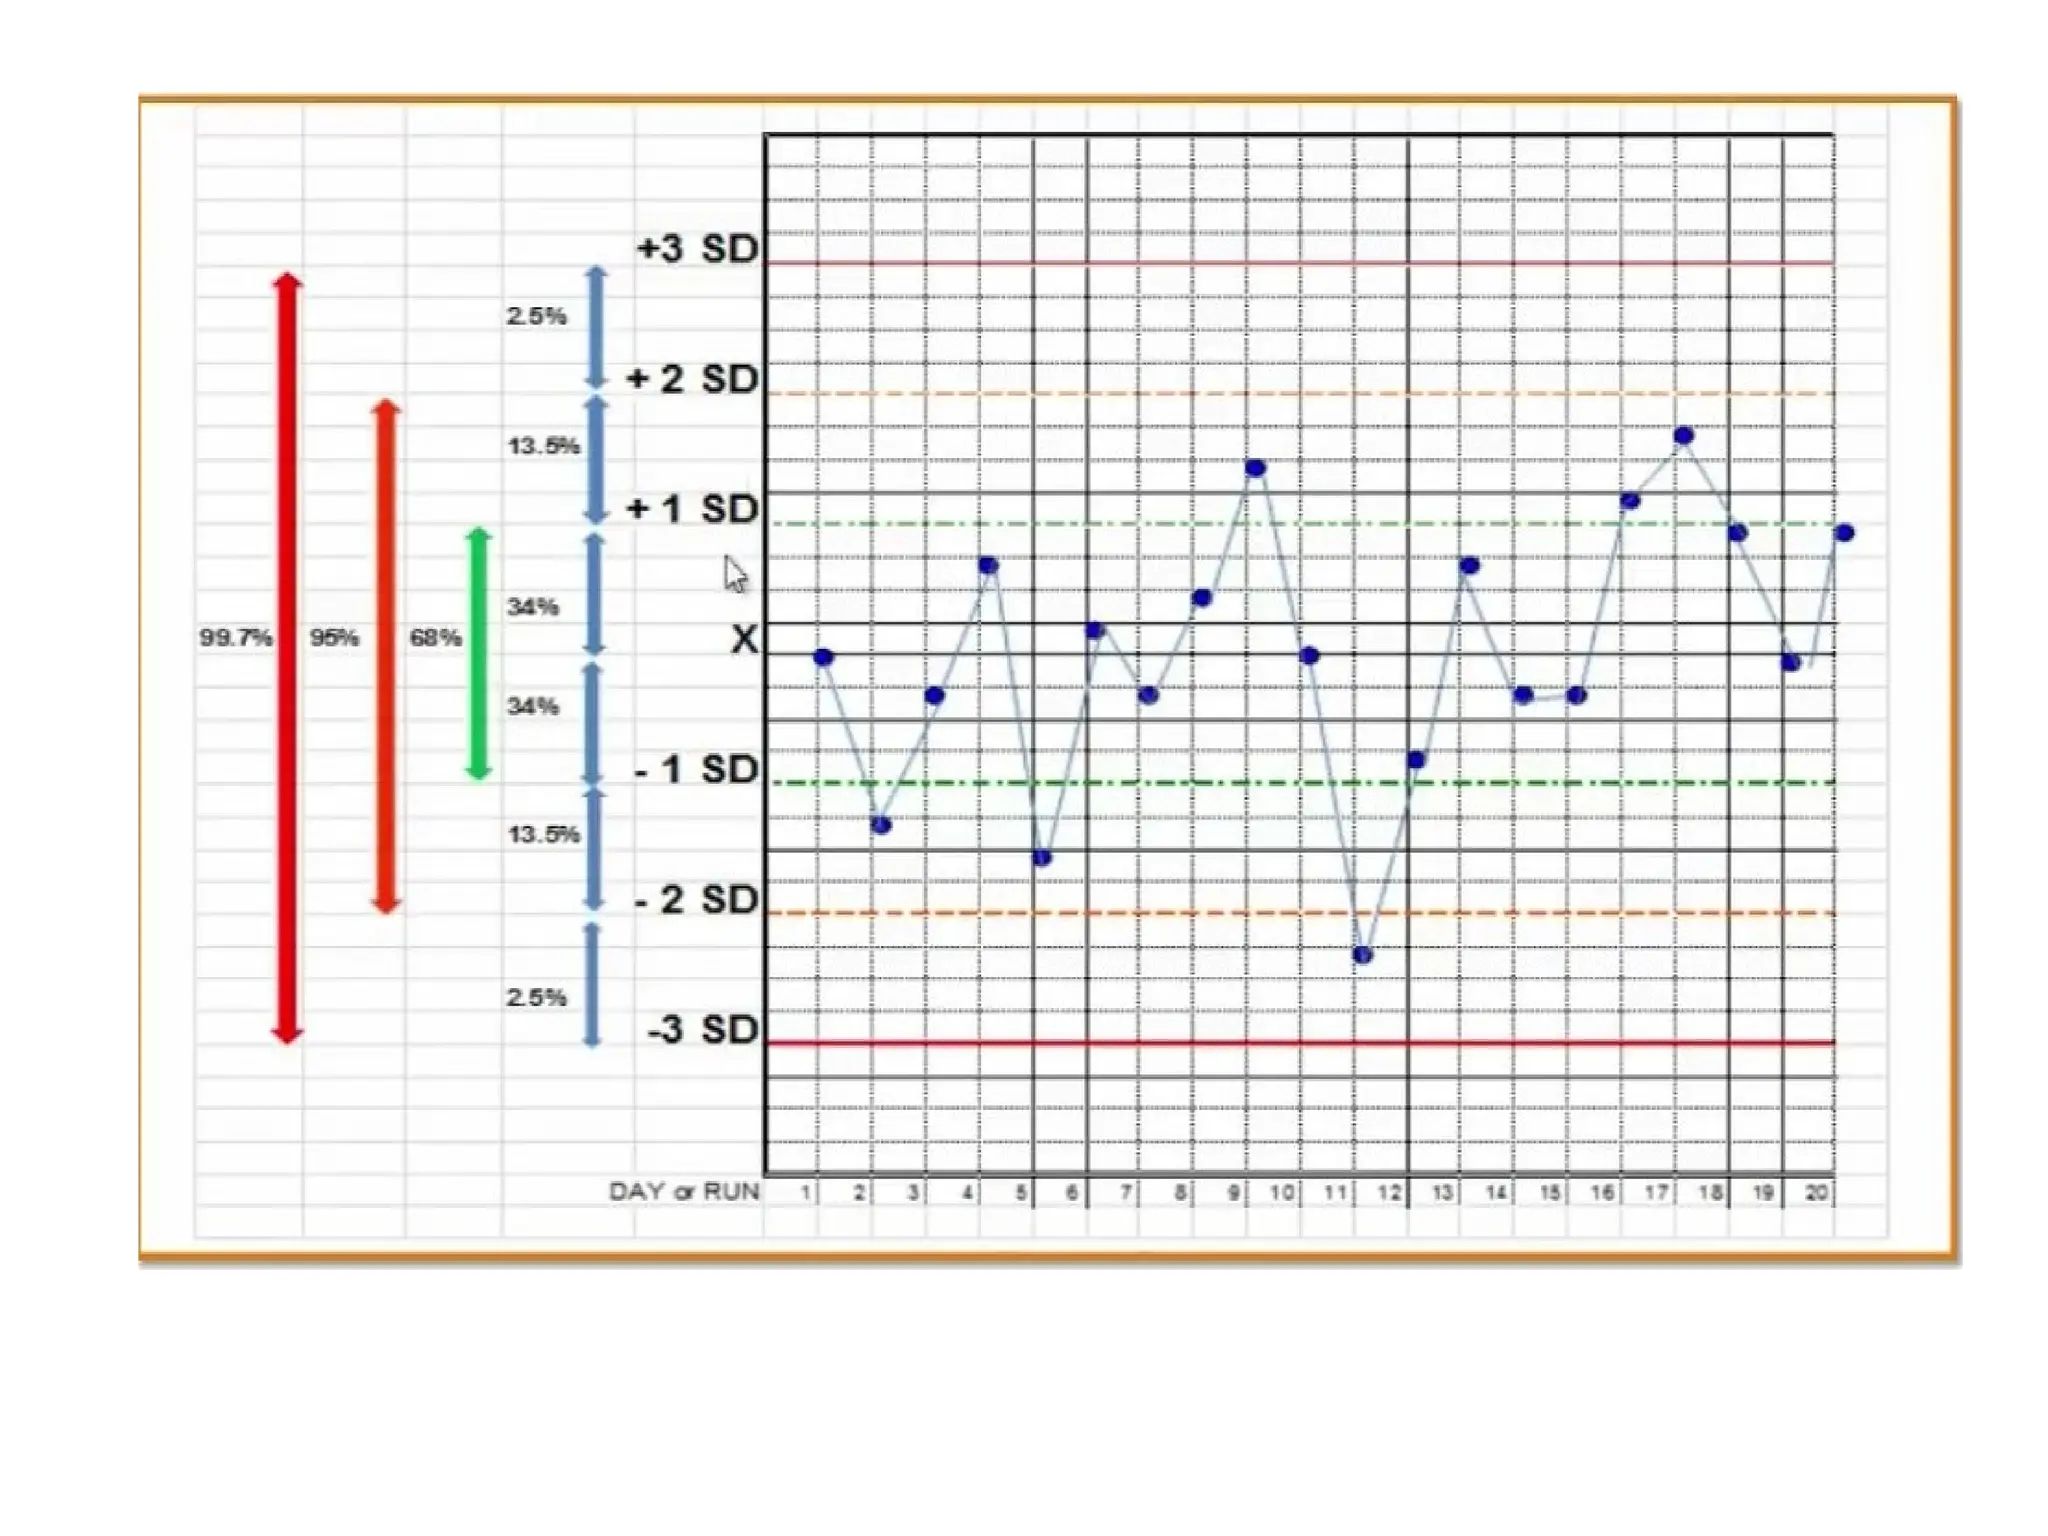
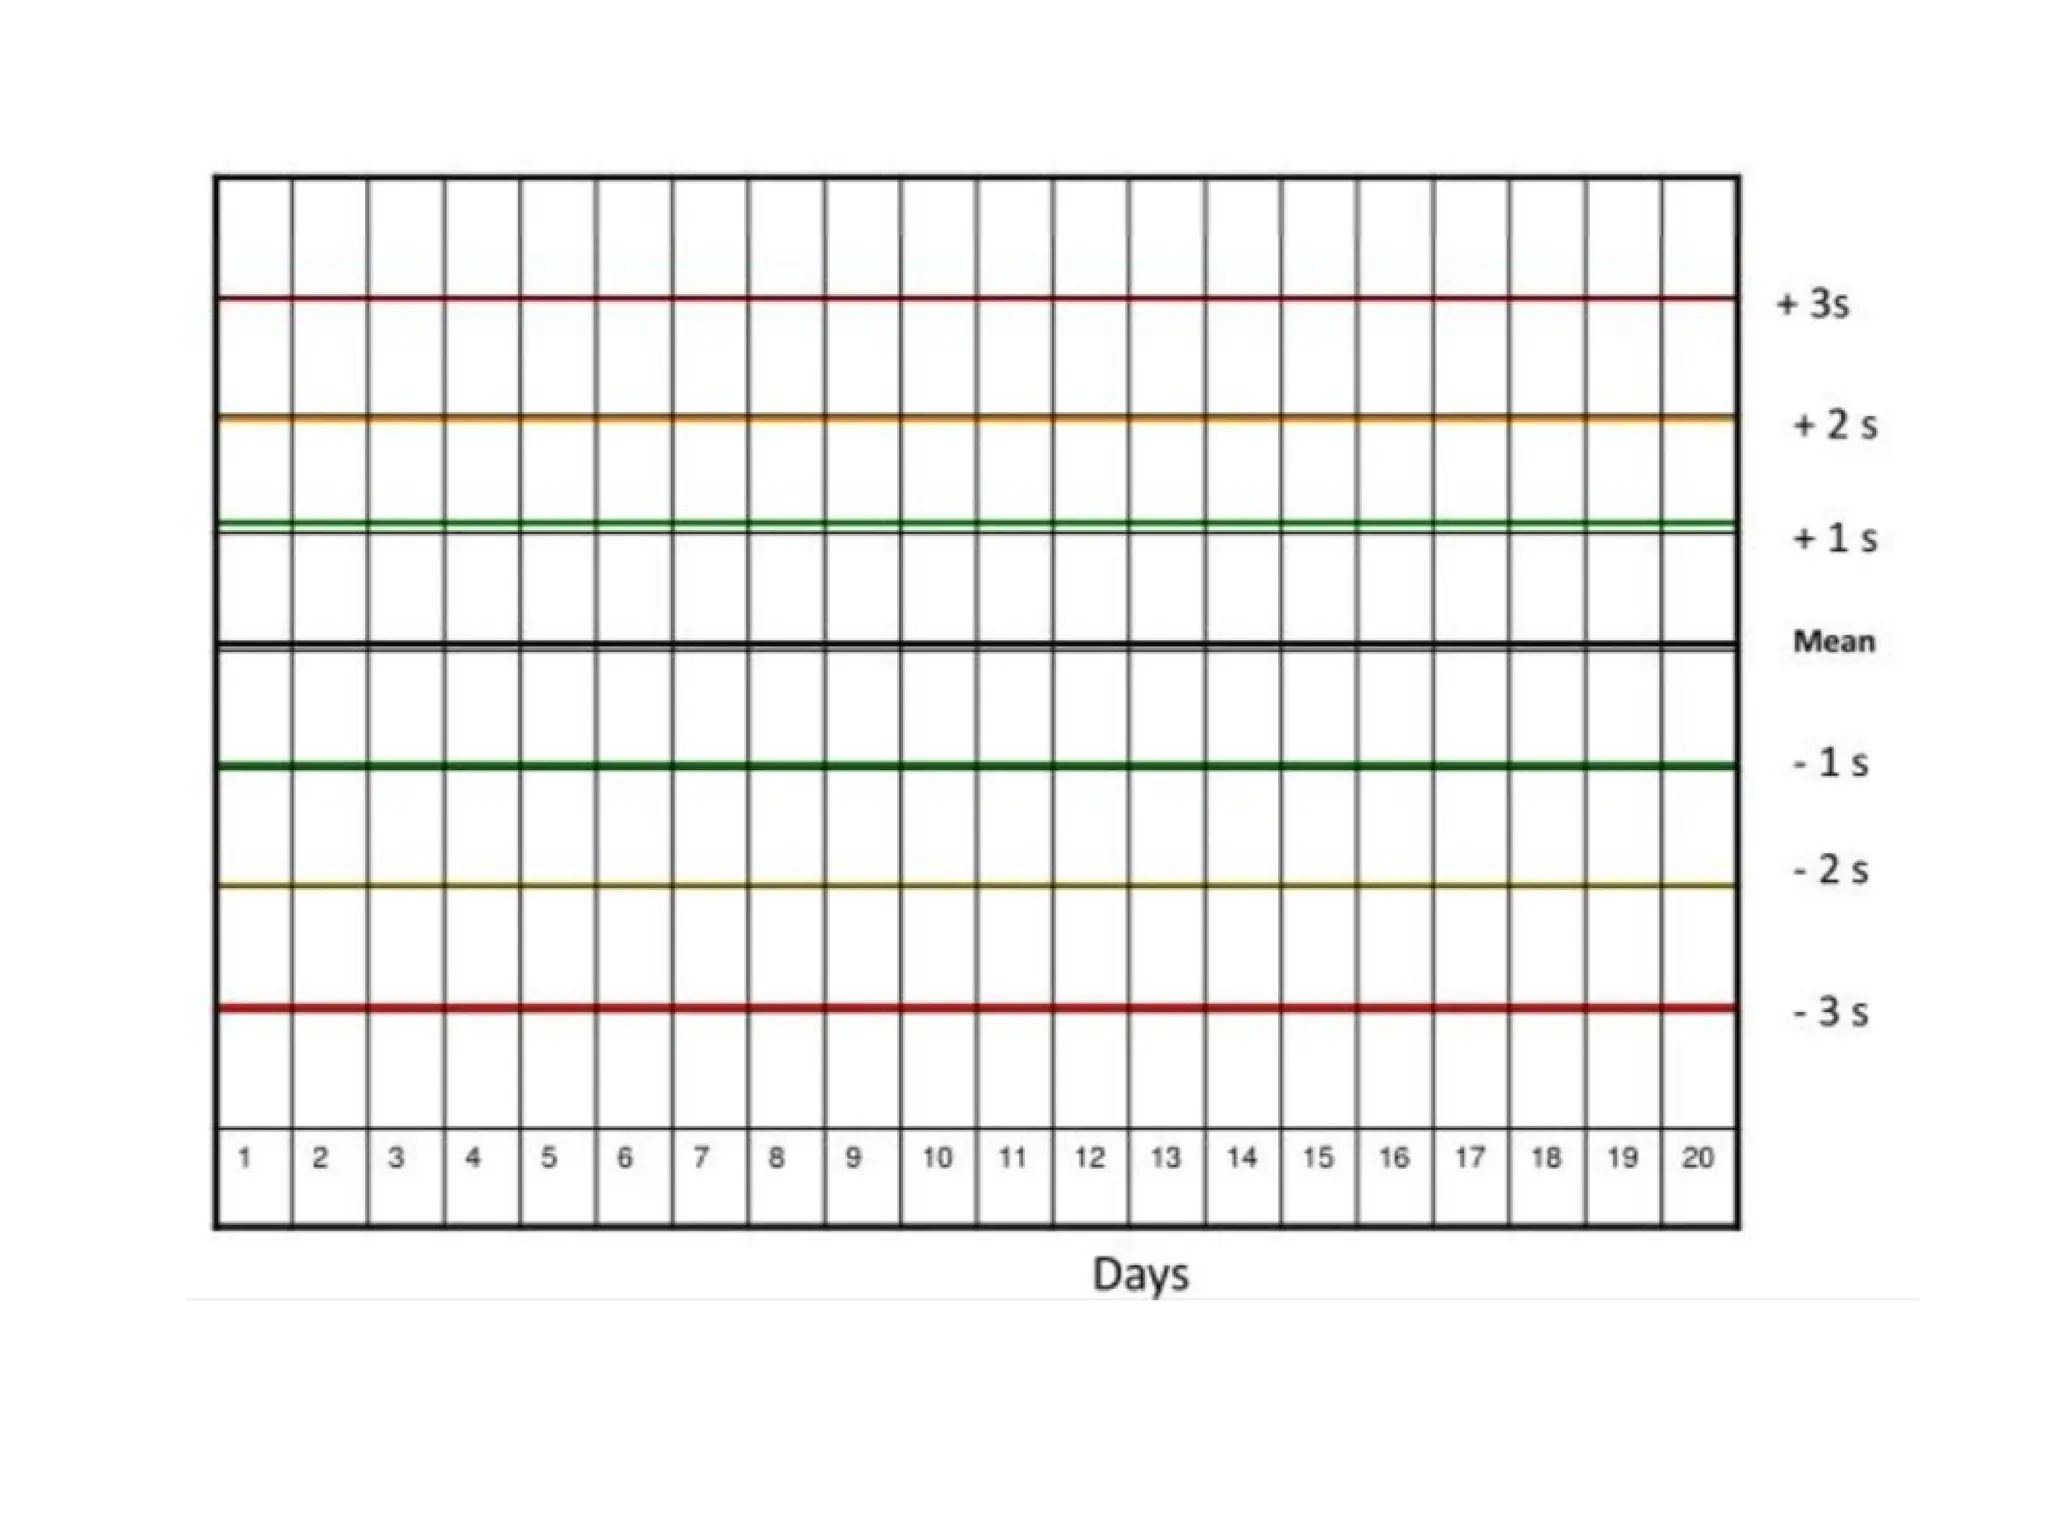
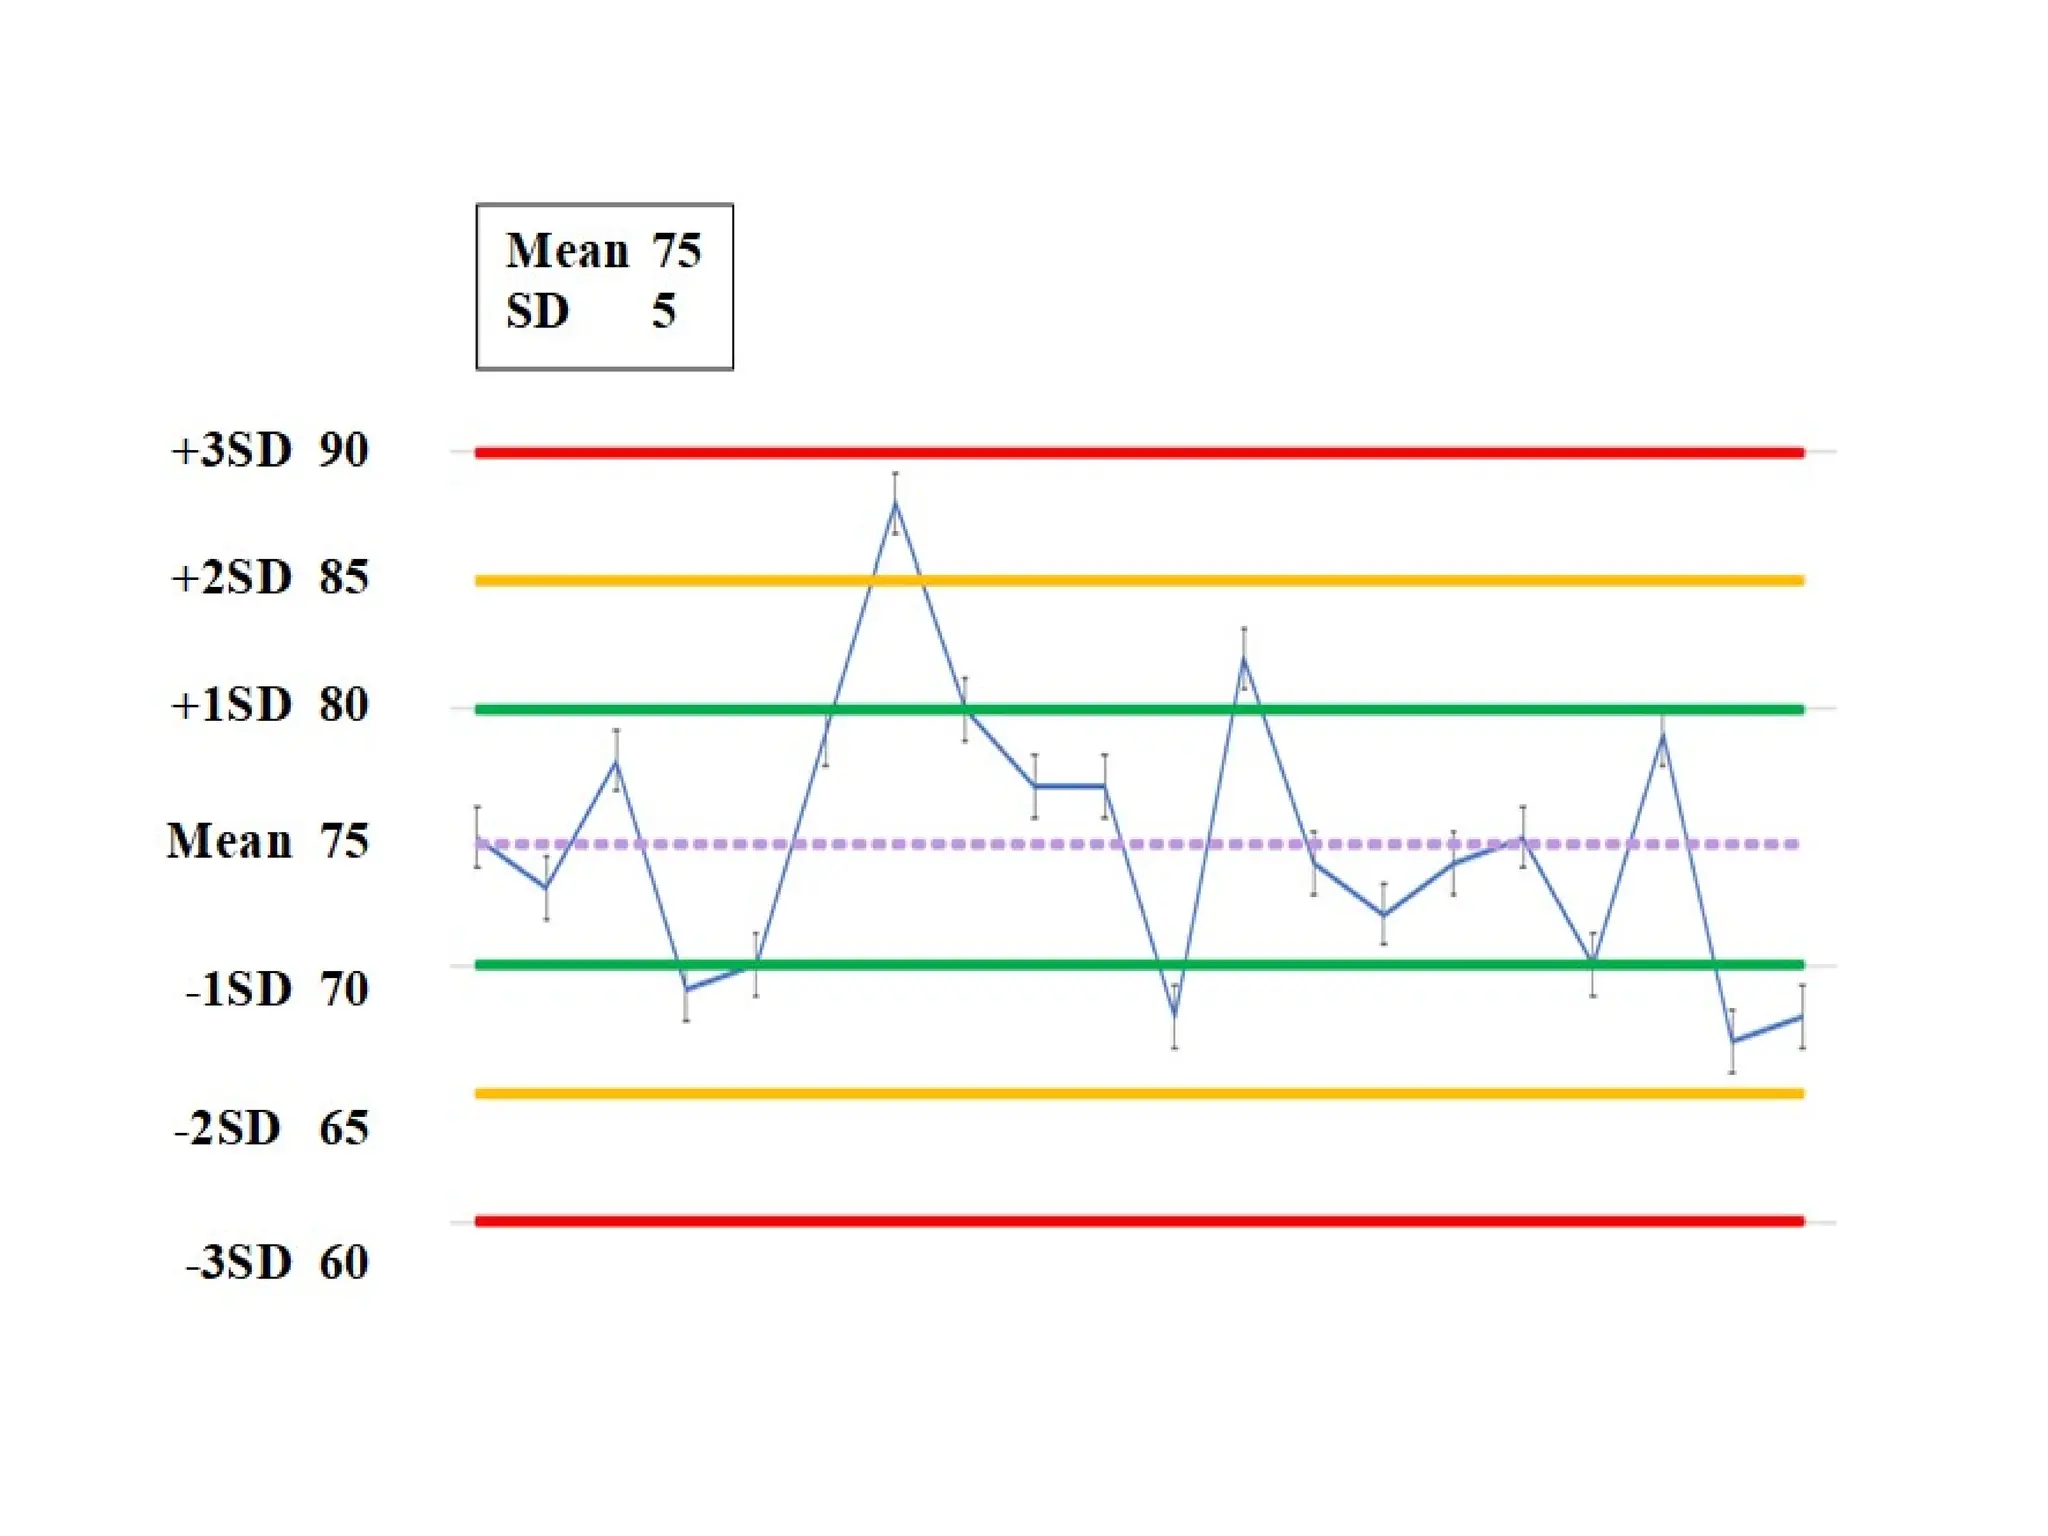
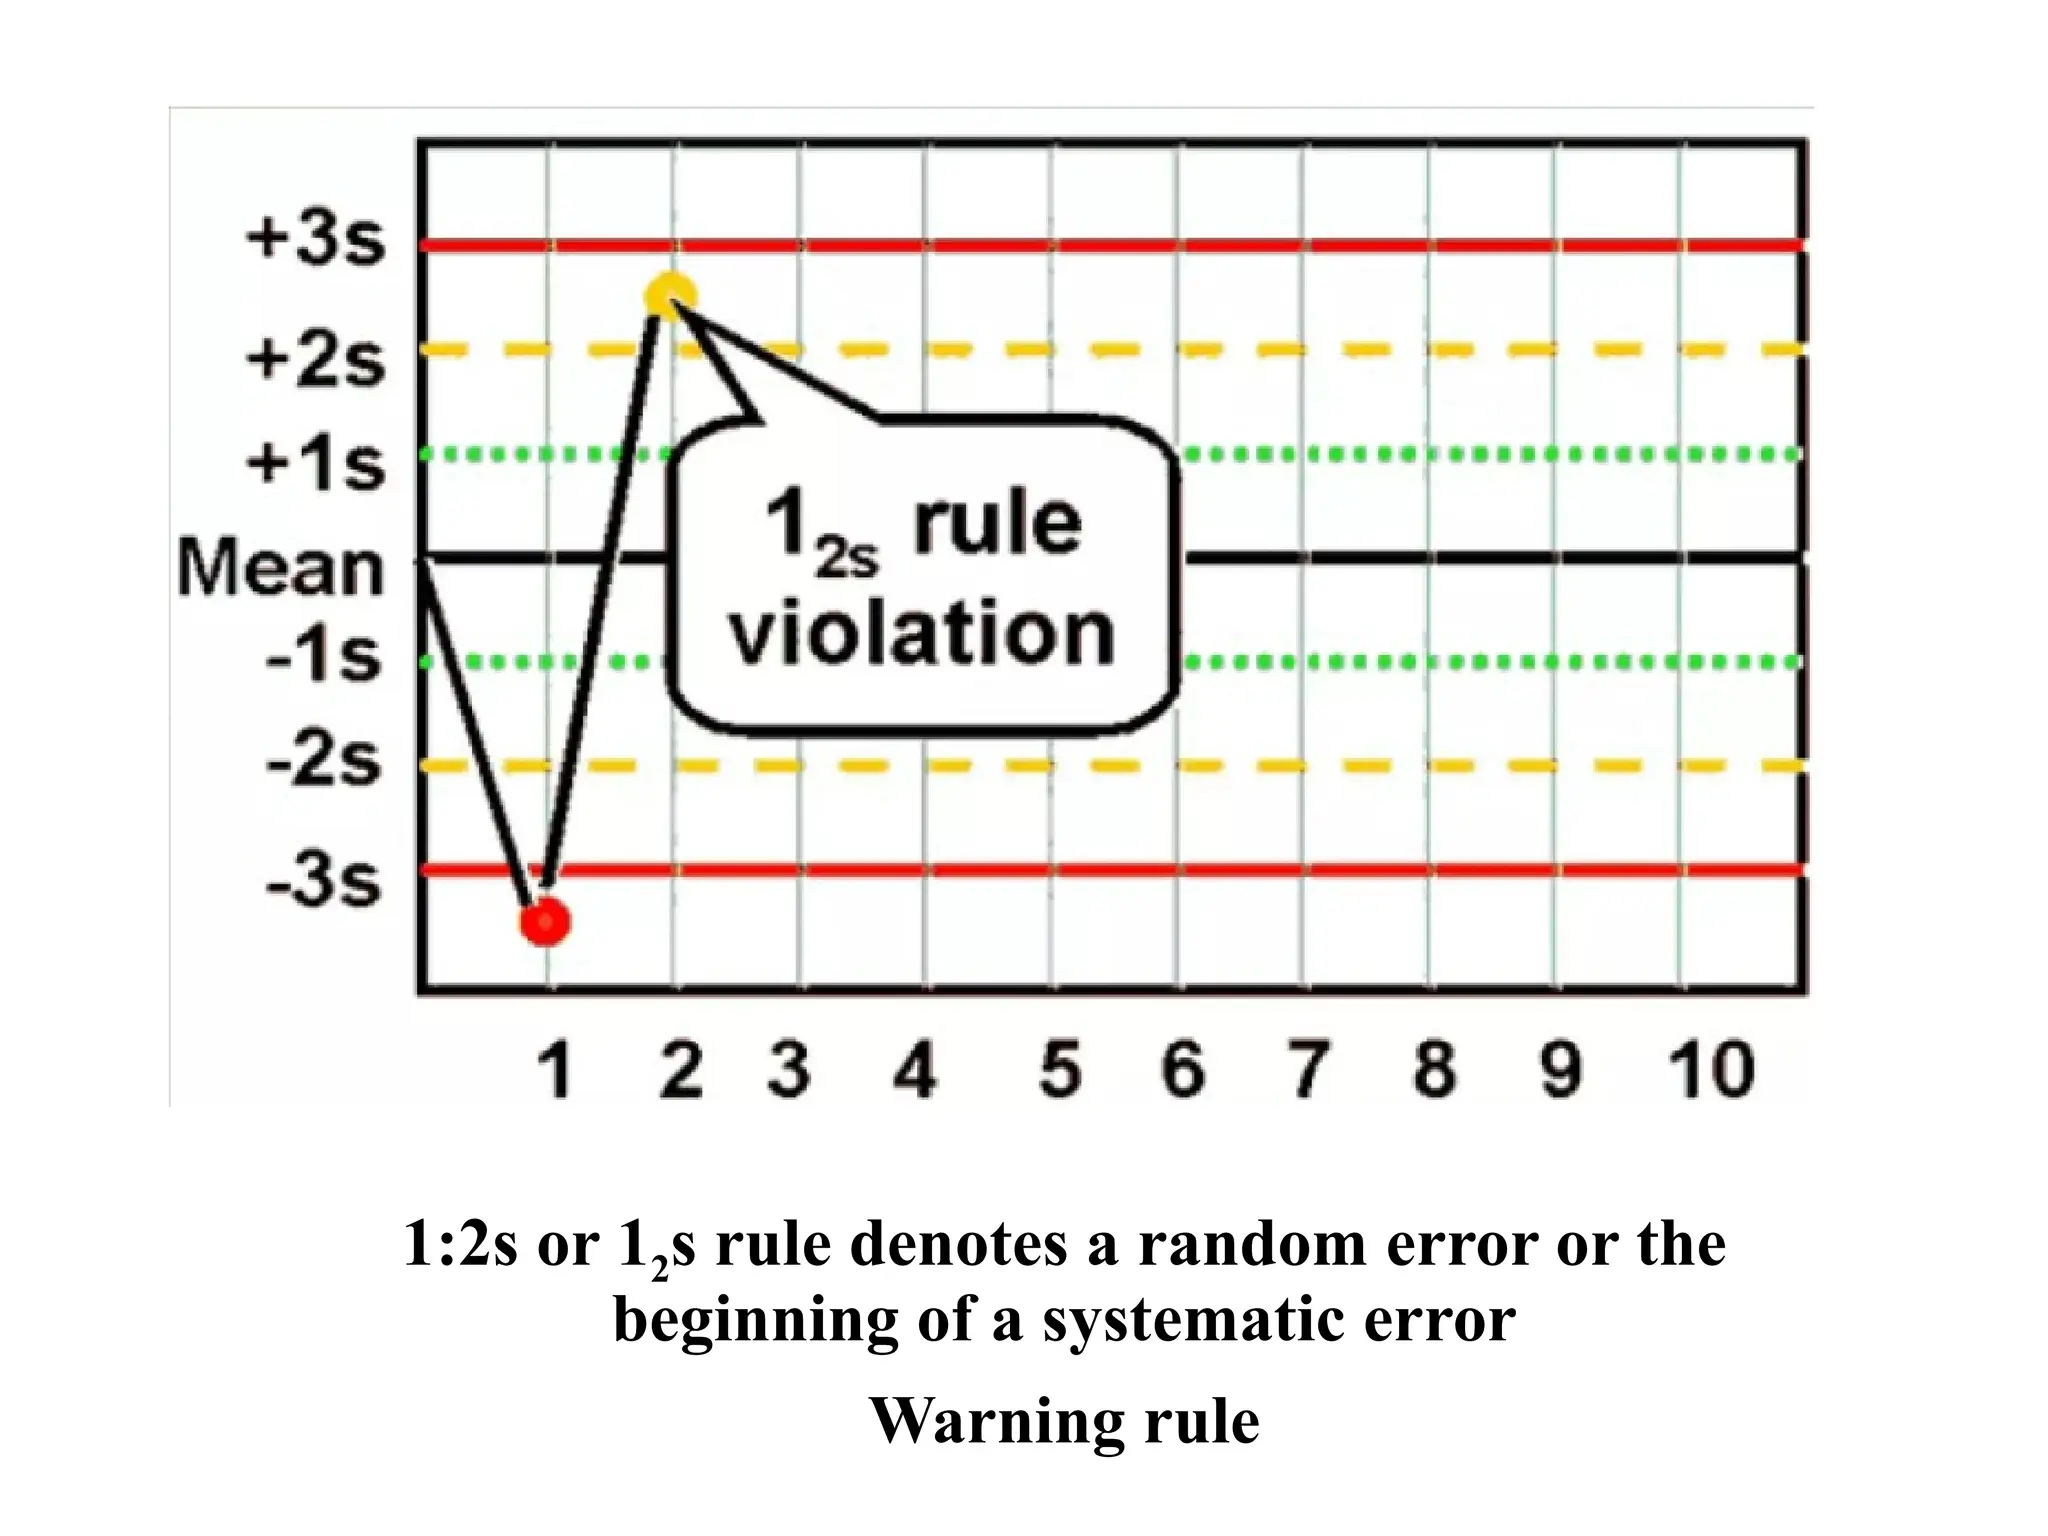
Levey-Jennings (LJ) Chart
•A graphical method for displaying control results and
evaluating whether a procedure is in-control or out-of-
control.
• Daily control values are plotted versus time.
• Lines are drawn from point to point to understand any
systematic or random errors.
23.
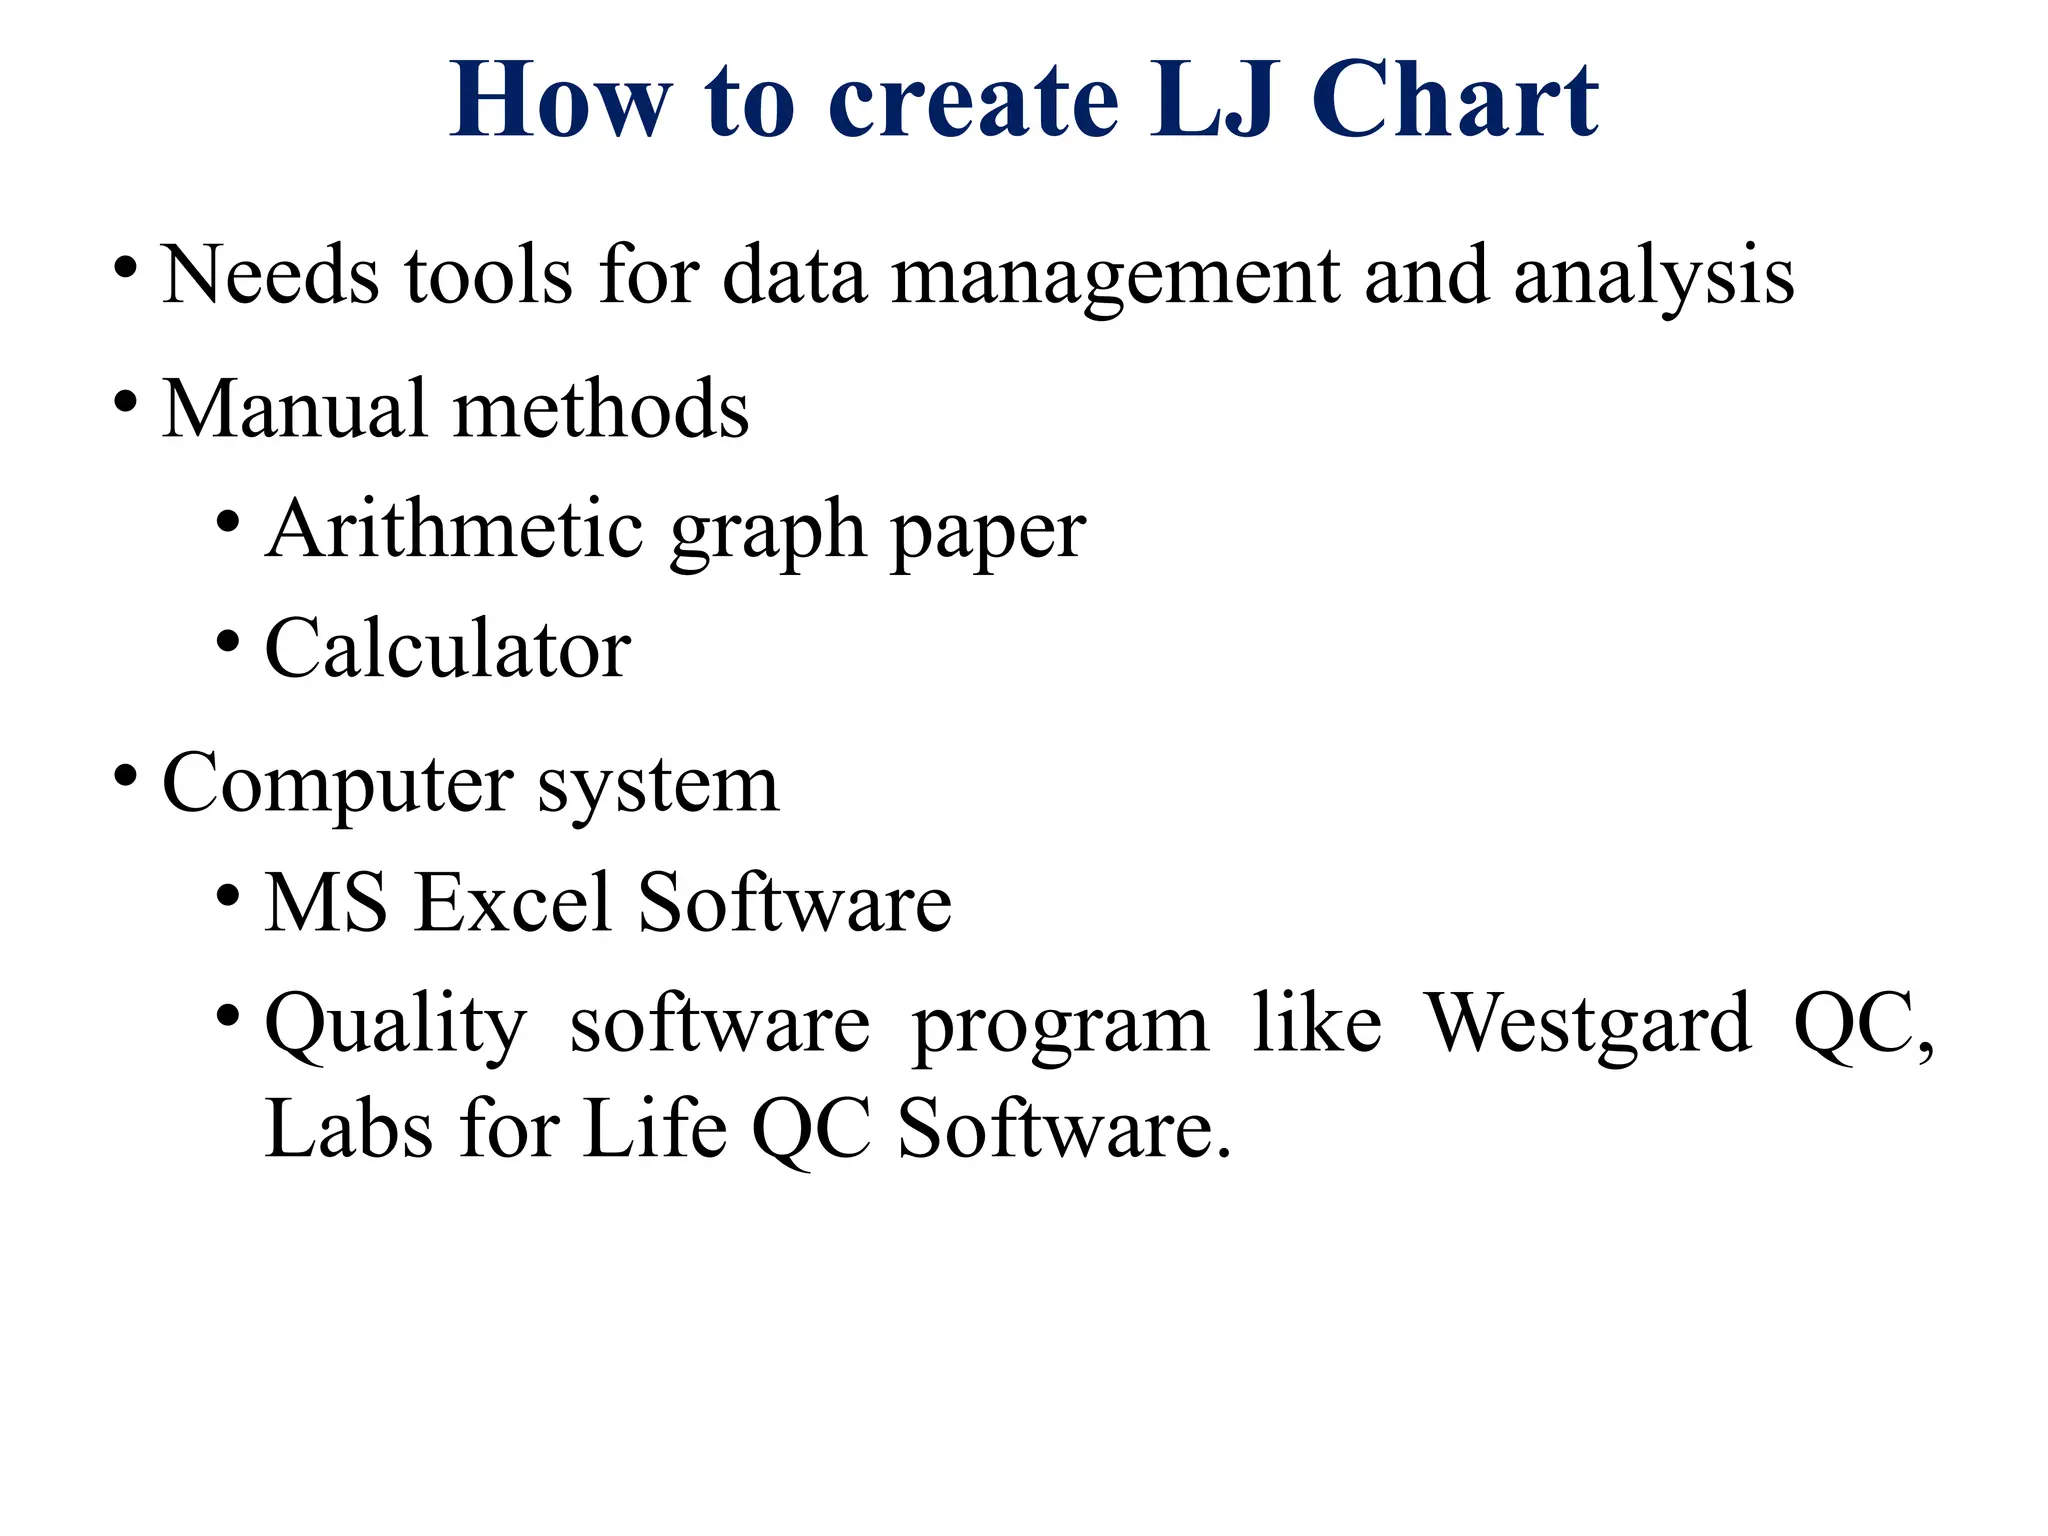
How to createLJ Chart
• Needs tools for data management and analysis
• Manual methods
• Arithmetic graph paper
• Calculator
• Computer system
• MS Excel Software
• Quality software program like Westgard QC,
Labs for Life QC Software.
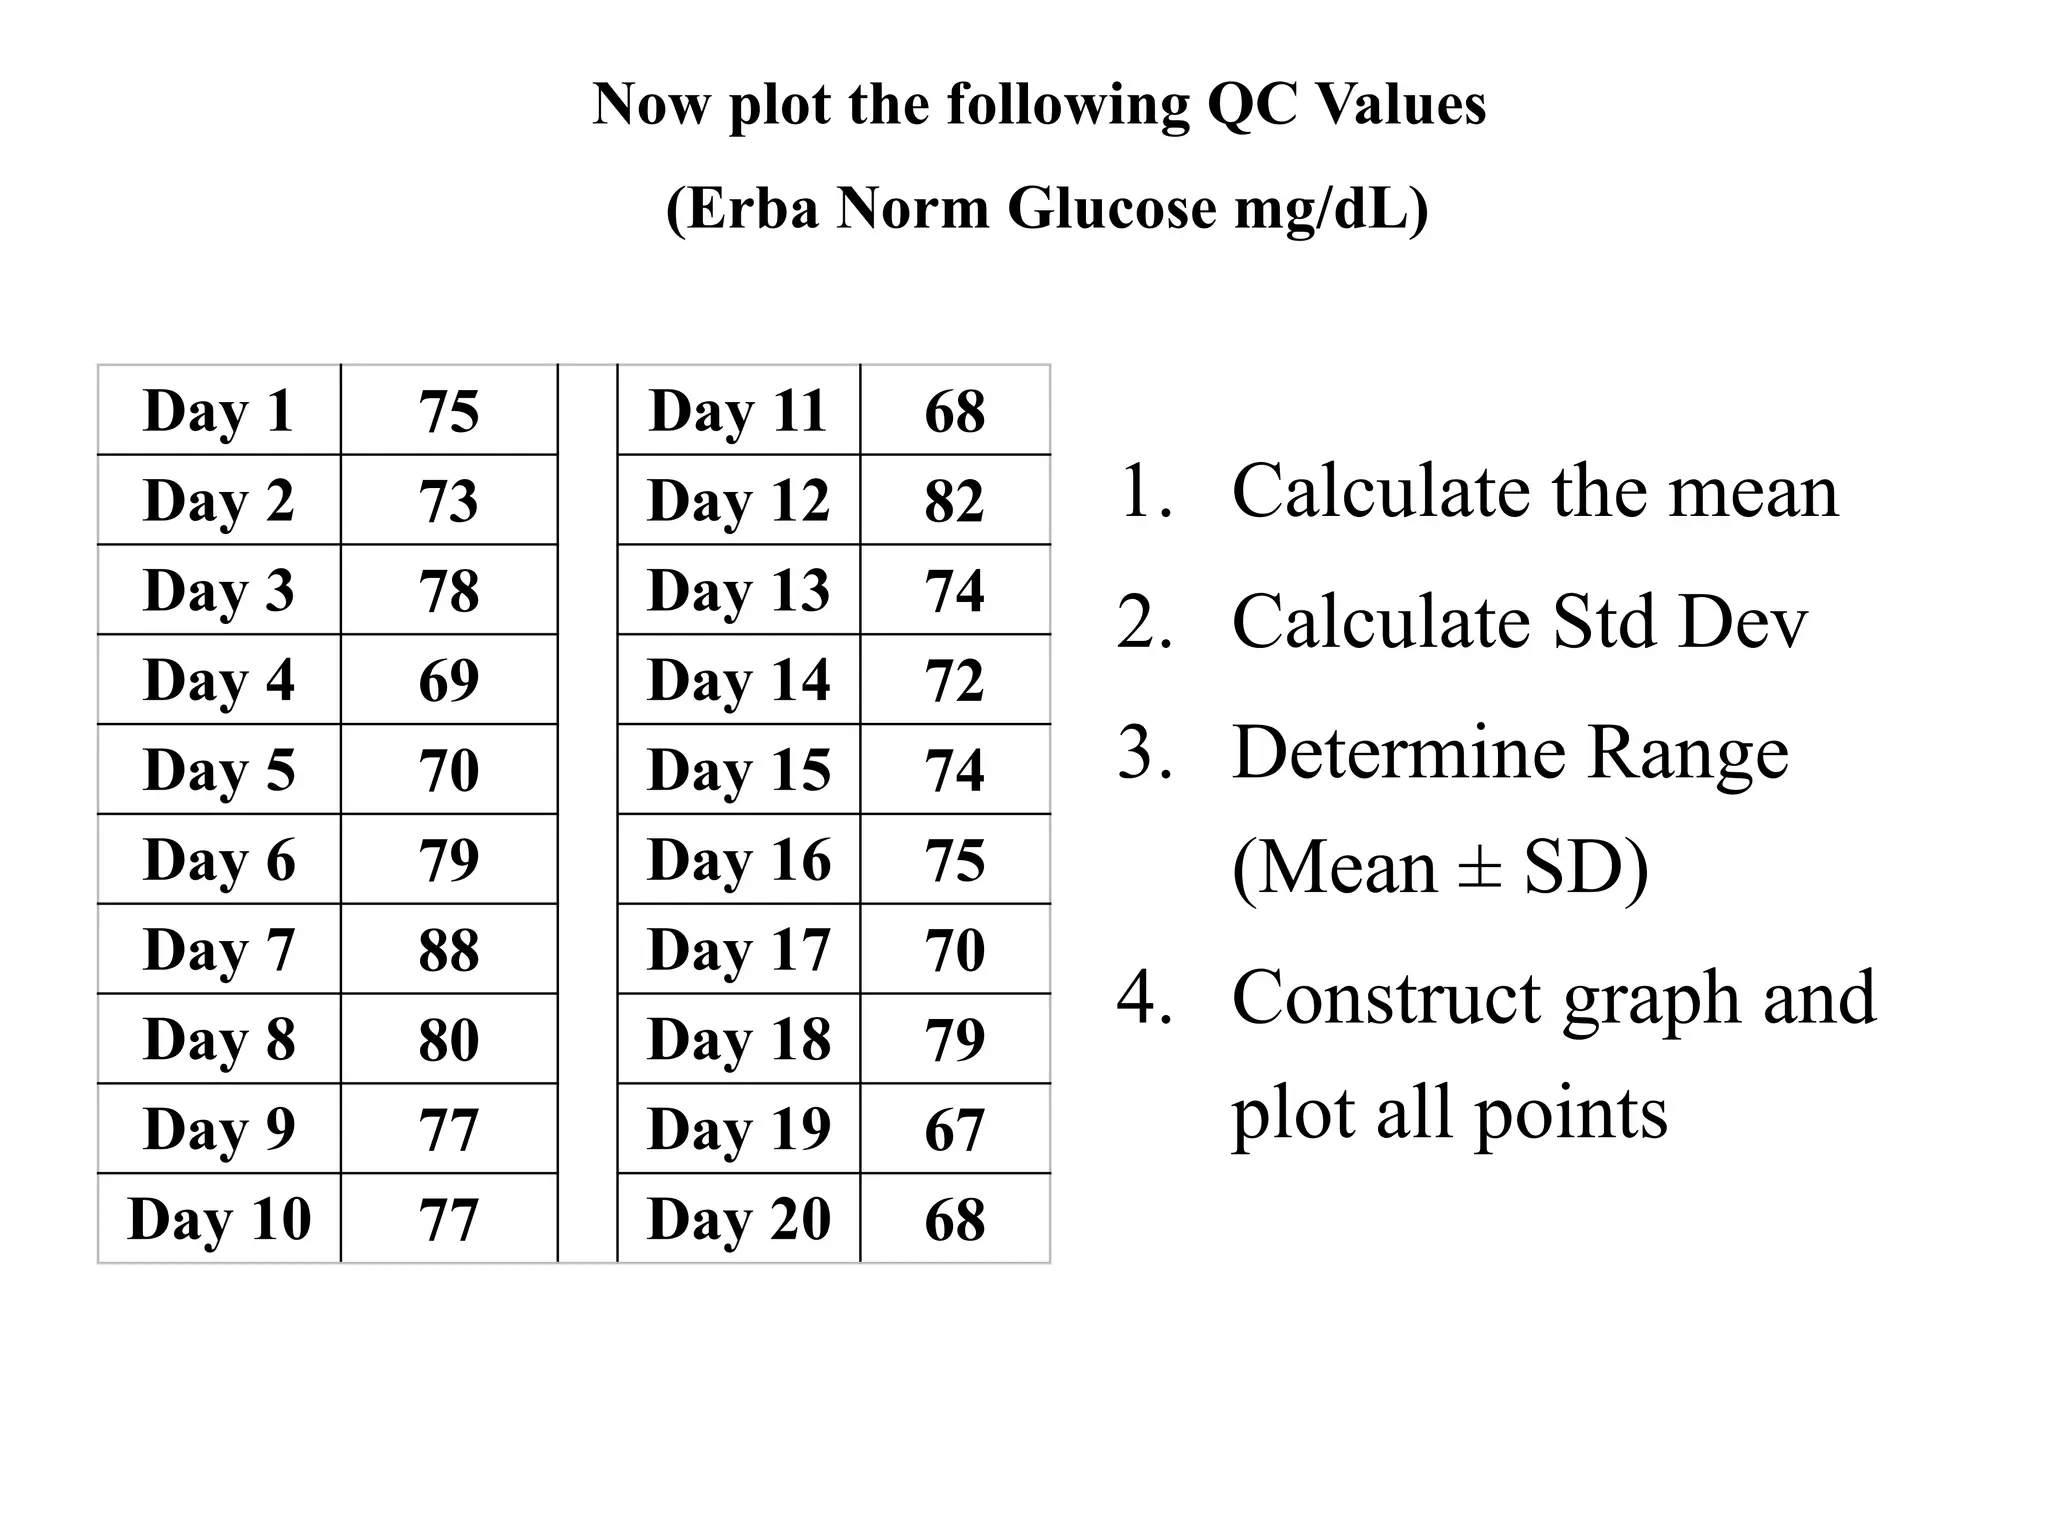
Now plot thefollowing QC Values
(Erba Norm Glucose mg/dL)
Day 1 75 Day 11 68
Day 2 73 Day 12 82
Day 3 78 Day 13 74
Day 4 69 Day 14 72
Day 5 70 Day 15 74
Day 6 79 Day 16 75
Day 7 88 Day 17 70
Day 8 80 Day 18 79
Day 9 77 Day 19 67
Day 10 77 Day 20 68
1. Calculate the mean
2. Calculate Std Dev
3. Determine Range
(Mean ± SD)
4. Construct graph and
plot all points
27.
• Mean
• StandardDeviation
• Range = Mean (± 1 SD; ± 2 SD; ± 3 SD)
𝑋=
Σ 𝑋𝑖
𝑛
𝑆𝐷=
√Σ(𝑋− 𝑋)2
(𝑛−1)
29.
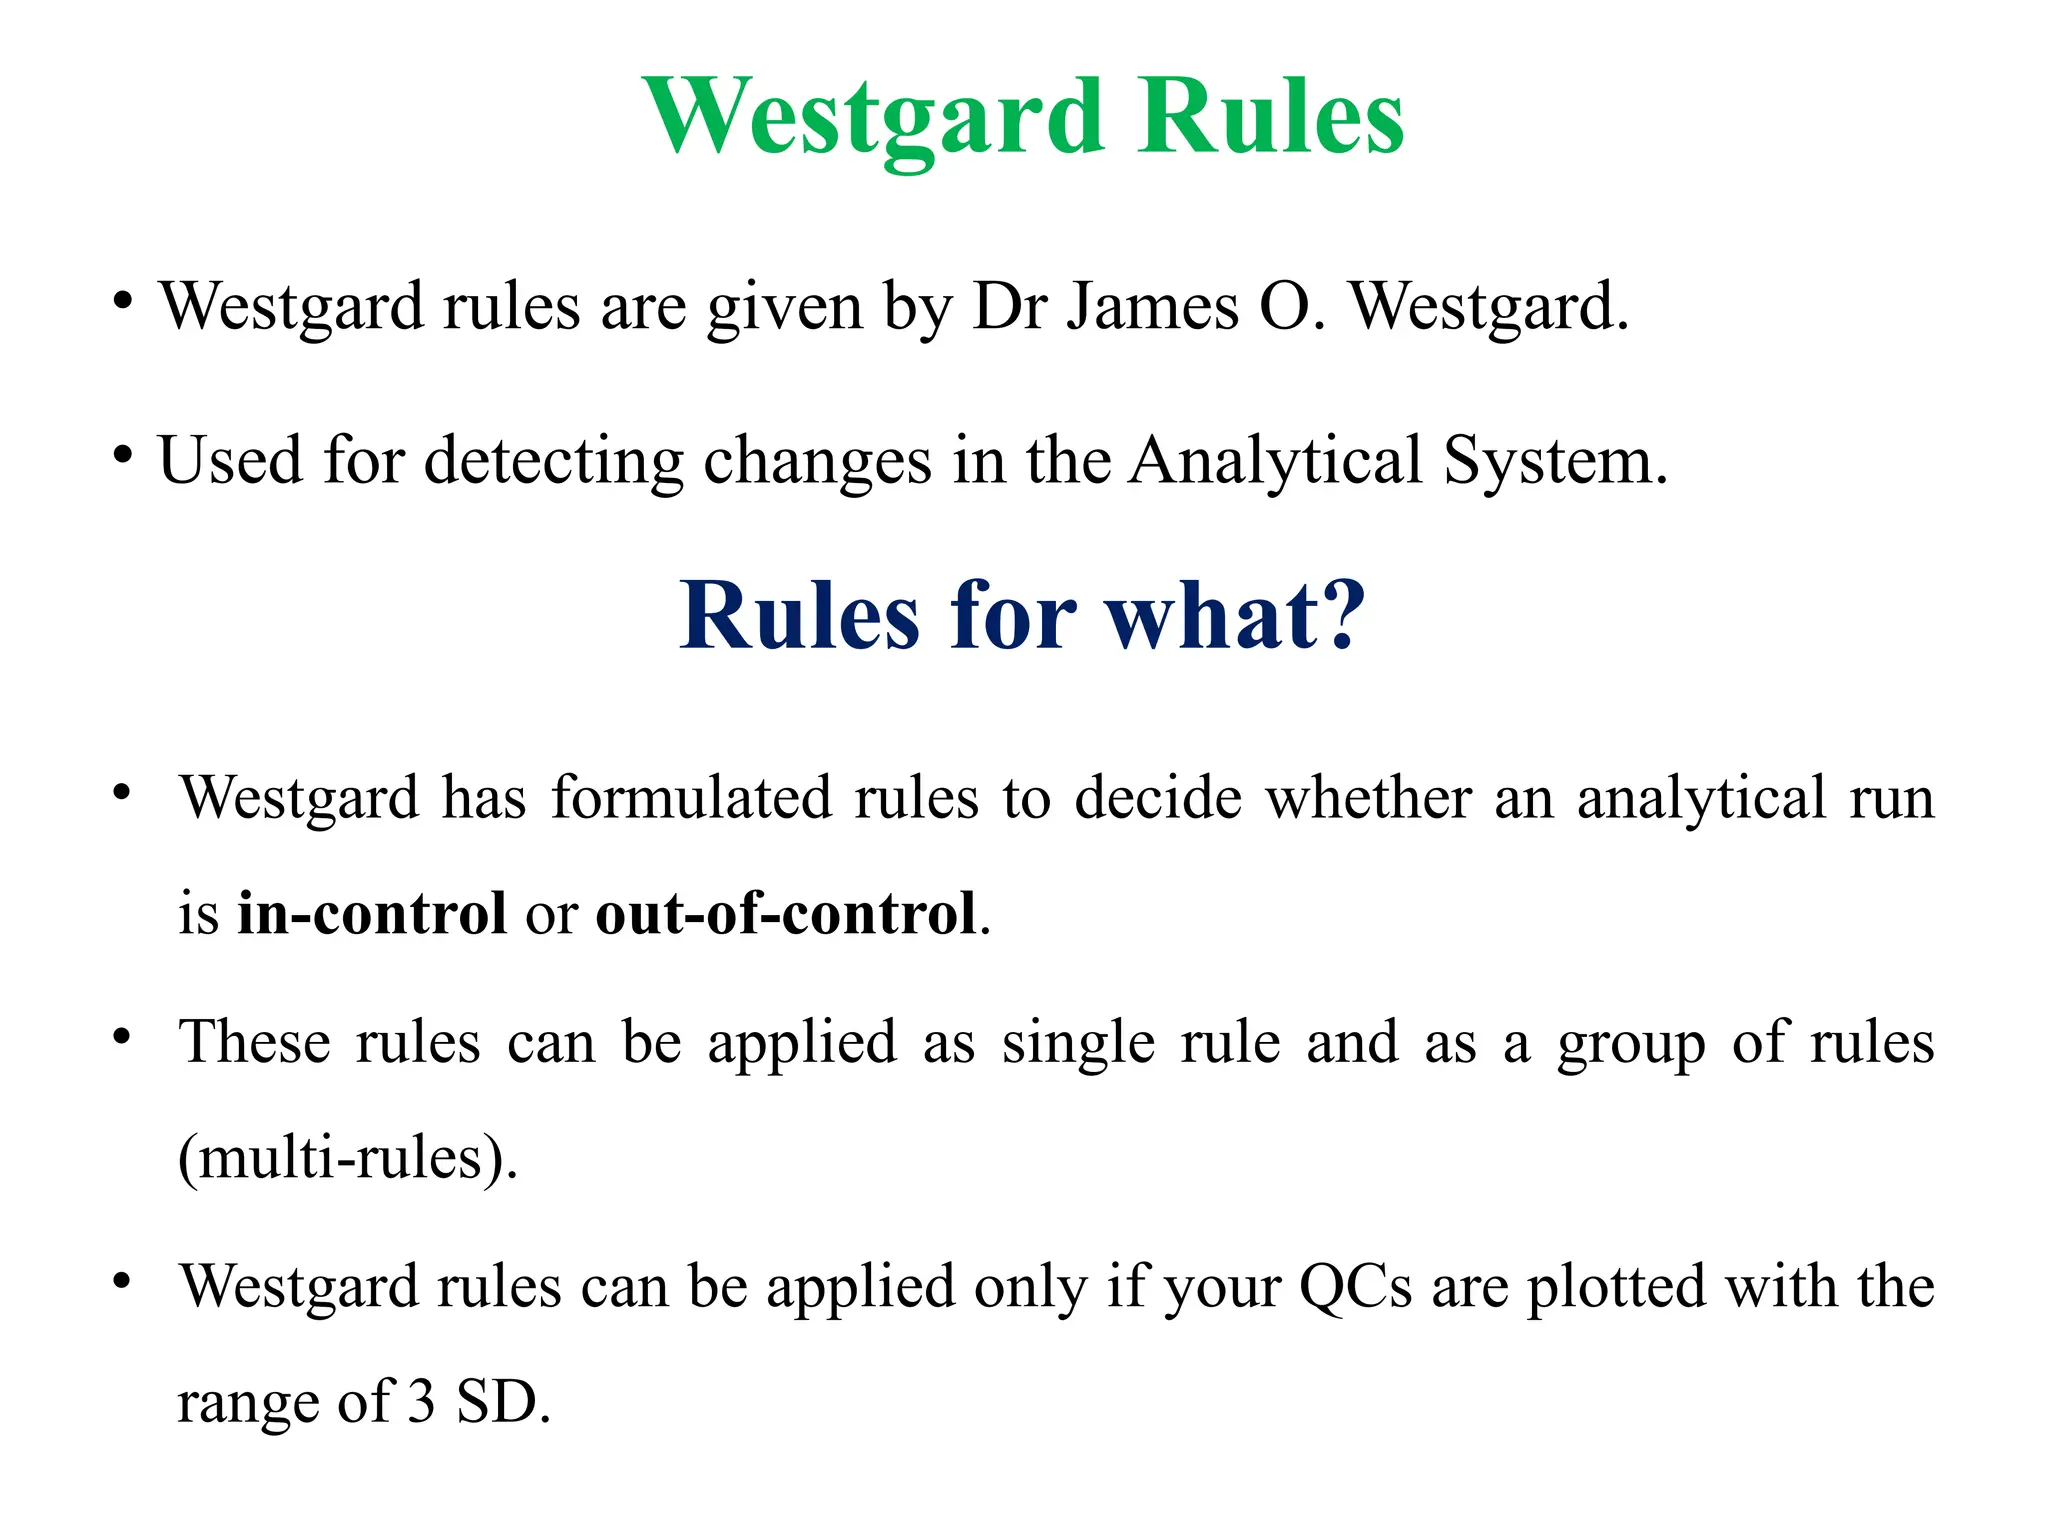
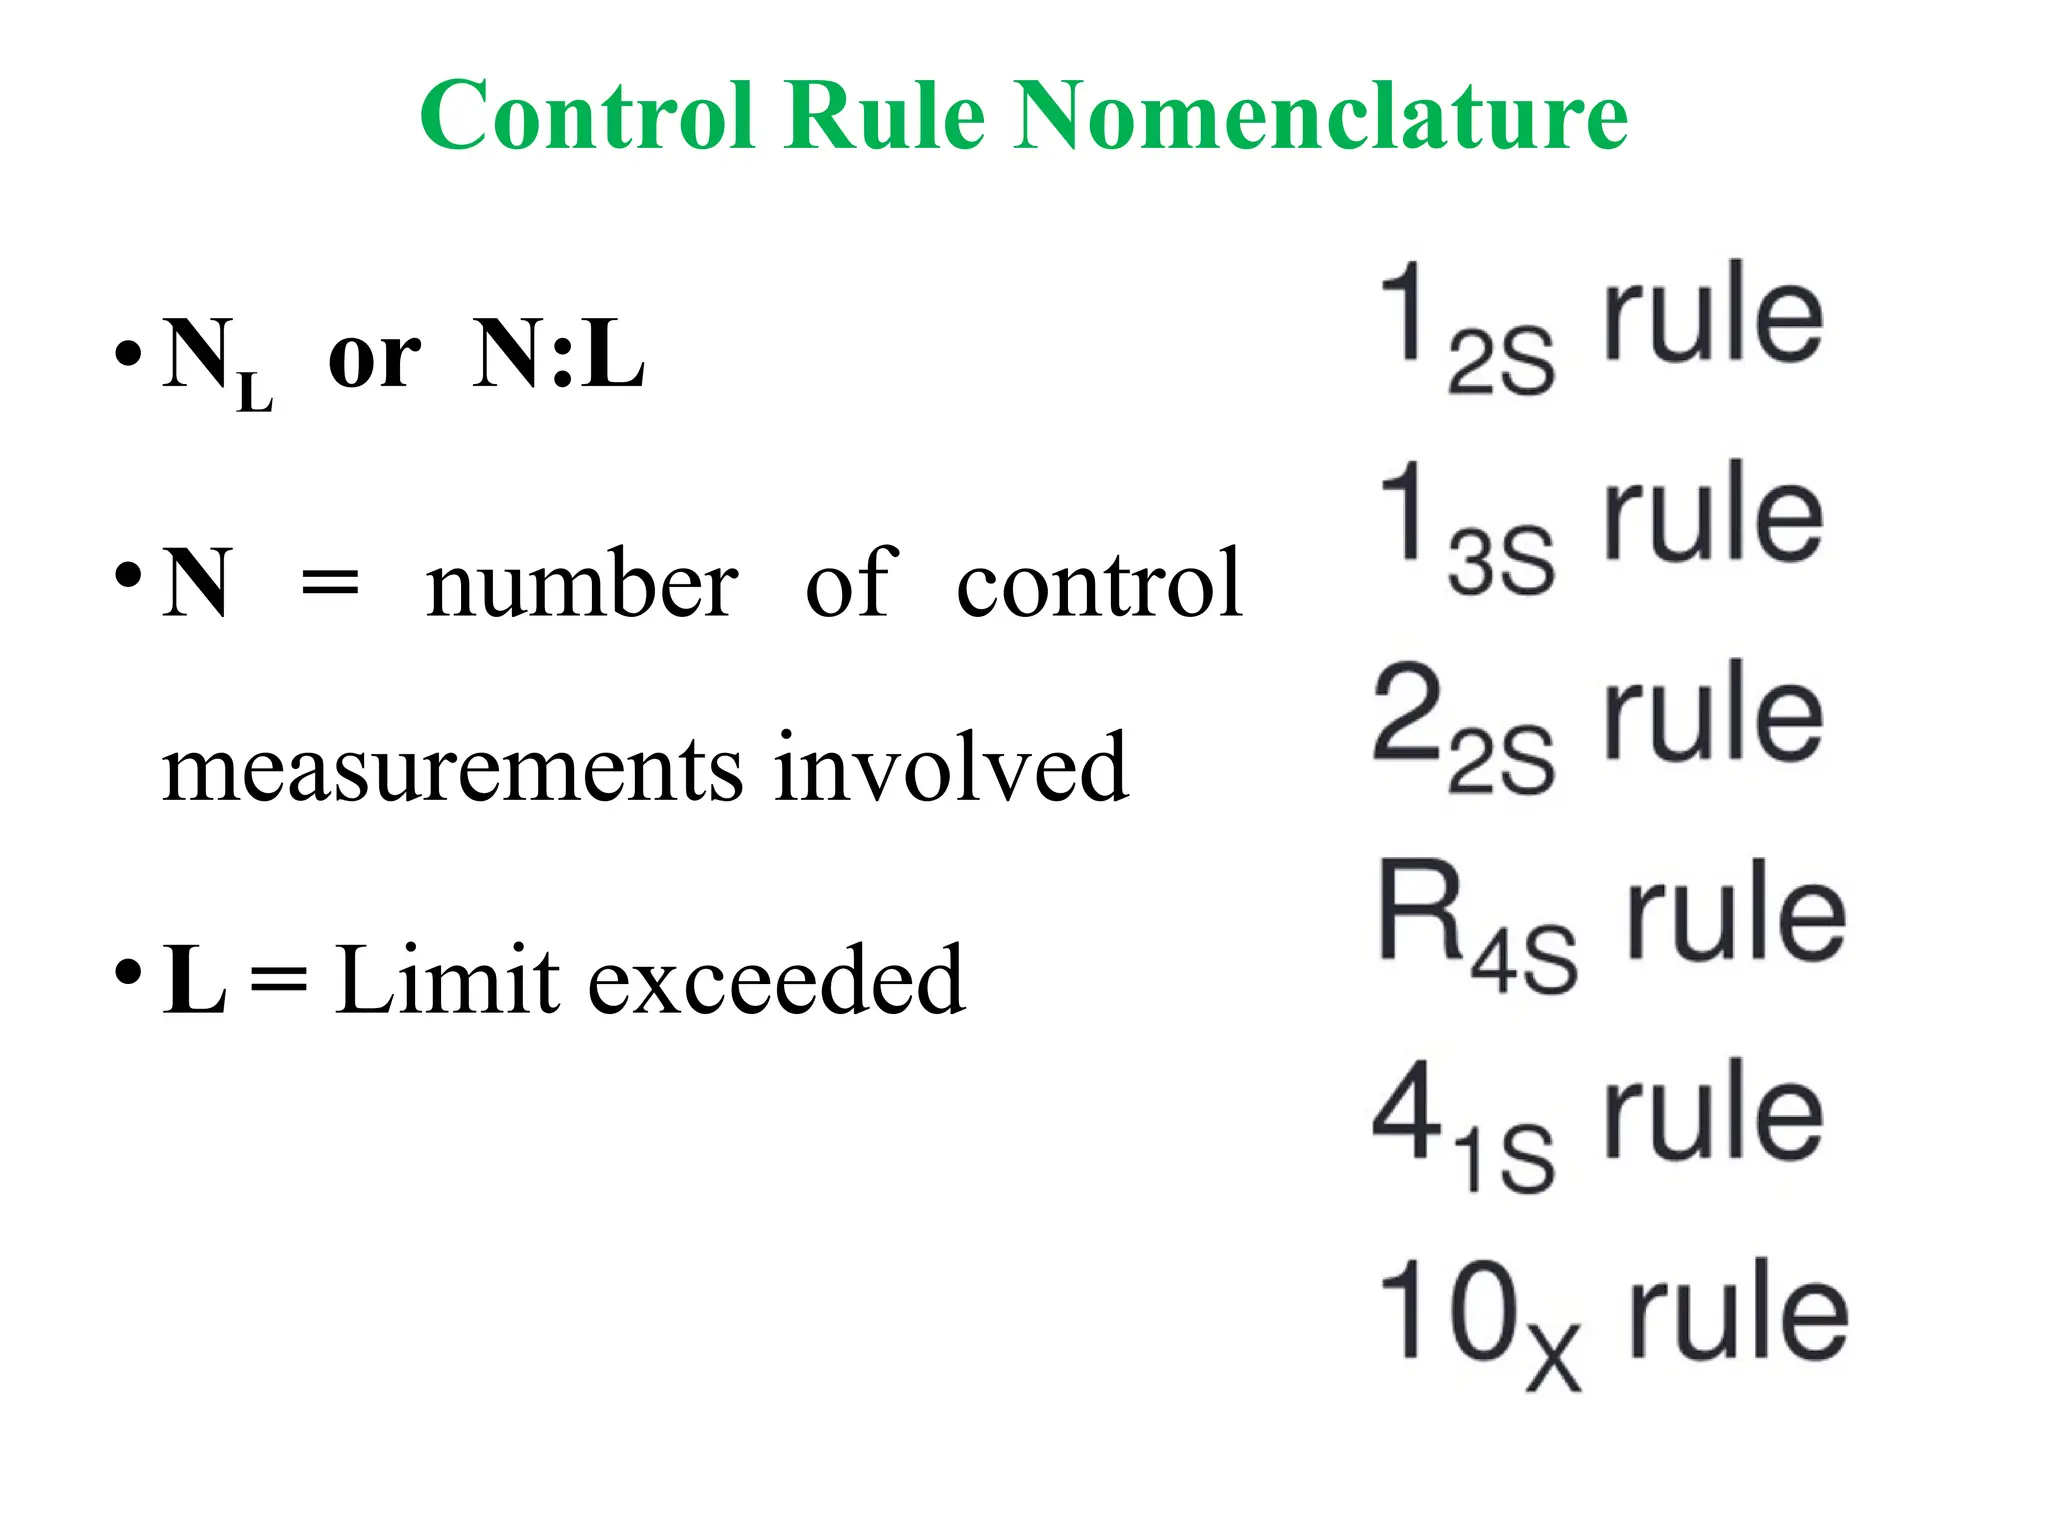
Westgard Rules
• Westgardrules are given by Dr James O. Westgard.
• Used for detecting changes in the Analytical System.
Rules for what?
• Westgard has formulated rules to decide whether an analytical run
is in-control or out-of-control.
• These rules can be applied as single rule and as a group of rules
(multi-rules).
• Westgard rules can be applied only if your QCs are plotted with the
range of 3 SD.