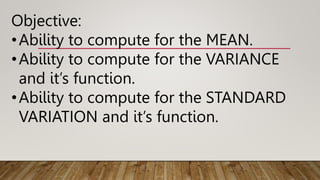
This document provides information about calculating the mean, variance, and standard deviation of a discrete probability distribution. It defines these key terms and provides the relevant formulas. Two examples are worked through, calculating these values for given probability distributions. In the first example, the mean is 5.45, variance is 1.95, and standard deviation is 1.40. In the second example, the mean is 10.5, variance is 57.25, and standard deviation is 7.57. The document concludes with an activity asking students to answer problems calculating these values.


![FORMULA
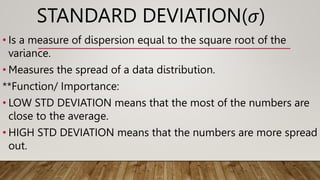
VARIANCE
If Population >> 𝜎2= ∑(𝑋 - 𝜇)2 ∙ 𝑃(𝑋)
OR
If Sample >> 𝜎2 = ∑[𝑋2 ∙ 𝑃(𝑋)] – 𝜇2](https://image.slidesharecdn.com/meanvarianceandstandarddeviation-230130134711-08ce2c13/85/Mean-Variance-and-standard-deviation-pptx-9-320.jpg)

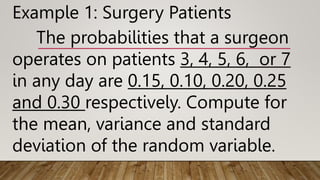

![SOLUTION: VARIANCE
Number of Patients (X) 3 4 5 6 7
Probability P(X) 0.15 0.10 0.20 0.25 0.30
𝜎2 = ∑[𝑋2 ∙ 𝑃(𝑋)] – (𝜇2)
𝜎
2
= ∑[𝑋
2
∙ 𝑃(𝑋)] – (𝜇
2
)
= {3
2
(0.15) + 4
2
(0.10) + 5
2
(0.20) + 6
2
(0.25) + 7
2
(0.30)} – (5.45
2
)
= (1.35 + 1.6 + 5 + 9 +14.7) – 29.70
= 31.65 – 29.70
𝜎
2
= 1.95](https://image.slidesharecdn.com/meanvarianceandstandarddeviation-230130134711-08ce2c13/85/Mean-Variance-and-standard-deviation-pptx-14-320.jpg)


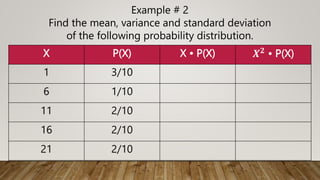

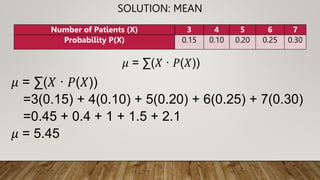
![X P(X) 𝑿𝟐
• P(X) ∑[𝑋2 ∙ 𝑃(𝑋)]
1 3/10 12
• 3/10 0.3
6 1/10 62
• 1/10 3.6
11 2/10 112
• 2/10 24.2
16 2/10 162
• 2/10 51.2
21 2/10 212
• 2/10 88.2
167.5
𝜎
2 = 167.5 - 10.52
= 57.25
Variance](https://image.slidesharecdn.com/meanvarianceandstandarddeviation-230130134711-08ce2c13/85/Mean-Variance-and-standard-deviation-pptx-19-320.jpg)